

Global corporate finance - Kim
.pdf72 THE BALANCE OF PAYMENTS
SUMMARY
The balance of payments summarizes all international transactions between residents of a country and residents of foreign countries during a specified period. The systematic record of these international transactions requires preestablished principles. These principles include rules or procedures, such as debits and credits, and definitions of terminology, such as the current account.
The balance of payments is neither an income statement nor a balance sheet. The balance of payments is a sources-and-uses-of-funds statement reflecting changes in assets, liabilities, and net worth during a specified period. Increases in assets and decreases in liabilities or net worth constitute debits (uses of funds). On the other hand, decreases in assets and increases in liabilities or net worth represent credits (sources of funds). Some international transactions, such as exports or imports, occur due to purely economic reasons. These transactions are called autonomous transactions. Such transactions as sales of gold or increases in foreign debt take place to account for differences between international payments and receipts. These transactions are often called compensating transactions.
Some countries have had deficits for many years. These deficits cannot be financed indefinitely by compensating transactions. The balance-of-payments deficit can be corrected by deflating the economy, devaluing the currency, and establishing public control. The first two methods are supposed to correct international disequilibrium through changes in prices, income, and interest rates. Government controls, such as exchange and trade controls, can be used to alleviate or correct the balance-of-payments deficit.
Questions
1What are the four major components of the current account?
2Briefly describe the financial account.
3If a country has a deficit on its current account, what are the consequences for the country’s balance of payments on financial account? Assume that the country practices a flexible exchange rate system.
4What is the role of net errors and omissions in the balance of payments? What are the major causes of the net errors and omissions?
5Most developing countries (excluding oil-exporting countries) have incurred huge balance-of-payments deficits for many years. What alternatives are available to these countries for dealing with their balance-of-payments problems?
6The US current-account trade deficit has risen sharply since 1997. Discuss some reasons for such a dramatic increase.
7What is the major difference between the balance of payments and the international investment position? When did the USA become a net debtor nation for the first time since World War I? Explain why the USA became a net debtor nation.
8What is the balance-of-payments identity?
REFERENCES 73
9What is adversarial trade? Why do both sides (the buyer and the seller) lose in adversarial trade?
10Explain why a currency depreciation will not necessarily improve the balance of trade.
11What is the J-curve?
Problems
1Answer questions 1(a) through 1(c) using example 3.1.
(a)Prepare the balance of payments in a good form.
(b)Does the country have a balance-of-payments deficit or surplus?
(c)How can the country account for this payments imbalance?
2Assume that a country has a current-account deficit of $10,000 and a financial-account surplus of $12,000. Assume that the capital account and net errors and omissions are negligible.
(a)Does the country have a balance-of-payments deficit or surplus?
(b)What will happen to the country’s official reserve account?
3A country has a merchandise trade surplus of $5,000, an income balance of zero, a current transfer surplus of $3,000, and a current-account deficit of $4,000. What is the service trade balance?
4Assume that: (1) a country has a current-account surplus of $10,000; (2) its financial account has a deficit of $15,000; and (3) its other two accounts – the capital account and net errors and omissions – are negligible. What is the balance of the country’s reserve account? How can the country eliminate the $5,000 imbalance on its balance of payments?
REFERENCES
Bergin, P., “Should We Worry about the Large US Current Account Deficit?” FRBSF Economic Letter, Dec. 22, 2002.
Brown, S. and P. Caputo, “China’s Growing Economic Influence in East Asia After WTO,” Southwest Economy, Federal Reserve Bank of Dallas, May/June 2002, pp. 13–15.
The Council of Economic Advisors, Economic Report of the United States, Washington, DC:
US Government Printing Office, various issues.
Edwards, S., Real Exchange Rates, Devaluation, and Adjustment: Exchange Rate Policy in Developing Countries, Cambridge, MA: The MIT Press, 1989.
Fieleke, N. S., What Is the Balance of Payments?
Boston, MA: Federal Reserve Bank of Boston, 1996.
74 THE BALANCE OF PAYMENTS
Forsyth, R. W., “No Overnight Cure: The Trade Deficit Follows the J Curve,” Barron’s, Feb. 10, 1986, p. 28.
International Monetary Fund, Balance of Payments Statistics Yearbook, various issues.
International Monetary Fund, Balance of Payments Manual, Washington, DC: IMF, 1976.
Kim, S. H., North Korea at a Crossroads, Jefferson, NC: McFarland, 2003.
Oskooee, M. B. and M. Malixi, “More Evidence on the J Curve from LDCs,” Journal of Policy Modeling, Oct. 1992, pp. 641–53.
Rosensweig, J. A. and P. D. Koch, “The US Dollar and the Delayed J-Curve,” Economic Review, Federal Reserve Bank of Atlanta, July/Aug. 1988, pp. 1–15.
The US Department of Commerce, Survey of Current Business, various issues.
Case Problem 3: USA–China Trade Relations
The history of Chinese trade is long and distinct, with the twentieth century being marked by large shifts in policy. A focus on the history of trade between the USA and China helps to reveal some of the fundamental moments in the history of Chinese trade. In 1936, the USA accounted for 22 percent of China’s exports and 20 percent of its imports. In 1949, the Chinese Communist Party seized control of China and, after decades of struggle, founded the People’s Republic of China. Under this new regime, the economy was completely state controlled. These changes, the Korean War from 1950 to 1953, and the subsequent embargo toward China caused a sharp decline in USA–China trade relations. In 1972, the American share of China’s total trade accounted for only 1.6 percent.
In 1978, under the new leadership of Deng Xiaoping, China began the long process of economic reform. Initially focused on just agricultural reform, these economic reforms eventually became a transition to a capitalist and globally integrated economy. Focused on the four modernizations – the modernization of industry, agriculture, science and technology, and national defense – these reforms represented a deep-seated shift in policy and helped to spur a steady growth of USA–China trade. Between 1990 and 2000, total trade rose from $20 million to over $116 billion. By 2000, America had become China’s second-largest trade partner and China was the USA’s fourth-largest importer, supplying a wide variety of goods. Moreover, investors poured money into China, with $400 billion invested in 2001, $28.5 billion of this coming from the USA alone. It is estimated that by 2010, China’s total imports will reach three trillion dollars, a large share of which will come from the USA.
For 13 years, China had applied for WTO membership, but this effort had not been successful, mainly due to US opposition. This opposition was based on a laundry list of economic and political issues, including concerns with human rights, tension between Taiwan and China, China’s nuclear arsenal, objections from labor unions in the USA, and the use of protectionist policies by China. “As bad as our trade deficit with China is today, it will grow even worse if we approve a permanent trade deal,” said House Minority Whip David Bonior (D., Mich.) back in October 1999. Even with this opposition, on November 15, 1999, an historic agreement was reached between Chinese and American trade negotiators, which set the stage for China’s formal entry into the WTO.
|
CASE PROBLEM 3 |
75 |
|
|
|
|
|
|
|
|
|
|
|
|
|
Surplus ($ billions)
Deficit ($ billions)
Mexico |
|
China |
|
$0 |
|
|
|
–25 |
|
|
|
–50 |
|
|
|
NAFTA |
|
|
|
passes |
|
|
|
–75 |
|
|
|
–100 |
|
|
China |
|
joins WTO |
||
|
|
||
–125 |
|
|
|
1990 1992 |
1994 |
1996 |
1998 2000 2002 |
|
Year |
|
|
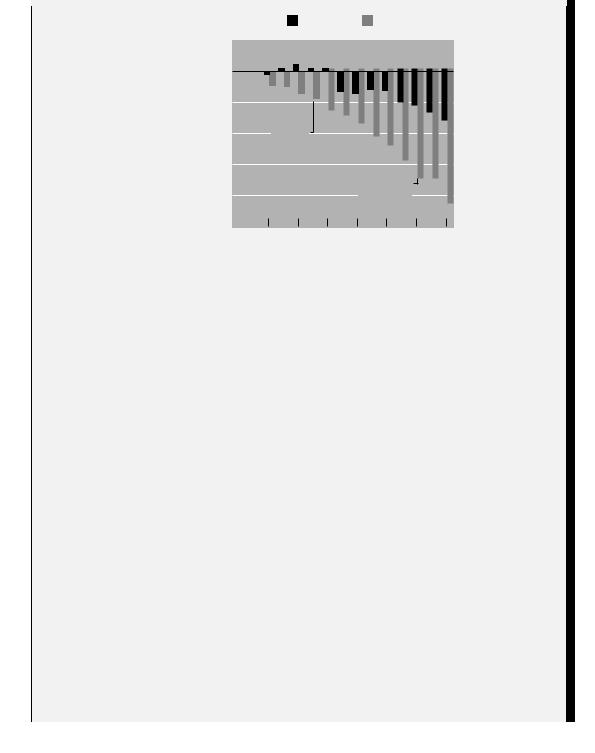
Figure 3.3 US trade balances with Mexico and China
Source: The Wall Street Journal, Aug. 4, 2003, p. A4.
One of the major worries by those who opposed the normalization of trade relations with China was concern about a growing trade imbalance between the two countries. According to US trade data, the trade deficit with China was $69 billion in 1999, $83 billion in 2000, $85 billion in 2001, and $103 billion in 2002 (see figure 3.3). Many believed that this growing deficit was due to China’s high tariffs and numerous restrictions on American exports. In joining the WTO on December 11, 2001, China agreed to lower its average tariff from 16.7 percent in 2000 to 10 percent in 2005, and to reduce the number of items under import license and quota from approximately 300 to zero in the next 5 years. In addition, China agreed to liberalize foreign investment in banking, insurance, financial services, wholesale/retail trade, and telecommunications. All these industries had been under tight government control until recently.
In return, the USA granted China permanent normalized trade relations status. Without this legislation, China’s trade status would be open to yearly debate, as it had been in the past. Additionally, China, as a member of the WTO, now enjoys open markets with all other WTO members, including the USA. One area in which this has provided a great advantage for China’s exports is in its textile industry. Textiles have been one of the Chinese major export items but, for years, the USA had imposed a quota on them. With the removal of these tariffs, the Chinese textile industry has boomed and it grew by 27 percent in 2001.
Many US multinational companies are in the midst of an unprecedented wave of shifting capital and technology to plants in China and other low-cost locales. This wave pulls away vast chunks of business that formerly filtered down through the intricate networks of suppliers and producers inside the USA. While the tension is most acute in trade associations and other industry groups, it has recently gained political momentum that threatens to spill over into political debates. To be sure, there are some things that all manufacturers can rally
76 THE BALANCE OF PAYMENTS
around, such as the broad push to get China to stop pegging the value of the yuan to the dollar at what many believe is an artificially low level. Some economists believe that the Chinese currency is undervalued by as much as 40 percent, which gives Chinese goods a built-in advantage against identical US products. Even with the unanimity, the Bush Administration does not appear eager to get involved.
In dollar terms, China’s economy is about 10 percent of the US economy and 20 percent of Japan’s. After adjusting for differences in the cost of living (purchasing power parity), however, China’s economy is more than half as large as the US economy and surpassed Japan to become the world’s second-largest economy; in 2002, the gross domestic product was $10.1 trillion for the USA, $6 trillion for China, and $3.6 for Japan. It grew 7.3 percent in 2001 and an average of about 9 percent annually between 1980 and 2000. China expects its economy to grow at an annual rate of 6–7 percent over the next 10 years. China’s membership of the WTO represents another great step as it continues to move toward a more capitalistic economy. It will increase the opportunities for Chinese growth and will help China play an increasingly large role in the global economy. All of these trends together point to the emergence of China as a dominant, if not the dominant, economic power for the coming century.
China’s first manned space shot – the blastoff of a rivalry with the USA and Russia in civil space exploration and military innovation – happened in a flash but reflects the long, methodical effort of a serious program. The Shenzhou V spacecraft, launched on October 15, 2003, circled Earth 14 times before safely parachuting onto the grasslands of Inner Mongolia. The Shenzhou’s progress heightened already strong public enthusiasm for the 11-year-old manned program as a symbol of China’s rising economic and technical prowess.
Case Questions
1What are some of the sources of trade friction between China and the USA? Why do some scholars view this friction as a positive sign?
2What is managed trade and how does it apply to China and the USA?
3Discuss what steps the USA can take to reduce its trade deficit with China. Mention the deflation of economies, devaluation of the currency, and the establishment of public control.
4Suppose that the value of the US dollar sharply depreciates. Under these conditions, how would the J-curve discussed in this chapter apply to the trade relationship between China and the USA?
5Discuss in broad terms the major changes since World War II in the trade relations between China and the USA in terms of actual balance of payments and foreign direct investment.
6The website of the US Central Intelligence Agency, www.cia.gov, and the website of the US Census Bureau, www.census.gov, both contain economic data and statistics on trade.

|
CASE PROBLEM 3 |
77 |
|
|
|
|
|
|
|
|
|
|
|
|
|
Use specific numbers from these two sites to support some of your claims in the answer to question 5.
Sources: Anonymous, “American Firms Rushing to Build in China,” USA Today, Aug. 2002; anonymous, “Competing with China,” Business Mexico, July 2002; T. Aeppel, “US–China Trade Becomes a Delicate Issue of Turf,” The Wall Street Journal, July 23, 2003; F. M. Armbrecht, Jr, “WTO Entry, Government’s Welcome Could Spur Foreign R&D in China,” Research Technology Management, Sept./Oct. 2002; S. Brown and P. Caputo, “China’s Growing Economic Influence in East Asia After WTO,” Southwest Economy, Federal Reserve Bank of Dallas, May/June 2002, pp. 13–15; C. Y. Cheng, “The future prospects of US–China economic relations,” USA Today, Sept. 2002; H. Cooper, “Trade Gap Sets Record for March – Oil’s Rise is Cited; Debate Now Focuses on Status of China,” The Wall Street Journal, May 22, 2000; and P. Wonacott and G. Winestock, “A Global Journal Report: China and US Make Progress on Trade Rifts,” The Wall Street Journal, Sept. 26, 2002.

CHAPTER 4
The International
Monetary System
Opening Case 4: The Euro – A Story of Change
On January 1, 2002, the euro (€) officially became the national currency for 300 million people in 12 countries – Austria, Belgium, Finland, France, Germany, Greece, Ireland, Italy, Luxembourg, Portugal, Spain, and the Netherlands. This move constituted a major change in the region and has resulted in many fundamental changes. In this case, the broad changes will be discussed, and then some of the specifics of the process will be explored by focusing on Italy’s transition from the lira to the euro.
The euro was first used by monetary authorities and businesses on January 1, 1999. On July 1, 2002, euro coins and notes officially replaced the national coins and notes of the 12 Euroland countries. In recent years, the euro has been associated with deeper capital markets and increasing demands by shareholders for better corporate governance. Steps have also been taken to pool economic data and to better coordinate banking oversight across national boundaries. And the euro has helped drive long overdue industry consolidations, from telecommunications to airlines. Overall, the euro has become the world’s second-largest currency in terms of gross domestic product and has assisted in the recent trend of slow but sure market-opening liberalization in Europe.
The euro has also resulted in positive daily life benefits for European citizens. For example, when these citizens travel to other euro countries, they can more easily compare prices, and they will not have to stop at a foreign-exchange window and hand over a foreign-exchange commission. Consumers are already gaining from their new ability to compare prices in one currency. In 2001, the website of the French national railway system started quoting a single, euro-denominated price, instead of 12 different prices; the result was consumer savings of as much as 20 percent. In short,

OPENING CASE 4 |
79 |
|
|
economic life in Europe has become simpler, and this is generally good for both consumers and businesses.
To help further examine the impact of the currency change, the history of the euro in one nation, Italy, will be discussed. Like most of its European Union (EU) partners, Italy opted to phase in the euro gradually over 2 months. The lira, which traces its origins back to AD 794 and Charlemagne’s libra, ran alongside the new currency from January 2002 until the end of February 2002, before it was officially decommissioned on March 1, 2002 (although it is still possible to exchange lira for euros at the Bank of Italy for another 10 years).
This transition period was not easy for Italy. According to the retailers’ association Confcommercio, only 37 percent of Italians were aware that checks must be written in euros as of January 1, 2002, while about 80 percent believed that the lira would continue to circulate after February 28, 2002. Furthermore, a survey conducted in July 2001 by a public think tank showed that 30 percent of Italians were still not sure what the euro was, about 43 percent were unaware of the timetable for the changeover, and only 21 percent knew how much a euro would actually be worth (1,936.27 lira).
Beyond these public knowledge problems, the transition was not free. It is estimated that the total changeover cost approximately 5 trillion lira ($2.3 billion). Much of this expense fell on the business sector, which carried the overall costs of training and upgrading equipment, estimated at $934 million. Confcommercio figured that big retailers spent some 0.3 percent of yearly sales preparing for the euro, while small shopkeepers ended up investing as much as 2 percent of their revenues.
To combat these problems, the Italian government took some preventive steps. First, shops and supermarkets were required to offer euro–lira calculators at checkout points, and special toll-free numbers were created to help customers to report irregularities. Second, little yellow and blue euro converters were sent to every Italian home. In the end though, after the anxieties of the first few days of the changeover had passed, Italians decided that the gadget really was not very useful and became comfortable with the new currency.
There were also some practical changes that came with the new currency. The single euro is a coin and the bills are larger than the lira bills. Therefore, the biggest Christmas present in Italy in 2001 was a euro-sized wallet. Also, vending machines, which are ubiquitous in Italy, had to be refitted for the euro. This often resulted in pricing changes. In one humorous example, access to the only public toilet in Voghera, a small town in northern Italy, now costs almost twice as much as it did before the changeover. “It is all a question of coins,” the local administrators replied. “It is too complicated to modify the token dispenser.”
This example also illustrates the single biggest problem Italy has had with the transition – inflation. Before the euro was implemented, prices for goods could vary by as much as 50 percent between nations. The transition therefore resulted in price fluctuations to correct these differences; and it was southern countries such as Italy in particular, which are poorer than their northern neighbors, that felt the impact of these fluctuations. Additionally, there was suspicion in Italy, as in other countries, that prices were raised due to opportunistic rounding during the changeover. With an

80 THE INTERNATIONAL MONETARY SYSTEM
official exchange rate fixed at 1,936.27 lira per euro, opportunistic round-number readjustments were inevitable.
Therefore, the changeover to the euro resulted in inflation, especially for the small things that people buy every day – food, coffee, and haircuts. Higher-priced items, such as cars and computers, have held steady or even in some cases declined in price due to increased competition across the European Union. As the economist Katinka Barish of the Centre for European Reform noted, “You might have competition on a Euro-wide basis for cars, but you cannot do that on things like kebabs.” For example, prices in cafés and restaurants rose 4.3 percent in 2002 – nearly double the general inflation rate. Importantly, this is the inflation that people notice most, resulting in a large difference between perceived inflation and actual inflation.
Italian consumers have been particularly indignant about price increases and some groups have led strikes in which consumers vowed to stop buying things for a day. One consumer, Jose Elorrieta, a Milan engineer and university professor with two young daughters, says that the price of the high-end cured ham his family buys for Christmas nearly doubled in 2002, to 60 euros a kilogram, or about $28 a pound, compared with 36 euros a kilogram, or $16.80 a pound, at the end of 2001. “It is the same story with clothes, with shoes – everything has gone up brutally, and it is almost exclusively due to the introduction of the euro,” complains Mr Elorrieta, who says he has cut back on holiday spending as a result.
The government has taken steps to combat inflation. The prime minister’s mother complained that pasta prices had trebled since the euro’s launch and, in response, he took action. To combat Italy’s fast-rising prices, he called for a 3-month freeze on electric, gas, and postal prices. Even with these initial hiccups, however, the introduction of the euro should be positive for both Italy and the continent. The move to a standardized system, cooperation, and more accountability should result in economic growth for the region. As the examination of Italy’s process shows, the change has not been completely smooth, but overall it has been positive.
Sources: Anonymous, “Happy New Euro,” The Wall Street Journal, Dec., 2001; J. Casison, “Currency Conversion: The Euro Becomes a Reality,” Incentive, Jan. 2002; N. D’Aquino, “Rome: Berlusconi Gets Popular Points for Euro Converter,” Europe, Apr. 2002; A. Galloni, “Euro’s First Noel Hits Sour Notes With Shoppers,” The Wall Street Journal, Dec., 2002; S. Jewkes, “Arrivederci Lira,” Europe, Dec./Jan. 2002; G. Winestock and G. T. Sims, “What the Euro Has Been Up To for the Past Three Years – Tuesday is Debut of Cash, but Common Currency Already Has Made a Mark,” The Wall Street Journal, Dec., 2001; and T. Vlahou and C. Power, “Europe’s Gouging Gap; Created to Unite the Continent, the Euro has Inspired Fury over Price Rises, Particularly in the Poorer South,” Newsweek, Oct. 2002.
The international monetary system consists of laws, rules, institutions, instruments, and procedures, which involve international transfers of money. These elements affect foreign-exchange rates, international trade and capital flows, and balance-of-payments adjustments. Foreignexchange rates determine prices of goods and services across national boundaries. These exchange rates also affect international loans and foreign investment. Hence the international monetary

A SUCCESSFUL FOREIGN-EXCHANGE SYSTEM |
81 |
|
|
system plays a critical role in the financial management of multinational business and economic policies of individual countries.
This chapter has five major sections. The first section provides an overview of a successful foreign-exchange system. The second section presents a history of the international monetary system, from the gold standard of the late nineteenth century to the hybrid exchange system that prevails today. The third section describes the International Monetary Fund and special drawing rights. The fourth section discusses the European Monetary System. The fifth section examines proposals for further international monetary reform.
4.1 A Successful Foreign-Exchange System
A multinational company’s access to international capital markets and its freedom to move funds across national boundaries are subject to a variety of national constraints. These constraints are frequently imposed to meet international monetary agreements on determining exchange rates. Constraints may also be imposed to correct the balance-of-payments deficit or to promote national economic goals.
A successful exchange system is necessary to stabilize the international payment system. To be successful, an exchange system should meet three conditions:
1Balance-of-payments deficits or surpluses by individual countries should not be too large or prolonged.
2Such deficits or surpluses should be corrected in ways that do not cause unacceptable inflation or physical restrictions on trade and payments for either individual countries or the whole world.
3The maximum sustainable expansion of trade and other international economic activities should be facilitated.
Theoretically, continuous balance-of-payments deficits and surpluses cannot exist around the world. Under a system of freely flexible exchange rates, a foreign-exchange market clears itself in the same way a competitive market for goods does. Just like every commodity price, each exchange rate moves to a level at which demand and supply are equal. Under a system of fixed exchange rates, central banks or other designated agencies buy and sell on the open market to absorb surpluses and to eliminate deficiencies of foreign currencies at the fixed exchange rates.
4.1.1Currency values and terminology
A foreign-exchange rate is the price of one currency expressed in terms of another currency. A fixed exchange rate is an exchange rate that does not fluctuate or that changes within a predetermined band. The rate at which the currency is fixed or pegged is called the “par value.” A floating or flexible exchange rate is an exchange rate that fluctuates according to market forces.
Although governments do not attempt to prevent fundamental changes in the exchange rate between their own currency and other currency, they typically attempt to maintain orderly trading conditions in the market. A flexible exchange system has a number of advantages: