

- •Foreword
- •Preface
- •Contents
- •About the Editors
- •Contributors
- •1: Tracheobronchial Anatomy
- •Trachea
- •Introduction
- •External Morphology
- •Internal Morphology
- •Mucous Layer
- •Blood Supply
- •Anatomo-Clinical Relationships
- •Bronchi
- •Main Bronchi
- •Bronchial Division
- •Left Main Bronchus (LMB)
- •Right Main Bronchus (RMB)
- •Blood Supply
- •References
- •2: Flexible Bronchoscopy
- •Introduction
- •History
- •Description
- •Indications and Contraindications
- •Absolute Contraindications
- •Procedure Preparation
- •Technique of FB Procedure
- •Complications of FB Procedure
- •Basic Diagnostic Procedures
- •Bronchoalveolar Lavage (BAL)
- •Transbronchial Lung Biopsy (TBLB)
- •Transbronchial Needle Aspiration (TBNA)
- •Bronchial Brushings
- •Advanced Diagnostic Bronchoscopy
- •EBUS-TBNA
- •Ultrathin Bronchoscopy
- •Transbronchial Lung Cryobiobsy (TBLC)
- •Therapeutic Procedures Via FB
- •LASER Bronchoscopy
- •Electrocautery
- •Argon Plasma Coagulation (APC)
- •Cryotherapy
- •Photodynamic Therapy
- •Airway Stent Placement
- •Endobronchial Valve Placement
- •Conclusion
- •References
- •History and Historical Perspective
- •Indications and Contraindications
- •Procedure Description
- •Procedure Planning
- •Target Approximation
- •Sampling
- •Complications
- •Future Directions
- •Summary and Recommendations
- •References
- •4: Rigid Broncoscopy
- •Innovations
- •Ancillary Equipment
- •Rigid Bronchoscopy Applications
- •Laser Bronchoscopy
- •Tracheobronchial Prosthesis
- •Transbronchial Needle Aspiration (TBNA)
- •Rigid Bronchoscope in Other Treatments for Bronchial Obstruction
- •Mechanical Debridement
- •Pediatric Rigid Bronchoscopy
- •Tracheobronchial Dilatation
- •Foreign Bodies Removal
- •Other Indications
- •Complications
- •The Procedure
- •Some Conclusions
- •References
- •History and Historical Perspective
- •Indications and Contraindications
- •Preprocedural Evaluation and Preparation
- •Physical Examination
- •Procedure-Related Indications
- •Application of the Technique
- •Topical Anesthesia
- •Anesthesia of the Nasal Mucosa and Nasopharynx
- •Anesthesia of the Mouth and Oropharynx
- •Superior Laryngeal Nerve Block
- •Recurrent Laryngeal Nerve Block (RLN)
- •Conscious Sedation
- •Monitored Anesthesia Care (MAC)
- •General Anesthesia
- •Monitoring the Depth of Anesthesia
- •Interventional Bronchoscopy Suites
- •Airway Devices
- •Laryngeal Mask Airway (LMA)
- •Endotracheal Tube (ETT)
- •Rigid Bronchoscope
- •Modes of Ventilation
- •Spontaneous Ventilation
- •Assisted Ventilation
- •Noninvasive Positive Pressure Ventilation (NIV)
- •Positive Pressure Controlled Mechanical Ventilation
- •Jet Ventilation
- •Electronic Mechanical Jet Ventilation
- •Postprocedure Care
- •Special Consideration
- •Anesthesia for Peripheral Diagnostic and Therapeutic Bronchoscopy
- •Anesthesia for Interventional Bronchoscopic Procedures During the COVID-19 Pandemic
- •Summary and Recommendations
- •Conclusion
- •References
- •Background
- •Curricular Structure and Delivery
- •What Is a Bronchoscopy Curriculum?
- •Tradition, Teaching Styles, and Beliefs
- •Using Assessment Tools to Guide the Educational Process
- •The Ethics of Teaching
- •When Learners Teach: The Journey from Novice to Mastery and Back Again
- •The Future Is Now
- •References
- •Interventional Procedure
- •Assessment of Flow–Volume Curve
- •Dyspnea
- •Analysis of Pressure–Pressure Curve
- •Conclusions
- •References
- •Introduction
- •Adaptations of the IP Department
- •Environmental Control
- •Personal Protective Equipment
- •Procedure Performance
- •Bronchoscopy in Intubated Patients
- •Other Procedures in IP Unit
- •References
- •Introduction
- •Safety
- •Patient Safety
- •Provider Safety
- •Patient Selection and Screening
- •Lung Cancer Diagnosis and Staging
- •Inpatients
- •COVID-19 Clearance
- •COVID Clearance: A Role for Bronchoscopy
- •Long COVID: A Role for Bronchoscopy
- •Preparing for the Next Pandemic
- •References
- •Historical Perspective
- •Indications and Contraindications
- •Evidence-Based Review
- •Summary and Recommendations
- •References
- •Introduction
- •Clinical Presentation
- •Diagnosis
- •Treatment
- •History and Historical Perspectives
- •Indications and Contraindications
- •Benign and Malignant Tumors
- •Tumors with Uncertain Prognosis
- •Application of the Technique
- •Evidence Based Review
- •Summary and Recommendations
- •References
- •12: Cryotherapy and Cryospray
- •Introduction
- •Historical Perspective
- •Equipment
- •Cryoadhesion
- •Indications
- •Cryorecanalization
- •Cryoadhesion and Foreign Body Removal
- •Cryoadhesion and Mucus Plugs/Blood Clot Retrieval
- •Endobronchial Cryobiopsy
- •Transbronchial Cryobiopsy for Lung Cancer
- •Safety Concerns and Contraindications
- •Cryoablation
- •Indications
- •Evidence
- •Safety Concerns and Contraindications
- •Cryospray
- •Indications
- •Evidence
- •Safety Concerns and Contraindications
- •Advantages of Cryotherapy
- •Limitations
- •Future Research Directions
- •References
- •13: Brachytherapy
- •History and Historical Perspective
- •Indications and Contraindications
- •Application of the Technique
- •Evidence-Based Review
- •Adjuvant Treatment
- •Palliative Treatment
- •Complications
- •Summary and Recommendations
- •References
- •14: Photodynamic Therapy
- •Introduction
- •Photosensitizers
- •First-Generation Photosensitizers
- •M-Tetrahidroxofenil Cloro (mTHPC) (Foscan®)
- •PDT Reaction
- •Tumor Damage Process
- •Procedure
- •Indications
- •Curative PDT Indications
- •Palliative PDT Indications
- •Contraindications
- •Rationale for Use in Early-Stage Lung Cancer
- •Rationale
- •PDT in Combination with Other Techniques for Advanced-Stage Non-small Cell Lung Cancer
- •Commentary
- •Complementary Endoscopic Methods for PDT Applications
- •New Perspectives
- •Other PDT Applications
- •Conclusions
- •References
- •15: Benign Airways Stenosis
- •Etiology
- •Congenital Tracheal Stenosis
- •Iatrogenic
- •Infectious
- •Idiopathic Tracheal Stenosis
- •Distal Bronchial Stenosis
- •Diagnosis Methods
- •Patient History
- •Imaging Techniques
- •Bronchoscopy
- •Pulmonary Function Test
- •Treatment
- •Endoscopic Treatment
- •Dilatation
- •Laser Therapy
- •Stents
- •How to Proceed
- •Stent Placement
- •Placing a Montgomery T Tube
- •The Rule of Twos for Benign Tracheal Stenosis (Fig. 15.23)
- •Surgery
- •Summary and Recommendations
- •References
- •16: Endobronchial Prostheses
- •Introduction
- •Indications
- •Extrinsic Compression
- •Intraluminal Obstruction
- •Stump Fistulas
- •Esophago-respiratory Fistulas (ERF)
- •Expiratory Central Airway Collapse
- •Physiologic Rationale for Airway Stent Insertion
- •Stent Selection Criteria
- •Stent-Related Complications
- •Granulation Tissue
- •Stent Fracture
- •Migration
- •Contraindications
- •Follow-Up and Patient Education
- •References
- •Introduction
- •Overdiagnosis
- •False Positives
- •Radiation
- •Risk of Complications
- •Lung Cancer Screening Around the World
- •Incidental Lung Nodules
- •Management of Lung Nodules
- •References
- •Introduction
- •Minimally Invasive Procedures
- •Mediastinoscopy
- •CT-Guided Transthoracic Biopsy
- •Fluoroscopy-Guided Transthoracic Biopsies
- •US-Guided Transthoracic Biopsy
- •Thoracentesis and Pleural Biopsy
- •Thoracentesis
- •Pleural Biopsy
- •Surgical or Medical Thoracoscopy
- •Image-Guided Pleural Biopsy
- •Closed Pleural Biopsy
- •Image-Guided Biopsies for Extrathoracic Metastases
- •Tissue Acquisition, Handling and Processing
- •Implications of Tissue Acquisition
- •Guideline Recommendations for Tissue Acquisition in Mediastinal Staging
- •Methods to Overcome Challenges in Tissue Acquisition and Genotyping
- •Rapid on-Site Evaluation (ROSE)
- •Sensitive Genotyping Assays
- •Liquid Biopsy
- •Summary, Recommendations and Highlights
- •References
- •History
- •Data Source and Methodology
- •Tumor Size
- •Involvement of the Main Bronchus
- •Atelectasis/Pneumonitis
- •Nodal Staging
- •Proposal for the Revision of Stage Groupings
- •Small Cell Lung Cancer (SCLC)
- •Discussion
- •Methodology
- •T Descriptors
- •N Descriptors
- •M Descriptors
- •Summary
- •References
- •Introduction
- •Historical Perspective
- •Fluoroscopy
- •Radial EBUS Mini Probe (rEBUS)
- •Ultrasound Bronchoscope (EBUS)
- •Virtual Bronchoscopy
- •Trans-Parenchymal Access
- •Cone Beam CT (CBCT)
- •Lung Vision
- •Sampling Instruments
- •Conclusions
- •References
- •History and Historical Perspective
- •Narrow Band Imaging (NBI)
- •Dual Red Imaging (DRI)
- •Endobronchial Ultrasound (EBUS)
- •Optical Coherence Tomography (OCT)
- •Indications and Contraindications
- •Confocal Laser Endomicroscopy and Endocytoscopy
- •Raman Spectrophotometry
- •Application of the Technique
- •Supplemental Technology for Diagnostic Bronchoscopy
- •Evidence-Based Review
- •Summary and Recommendations, Highlight of the Developments During the Last Three Years (2013 on)
- •References
- •Introduction
- •History and Historical Perspective
- •Endoscopic AF-OCT System
- •Preclinical Studies
- •Clinical Studies
- •Lung Cancer
- •Asthma
- •Airway and Lumen Calibration
- •Obstructive Sleep Apnea
- •Future Applications
- •Summary
- •References
- •23: Endobronchial Ultrasound
- •History and Historical Perspective
- •Equipment
- •Technique
- •Indication, Application, and Evidence
- •Convex Probe Ultrasound
- •Equipment
- •Technique
- •Indication, Application, and Evidence
- •CP-EBUS for Malignant Mediastinal or Hilar Adenopathy
- •CP-EBUS for the Staging of Non-small Cell Lung Cancer
- •CP-EBUS for Restaging NSCLC After Neoadjuvant Chemotherapy
- •Complications
- •Summary
- •References
- •Introduction
- •What Is Electromagnetic Navigation?
- •SuperDimension Navigation System (EMN-SD)
- •Computerized Tomography
- •Computer Interphase
- •The Edge Catheter: Extended Working Channel (EWC)
- •Procedural Steps
- •Planning
- •Detecting Anatomical Landmarks
- •Pathway Planning
- •Saving the Plan and Exiting
- •Registration
- •Real-Time Navigation
- •SPiN System Veran Medical Technologies (EMN-VM)
- •Procedure
- •Planning
- •Navigation
- •Biopsy
- •Complications
- •Limitations
- •Summary
- •References
- •Introduction
- •Image Acquisition
- •Hardware
- •Practical Considerations
- •Radiation Dose
- •Mobile CT Studies
- •Future Directions
- •Conclusion
- •References
- •26: Robotic Assisted Bronchoscopy
- •Historical Perspective
- •Evidence-Based Review
- •Diagnostic Yield
- •Monarch RAB
- •Ion Endoluminal Robotic System
- •Summary
- •References
- •History and Historical Perspective
- •Indications and Contraindications
- •General
- •Application of the Technique
- •Preoperative Care
- •Patient’s Position and Operative Field
- •Incision and Initial Dissection
- •Palpation
- •Biopsy
- •Control of Haemostasis and Closure
- •Postoperative Care
- •Complications
- •Technical Variants
- •Extended Cervical Mediastinoscopy
- •Mediastinoscopic Biopsy of Scalene Lymph Nodes
- •Inferior Mediastinoscopy
- •Mediastino-Thoracoscopy
- •Video-Assisted Mediastinoscopic Lymphadenectomy
- •Transcervical Extended Mediastinal Lymphadenectomy
- •Evidence-Based Review
- •Summary and Recommendations
- •References
- •Introduction
- •Case 1
- •Adrenal and Hepatic Metastases
- •Brain
- •Bone
- •Case 1 Continued
- •Biomarkers
- •Case 1 Concluded
- •Case 2
- •Chest X-Ray
- •Computerized Tomography
- •Positive Emission Tomography
- •Magnetic Resonance Imaging
- •Endobronchial Ultrasound with Transbronchial Needle Aspiration
- •Transthoracic Needle Aspiration
- •Transbronchial Needle Aspiration
- •Endoscopic Ultrasound with Needle Aspiration
- •Combined EUS-FNA and EBUS-TBNA
- •Case 2 Concluded
- •Case 3
- •Standard Cervical Mediastinoscopy
- •Extended Cervical Mediastinoscopy
- •Anterior Mediastinoscopy
- •Video-Assisted Thoracic Surgery
- •Case 3 Concluded
- •Case 4
- •Summary
- •References
- •29: Pleural Anatomy
- •Pleural Embryonic Development
- •Pleural Histology
- •Cytological Characteristics
- •Mesothelial Cells Functions
- •Pleural Space Defense Mechanism
- •Pleura Macroscopic Anatomy
- •Visceral Pleura (Pleura Visceralis or Pulmonalis)
- •Parietal Pleura (Pleura Parietalis)
- •Costal Parietal Pleura (Costalis)
- •Pleural Cavity (Cavitas Thoracis)
- •Pleural Apex or Superior Pleural Sinus [12–15]
- •Anterior Costal-Phrenic Sinus or Cardio-Phrenic Sinus
- •Posterior Costal-Phrenic Sinus
- •Cost-Diaphragmatic Sinus or Lateral Cost-Phrenic Sinus
- •Fissures18
- •Pleural Vascularization
- •Parietal Pleura Lymphatic Drainage
- •Visceral Pleura Lymphatic Drainage
- •Pleural Innervation
- •References
- •30: Chest Ultrasound
- •Introduction
- •The Technique
- •The Normal Thorax
- •Chest Wall Pathology
- •Pleural Pathology
- •Pleural Thickening
- •Pneumothorax
- •Pulmonary Pathology
- •Extrathoracic Lymph Nodes
- •COVID and Chest Ultrasound
- •Conclusions
- •References
- •Introduction
- •History of Chest Tubes
- •Overview of Chest Tubes
- •Contraindications for Chest Tube Placement
- •Chest Tube Procedural Technique
- •Special Considerations
- •Pneumothorax
- •Empyema
- •Hemothorax
- •Chest Tube Size Considerations
- •Pleural Drainage Systems
- •History of and Introduction to Indwelling Pleural Catheters
- •Indications and Contraindications for IPC Placement
- •Special Considerations
- •Non-expandable Lung
- •Chylothorax
- •Pleurodesis
- •Follow-Up and IPC Removal
- •IPC-Related Complications and Management
- •Competency and Training
- •Summary
- •References
- •32: Empyema Thoracis
- •Historical Perspectives
- •Incidence
- •Epidemiology
- •Pathogenesis
- •Clinical Presentation
- •Radiologic Evaluation
- •Biochemical Analysis
- •Microbiology
- •Non-operative Management
- •Prognostication
- •Surgical Management
- •Survivorship
- •Summary and Recommendations
- •References
- •Evaluation
- •Initial Intervention
- •Pleural Interventions for Recurrent Symptomatic MPE
- •Especial Circumstances
- •References
- •34: Medical Thoracoscopy
- •Introduction
- •Diagnostic Indications for Medical Thoracoscopy
- •Lung Cancer
- •Mesothelioma
- •Other Tumors
- •Tuberculosis
- •Therapeutic Indications
- •Pleurodesis of Pneumothorax
- •Thoracoscopic Drainage
- •Drug Delivery
- •Procedural Safety and Contraindications
- •Equipment
- •Procedure
- •Pre-procedural Preparations and Considerations
- •Procedural Technique [32]
- •Medical Thoracoscopy Versus VATS
- •Conclusion
- •References
- •Historical Perspective
- •Indications and Contraindications
- •Evidence-Based Review
- •Endobronchial Valves
- •Airway Bypass Tracts
- •Coils
- •Other Methods of ELVR
- •Summary and Recommendations
- •References
- •36: Bronchial Thermoplasty
- •Introduction
- •Mechanism of Action
- •Trials
- •Long Term: Ten-Year Study
- •Patient Selection
- •Bronchial Thermoplasty Procedure
- •Equipment
- •Pre-procedure
- •Bronchoscopy
- •Post-procedure
- •Conclusion
- •References
- •Introduction
- •Bronchoalveolar Lavage (BAL)
- •Technical Aspects of BAL Procedure
- •ILD Cell Patterns and Diagnosis from BAL
- •Technical Advises for Conventional TLB and TLB-C in ILD
- •Future Directions
- •References
- •Introduction
- •The Pediatric Airway
- •Advanced Diagnostic Procedures
- •Endobronchial Ultrasound
- •Virtual Navigational Bronchoscopy
- •Cryobiopsy
- •Therapeutic Procedures
- •Dilation Procedures
- •Thermal Techniques
- •Mechanical Debridement
- •Endobronchial Airway Stents
- •Metallic Stents
- •Silastic Stents
- •Novel Stents
- •Endobronchial Valves
- •Bronchial Thermoplasty
- •Discussion
- •References
- •Introduction
- •Etiology
- •Congenital ADF
- •Malignant ADF
- •Cancer Treatment-Related ADF
- •Benign ADF
- •Iatrogenic ADF
- •Diagnosis
- •Treatment Options
- •Endoscopic Techniques
- •Stents
- •Clinical Results
- •Stent Complications
- •Other Available Stents
- •Other Endoscopic Methods
- •References
- •Introduction
- •Anatomy and Physiology of Swallowing
- •Functional Physiology of Swallowing
- •Epidemiology and Risk Factors
- •Types of Foreign Bodies
- •Organic
- •Inorganic
- •Mineral
- •Miscellaneous
- •Clinical Presentation
- •Acute FB
- •Retained FB
- •Radiologic Findings
- •Bronchoscopy
- •Airway Management
- •Rigid Vs. Flexible Bronchoscopy
- •Retrieval Procedure
- •Instruments
- •Grasping Forceps
- •Baskets
- •Balloons
- •Suction Instruments
- •Ablative Therapies
- •Cryotherapy
- •Laser Therapy
- •Electrocautery and APC
- •Surgical Management
- •Complications
- •Bleeding and Hemoptysis
- •Distal Airway Impaction
- •Iron Pill Aspiration
- •Follow-Up and Sequelae
- •Conclusion
- •References
- •Vascular Origin of Hemoptysis
- •History and Historical Perspective
- •Diagnostic Bronchoscopy
- •Therapeutic Bronchoscopy
- •General Measures
- •Therapeutic Bronchoscopy
- •Evidence-Based Review
- •Summary
- •Recommendations
- •References
- •History
- •“The Glottiscope” (1807)
- •“The Esophagoscope” (1895)
- •The Rigid Bronchoscope (1897–)
- •The Flexible Bronchoscope (1968–)
- •Transbronchial Lung Biopsy (1972) (Fig. 42.7)
- •Laser Therapy (1981–)
- •Endobronchial Stents (1990–)
- •Electromagnetic Navigation (2003–)
- •Bronchial Thermoplasty (2006–)
- •Endobronchial Microwave Therapy (2004–)
- •American Association for Bronchology and Interventional Pulmonology (AABIP) and Journal of Bronchology and Interventional Pulmonology (JOBIP) (1992–)
- •References
- •Index

Chest Ultrasound |
30 |
|
|
Rachid Tazi Mezalek and Pere Trias Sabrià |
|
Introduction
In the last decades, technology advances have greatly improved the imaging capacity of chest ultrasound (CUS). Major advantages of chest sonography include the lack of ionization radiation, low cost, exibility, reproducibility, short time examination, and bedside availability for reduced mobilization of patients. CUS is notably helpful for critically ill patients [1] because of its portability, simplicity, and for the follow-up of the diseases [1]. Transthoracic scanning has proved to be a reliable imaging tool for the evaluation of thoracic pathologies. Studies have proven ultrasonography’s superiority to chest radiography [2] and computed tomography (CT) scan [3] for detecting pleural effusion, pneumothorax, lung consolidation, or interstitial syndrome. Furthermore, sonography offers the possibility to
R. Tazi Mezalek (*)
Bronchoscopy Unit and Interventional Pulmonology, Hospital Universitari Germans Trias i Pujol, Barcelona, Spain
Gerència Metropolitana Nord, Institut Català de la Salut, Barcelona, Spain
e-mail: rtazi.germanstrias@gencat.cat
P. Trias Sabrià
Bronchoscopy and Interventional Pulmonology Unit, Department of Respiratory Medicine, Hospital Universitari de Bellvitge, Hospitalet de Llobregat, Barcelona, Spain
e-mail: ptrias@bellvitgehospital.cat
guide needle aspiration or biopsy with an increased success rate and reduced risk of complications [4, 5]. Certainly, ultrasounds did not provide a complete overview of the chest but only a section of it for a specifc problem under investigation. Intrapulmonary processes can be detected by sonography only when they extend up to the chest wall or through a sound-conducting medium such as uid or consolidated lung. Most ultrasound emitted by the transducer are repelled at the interface between the pleura and the lung due to the large difference of acoustic impedance between the soft tissue and the air. Ribs also act as a natural barrier to the ultrasound beam.
The Technique
Thoracic sonography can easily be performed by chest physicians with several modality systems as B mode, M mode, color Doppler, and spectral analysis curve. Brightness mode or B mode imaging is the traditional two-dimensional grayscale cross-sectional imaging mode. Motion mode or M mode ultrasound studies the velocity of a specifc organ or structure relative to the probe position and it is displayed in one dimension. Both B and M modes are often complementary for chest disease characterization. Color Doppler is useful for a qualitative study of parenchymal vascularization and distinction between artifacts from respiratory and cardiac move-
© The Author(s), under exclusive license to Springer Nature Switzerland AG 2023 |
521 |
J. P. Díaz-Jiménez, A. N. Rodríguez (eds.), Interventions in Pulmonary Medicine, https://doi.org/10.1007/978-3-031-22610-6_30

522 |
R. Tazi Mezalek and P. Trias Sabrià |
|
|
ments. Finally, spectral curve analysis studies the arterial ow signal patterns in the specifc area of investigation, very helpful to discern pathologies [6–8].
Physicians who practice with ultrasounds should be familiar with the basic controls, including the freeze, depth, gain functions, and focus...
Freeze function creates still images allowing measurements of the structures and printing images for the clinical report. Depth function is a digital zoom that defnes what portion of the scanned image is displayed on the monitor at a certain magnifcation (close or far from the probe), and it is adjusted in function of operator’s interest with a scale in the vertical axis. Gain function allows an adjustment of the amplifcation of echoes and determines the brightness of the image, very useful for an optimal contrast between adjacent tissues. Focus function should be positioned at the pleural line in order to enhance the quality of the image; but it should be moved deeper when the main target is less superfcial.
The choice of transducer depends largely on the area to study and the depth of the pathology in question. Low-frequency probes (2 to 5 MHz) with a curvilinear shape are suitable for scanning deeper structures, while high-frequency linear shape probes (5–10 MHz) are used for chest wall diseases, diagnosis of pneumothorax, and for a refned assessment. In fact, higher frequency allows a superior resolution close to the probe but at the cost of reduced penetration [6, 9]. Small sector scanners with a reduced footprint may on occasion be useful for visualizing lesions through a small acoustic window, for example in the case of a narrow intercostal space. For daily practice, the best combination is one curved probe of 3.5–5 MHz with a 5–8 MHz small linear probe.
Patient position for scanning is important to obtain the best images possible, and it depends on the location of the diseases under investigation [9, 10]. Chest physicians often use available imagery (chest X-rays or CT scans) to identify the area of interest and determine the patient’s position for an optimal examination [6, 9]. Scanning the posterior chest is better to do it with the patient sitting upright, while the anterior part
of the chest is in the decubitus position. Lateral exploration can be done in both positions depending on each patient and on the extension of the disease. The caudal parts of the lung may be accessed more easily via a subcostal approach, using the liver or spleen as an acoustic window. Parasternal and supraclavicular approaches may be used for the assessment of the mediastinum and lung apices [11, 12, 13]. Raising the arm above the patient’s head increases the rib space distance, and facilitates a wider ultrasound window. It also elevates the scapula for a better posterior chest exploration. Scanning along the intercostal spaces and avoiding the shadow of the ribs make possible a maximum visualization of lung and pleura. A quiet or suspended respiration of the patient can help to exanimate in more detail some structures. The probe should be held by the sonographer as a pen with generous application of gel in contact with the skin. Physicians should be trained to use both hands to scan with and reserve the dominant hand for interventional procedures guided by ultrasounds. Contralateral side should be always being explored and used as a control. Ultrasound exploration is better done in a reduced lighting environment and the operator should be able to describe echogenicity (compared with that of the liver) and to characterize all the fndings in a specifc ultrasound report. Saving images and short clips of exploration in a database are highly recommended.
The Normal Thorax
The different layers of the chest wall are easy to identify with a high-frequency ultrasound probe. The intercostal muscles appear as hypoechoic linear structures containing echogenic fascial layers. On a vertical (or longitudinal) scanning, ribs appear as convex structures with a typical posterior acoustic shadowing and on a horizontal (or oblique) view, the anterior cortex appears as an uninterrupted echogenic line. Both visceral and parietal pleura usually appear as a single highly echogenic line no more than 2 mm wide representing the pleuropulmonary interface [6, 9, 10], but they can be seen as two distinct echo-
Данная книга находится в списке для перевода на русский язык сайта https://meduniver.com/
30 Chest Ultrasound |
523 |
|
|
genic lines on high-resolution scanning. In B mode, sliding of the two layers of pleura during respiration gives rise to the “gliding pleura” or “sliding lung sign.” The amplitude of sliding is greatest at the lung bases and minimal at the lung apices [14], and it is best appreciated on horizontal scanning and its presence has a high negative predictive value for the diagnosis of a pneumothorax [15–17]. Normal lung parenchyma cannot be visualized on transthoracic ultrasonography because the ultrasound beam undergoes complete re ection at the interface between the pleura and the aerated lung. However, this large acoustic difference impedance creates hyperechoic reverberations artifacts, easy to identify, and essential to know for the physician.
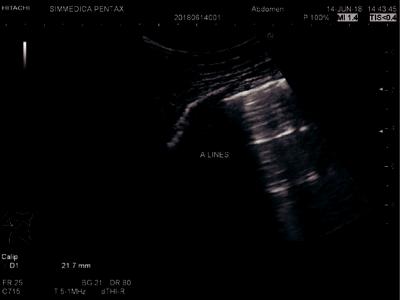
“A lines” are brightly and static echogenic horizontal artifacts which run parallel to the pleural surface (Fig. 30.1). They represent reverberation signals between the pleural surface and the outer surface of the chest wall. They are visualized in a multiplicative distance between the skin surface and the pleural line.
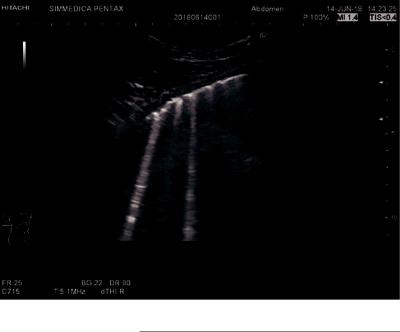
“B lines” are vertical lines that arise from pleural line and spread uninterrupted up to the edge of the screen, also known as “lung rockets” or “comet tail sign,” and can be seen at the lung bases in healthy volunteers representing uid-
flled subpleural interlobular septa (Fig. 30.2). They are usually hyperechoic and multiple in one longitudinal scan. Less than three B lines may be normal in the lower and lateral part of the lung [18, 19]. They are dynamic artifacts and move synchronously with the lung sliding and tend to erase A lines at the point of intersection. In fact, distribution of B lines is helpful in assessing alveolar and interstitial lung diseases [18]. Thickening of the interlobular septa due to interstitial edema results in multiple and regular 7 mm spaced B lines. More closely (3 mm) spaced B lines and con uent to the pleural line are seen in case of alveolar edema, and have been correlated with elevated pulmonary capillary wedge pressure [22]. An absence of B lines is typically seen in the pneumothorax. Thus, the presence of a single B line is enough to rule out the diagnosis of pneumothorax [20, 21]. Occasionally, ultrasound parasites appear as vertical lines which should never be confused with B lines. They are called “Z line” and have no known meaning. They arise from the pleural line but they are ill- defned and fade after a few centimeters. They are not hyperechoic as B lines but gray at their onset with respect to the pleural line and they don’t erase A lines. Finally, they don’t move with lung sliding [23].
Fig. 30.1 A-lines
524 |
R. Tazi Mezalek and P. Trias Sabrià |
|
|
Fig. 30.2 B-lines
“Acoustic shadow” and “tadpole tail sign” are other signs that one should recognize. They are artifacts due to the attenuation of ultrasound beams. Ultrasound waves propagating through a low impedance structure within a higher impedance tissue are less attenuated than others which propagated through the surrounding area. Thus, they are displayed as a brighter signal, known as a “tadpole tail sign.” When the ultrasound beam is almost completely re ected by the high impedance structure (as bone or calculus), the posterior area does not receive ultrasound waves or only at a very low energy level and, fnally, they are displayed as an “acoustic shadow.”
Another basic sign to consider is the “bat sign” obtained in a longitudinal scanning. The bat sign is formed by the superior and inferior ribs and the pleural line between them. The periosteum of the ribs represents the wings and the bright hyperechoic pleural line represents the bats’ body. By rotating the probe until an oblique position, one can visualize a larger part of the pleural line which is not interrupted by the rib shadows. The pleural line appears as a horizontal line.
Chest Wall Pathology
Ultrasound represents often the frst-line radiological investigation for a palpable chest wall lump whatever in ammatory or neoplastic. Masses generally are easy to detect but have variable echogenicity and the sonographic fndings are too nonspecifc to determine precisely the etiology. In addition, CUS detects the tumoral necrosis area to avoid during the puncture for an optimal diagnosis Table 30.1.
Lymph nodes can be detected in the palpation by the examiner and which are the most clinically relevant fnding. In B mode and with a high- frequency probe, sonography helps to differentiate between malignant and benign lymph nodes. The vascularization pattern on color Doppler provides more information about the type of the node. Changes in size, shape, margins, echogenicity in conjunction with clinical information help to make a correct diagnosis. US characteristics of lymph nodes are similar to those established during endobronchial ultrasound (EBUS) examination. But the fnal assessment is made by the histological sample which can be guided by US as well.
Данная книга находится в списке для перевода на русский язык сайта https://meduniver.com/
30 Chest Ultrasound |
525 |
|
|
Table 30.1 Chest ultrasound signs and artifacts |
|
|
|
Signs and artifacts |
Defnition and ultrasound fndings |
1. A lines |
Brightly and static echogenic horizontal artifacts which run parallel to the pleural surface, |
|
and represent a reverberation signal between the pleural surface and the outer surface of |
|
the chest wall. They are visualized in B mode in a multiplicative distance between the skin |
|
surface and the pleural line, and represent physiologic air or free gas |
|
|
2. B lines |
Vertical and equidistant lines that arise from the pleural line and spread uninterrupted up to |
|
the edge of the screen, and can be seen at the lung bases in Normal individuals and |
|
represent uid-flled subpleural interlobular septa. Normal in a number less than three. |
|
Known as lung rockets or comet tails artifacts |
|
|
3. Z lines |
They are ultrasound parasites with no known meaning and which should not be confused |
|
with B lines. Common points with the B-lines are: Vertical comet-tail artifacts and arising |
|
from the pleural line. Five opposed points with B lines could defne Z lines: Not well |
|
defned, fade after a few centimeters, do not erase A lines, are not hyperechoic but gray at |
|
their onset with the pleural line and do not move with lung sliding |
4. A line sign |
Represent a pattern of exclusive A-lines plus a complete absence of B-line. Typical |
|
pneumothorax |
|
|
5. E lines |
Similar to B lines but they arise from the chest wall above the pleural line, and are |
|
generated by subcutaneous emphysema. E lines are aligned vertical lines |
6. W lines |
Similar to E lines but are not aligned. The resulting image of several lines is similar to |
|
letter W |
|
|
7. Gliding sign or |
Sliding of the two layers of pleura during respiration in B mode |
sliding sign |
|
8. Tadpole tail sign |
It is due to an attenuation of the ultrasound beams through a low impedance structure |
|
surrounded by a higher impedance tissue. Less attenuated US are displayed as a brighter |
|
signal coming out from the corresponding structure |
|
|
9. Acoustic shadow |
It is the reverse sign of the tadpole tail sign. US energy is almost attenuated by a high |
|
impedance tissue. The US beams are displayed as a shadow behind the structure |
10. Bat sign |
It is only visible using a longitudinal scan of an intercostal space. It is formed by the |
|
superior and inferior ribs and the pleural line. The periosteum of the ribs represents the |
|
wings and the bright hyperechoic pleural line in between them represents the bats’ body |
11. Seashore sign |
It is the equivalent of lung sliding in the M-mode. The straight motionless aspect |
|
represents the chest wall (“waves”) that lies above the granular layer (“beach”) which is |
|
indicative of the respire-phasic movement of the lung. It is present in normal exploration |
12. Stratosphere sign |
It is the equivalent of absent lung sliding in M-mode (typical in pneumothorax). Monitor |
or bar code sign |
displays a straight and motionless image representing the chest wall only (“waves”). It |
|
suggests a pneumothorax |
|
|
13. Quad sign |
It is a static sign identifed on B mode as a quadrangular image limited laterally by the |
|
acoustic shadows of the ribs, superiorly by the pleural line and inferiorly by lung surface. |
|
Central anechoic image corresponds to a pleural effusion |
14. Sinusoid sign |
It is the dynamic equivalence of quad sign on M mode. It detects the variation of the |
|
interpleural distance in a uid collection. The cyclic motion of the underlying lung |
|
confrms the presence of pleural collection |
15. Fluid color sign |
It is a color signal that appears with a uid collection in the pleural space during |
|
respiration or cardiac cycles on doppler mode |
|
|
16. Swirling pattern |
It is a freeoating echogenic particle due to protein and tissue debris in an echogenic uid |
or plankton sign |
collection (= suggestive of exudate) |
17. Whirlpool sign or |
It corresponds to free echogenic particles due to tissue debris and air bubbles inside a |
snowstorm sign |
highly echogenic collection (=suggestive of empyema) |
|
|
18. Lung apping or |
It represents an oscillating movement of an atelectatic lung (seen as tongue-like) within a |
jellyfsh sign |
large pleural effusion in rhythm with respiration and heart beats like a jellyfsh |
19. Lung point |
It is seen at the point where the lung edge reaches the chest wall in an incomplete lung |
|
collapse or partial pneumothorax |
|
|
20. Double lung point |
It is seen in the separation of visceral and parietal pleura in case of small and localized |
|
pneumothorax |
|
(continued) |
526 |
|
R. Tazi Mezalek and P. Trias Sabrià |
|
|
|
Table 30.1 (continued) |
|
|
|
|
|
Signs and artifacts |
Defnition and ultrasound fndings |
|
21. |
Lung pulse sign |
It is produced by the transmission of cardiac pulse to pleural line, given that the visceral |
|
|
and parietal pleura contact with each other |
22. |
Shred sign |
It represents the deep and irregular border of a pneumonic consolidation |
23. |
C line |
C for centimetric cupuliform consolidation. It represents a pleural based small lung |
|
|
consolidation, and it is seen abutting a hyperechoic dotted and irregular pleural line |
|
|
|
24. Air bronchogram |
It is a hyperechoic punctiform or branched linear artifact within the lung consolidation. It |
|
or bronchoaerogram |
is a specifc sign of lung consolidations |
|
25. |
Dynamic air |
It is defned as inspiratory centrifugal movement of air bronchogram in B mode and |
|
bronchogram |
highlighted on M mode of at least 1 mm, demonstrating a non-retractile consolidation like |
|
|
pneumonia |
|
|
|
26. |
Fluid |
It is an anechoic or hypoechoic branched linear structure with hyperechoic walls on B |
|
bronchogram |
mode and color doppler negative inside, differentiating it from vessels. It is a typical sign |
|
|
of post-obstructive atelectasis |
|
|
|
27. |
Chimney sign or |
It is a repetitive reverberation artifact under a subtle rib fracture |
|
light-house |
|
|
phenomenon |
|
28. |
Hilar fat sign |
Marked echogenic central zone representing fat and connective tissue in the center of the |
|
|
lymph node. It is seen particularly during the healing phase of in ammatory processes |
|
|
|
Rib fractures can be identifed two to six times more frequently by sonography than with chest radiography [24, 25]. They are visualized as a clear disruption of the anterior echogenic margin of the rib with associated step or overlying hematoma. Subtle rib fractures give rise to a reverberation artifact, also known as the “chimney sign” or “light-house phenomenon.” Fracture healing may be demonstrated by the evidence of an echogenic callus with a marked cortical re ex and fne acoustic shadow [26].
Metastatic lesions within the ribs have variety sonography appearances: disruption of the bony cortex, hypoechoic rounded, and well-demarcated space occupying lesions or expansive lesion with rib destruction. Paik et al. (2005) found that sonography helps to distinguish metastasis from traumatic rib lesions in cases of hot-uptake lesions on bone scintigraphy, by demonstrating mass effect and irregular bony destruction [27]. Color Doppler reveals a corkscrew-like neoformation of vessels [28].
Chest extension of lung tumor can be access by ultrasound with a high-frequency scanning probes (7.5–10 MHz) useful for a clear discrimination between chest wall tissue layers. Thoracic US is signifcantly helpful for diagnosing chest wall extent of lung cancer. Direct evidence on US
of infltration of wall structures and rib destruction are reliable criteria [29]. Sugama et al. have defned three US pattern of chest wall invasion: UP1 (Ultrasound Pattern) indicates that the tumor is in contact with the visceral pleura, but on US the visceral pleura line is intact and the movement of the tumor with respiration is unaltered. UP2 indicates that the tumor has extended beyond the visceral pleura and is in contact with the parietal pleura. On US, the visceral pleura line is invaded or interrupted and the movement of the tumor is disturbed. Finally, UP3 means that the tumor has extended to the chest wall through both visceral and parietal pleura. The visceral pleura line is invaded or interrupted and the movement of the tumor is not present on US [30].
Parietal subcutaneous emphysema can be detected as well by US with typical fndings. Characteristic “E lines” are present on the scanning. E lines (E for emphysema) are known as well as “stripe of emphysema.” They are hyperechoic, vertical, and aligned artifacts spreading to the edge of the screen like B lines. The difference is that they arise not from the pleural line but from a hyperechoic line horizontally located just above it. Keep in mind that no bat sign is visible because we are not in a lung ultrasonography but just above in the soft tissue.
Данная книга находится в списке для перевода на русский язык сайта https://meduniver.com/