

exploring-splunk
.pdfExploring Splunk
in an isolated vital sign doesn’t trigger an alert, but 10 vital signs getting within 10% of their upper limits do.
It’s easy to create alerts quickly using the wizard, but still more options for tuning alerts are available using Manager.
Remember that saved searches underlie alerts. As a result, you edit them like you would a saved search. To edit to your alert, choose Manager and then Searches and Reports.
Select a saved search from the list to display its parameters.
Setting Alert Conditions
Thinking of an alert as an If-Then statement, you have more flexibility on the If side by editing through the Manager. The alert can be set to trigger:
•Always
•Depending on the number of events, hosts, sources
•Custom condition
Although the wizard offered to alert on the number of events, here you have options for alerting by the number of hosts or sources. Consider hosts. It’s one thing if you start seeing “server unavailable” status on one web server in a cluster, but it’s quite another thing if you suddenly see it on more and more of your servers. Clearly there’s a spike and the servers are not handling the traffic.
This screen offers more flexibility for defining the threshold for the alert:
•is greater than
•is less than
•is equal to
•not equal to
•rises by
•falls by
The first four options were exposed through the wizard, but here we add the ability to alert if the number rises or falls by a certain number or by a certain percentage (such as 50%). “rises by” and “falls by” allow you to effectively set alerts for conditions that are relative (it’s often not the absolute number as much as a doubling or tripling that you want to be alerted about). “rises by” and “falls by” are not supported on conditions that use real-time searches.
72
Chapter 5: Enriching Your Data
Setting Custom Conditions
Although the UI offers flexibility for configuring the most common kinds of alert conditions, sometimes you need even more flexibility in the form of custom conditions.
A custom condition is a search against the results of the alert’s main search. If it returns any results, the condition is true, and the alert is fired.
For example, you might want to be alerted anytime a host goes down, but exclude hosts that are undergoing scheduled maintenance. To do this, you’d make a main search to return all hosts that go down and a custom condition filters out “false positives”—hosts that are in the calendar for scheduled maintenance. In this way, you are alerted only if a host goes down unexpectedly.
Throttling Alerts
Splunk lets you tune alerts so that they tell you something meaningful. A message that tells you something important is helpful. One hundred messages, on the other hand, whether justified or not, is not helpful. It’s noise.
Splunk lets you throttle alerts so that even if they are triggered, they go off only once in a particular time interval. In other words, if the first alert is like the first kernel of popcorn that pops, you don’t want alerts for all those other kernels, which are really related to that first alert. (If popcorn had a second alert, it should go off just after all functional kernels pop and before any of them burn.)
This is what throttling does. You can tell Splunk to alert you but not to keep alerting you.
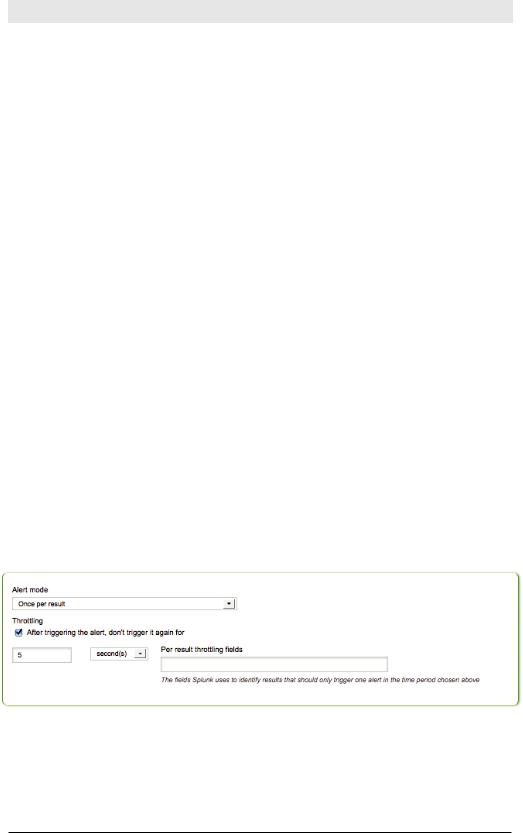
In the middle of the Manager’s screen for editing alerts is an option called Alert mode (see Figure 5-12).
Figure 5-12. Alert Mode
You can be alerted once per search, that is, for all results, or you can be alerted once per result. Per result alerts can be further throttled by fields.
For example, you may want to be alerted whenever the condition is fulfilled, but only once per host. Let’s say that disk space is running low on a
73

Exploring Splunk
server and you want to be alerted when there’s less than 30% free space available. If you specify host in Per result throttling fields, you would only be notified once for each host during the specified time period. If you were dealing with user login failures, you might enter username as the per-result-throttling field.
Customizing Actions for Alerting
By writing or modifying scripts, you can set up custom actions for alerts. For example, you may want an alert to:
•Send an SMS to the people who can help with the problem.
•Create a helpdesk ticket or other type of trouble ticket.
•Restart the server.
All alert actions are based on a script, including sending an email. So is creating an RSS feed. With that in mind, you can see that you can set up alert actions as flexibly as needed using scripting.
To learn more about creating custom alert scripts, see http://splunk.com/goto/ book#custom_alerts
The Alerts Manager
Mission control for alerts is the Alert manager.
Click Alert in the upper right corner of the screen to display the Alert manager.
74
Chapter 5: Enriching Your Data
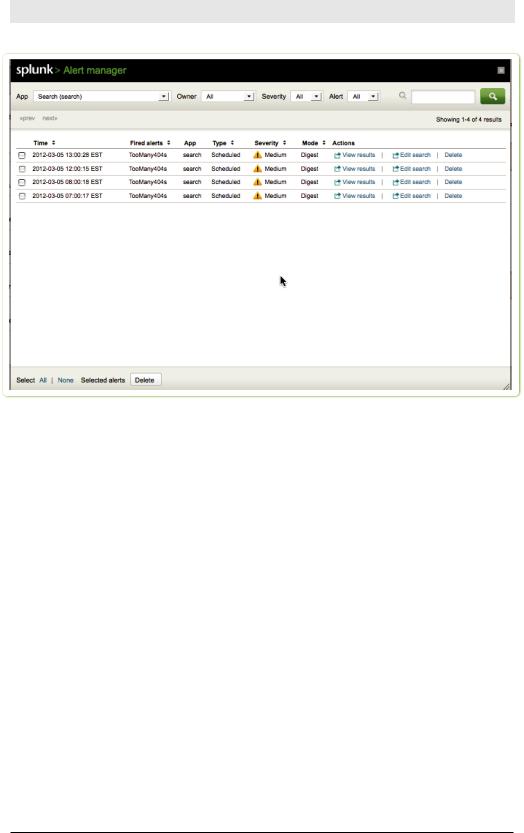
Figure 5-13. Alert manager
A brief clarification of terminology is needed here. We’ll refer to the saved if-then scheduled search as an alert, and an individual firing of that alert as an alert instance.
The Alert manager shows the list of most recent firings of alerts (i.e., alert instances). It shows when the alert instance fired, and provides a link to view the search results from that firing and to delete the firing. It also shows the alert’s name, app, type (scheduled, real-time, or rolling window), severity, and mode (digest or per-result). You can also edit the alert’s definition.
75
PART II RECIPES

6 Recipes for Monitoring and Alerting
The first five chapters of this book prepared you for using Splunk to solve problems, answer questions, and explore your data in new and interesting ways.
In this chapter, we’ll present monitoring and alerting recipes. Monitoring refers to reports you can visually monitor and alerting refers to conditions monitored by Splunk, which can automatically trigger actions.
These recipes are meant to be brief solutions to common monitoring and alerting problems. Each recipe includes a problem statement followed by a description of how to use Splunk to solve the problem. Some of the more complex examples suggest variations on the recipe for you to explore.
To ask questions and find more answers like these, visit http://splunkbase. com.
Monitoring Recipes
Monitoring can help you see what is happening in your data. How many concurrent users are there? How are key metrics changing over time?
In addition to recipes that monitor various conditions, this section provides recipes that describe how to use search commands to extract fields from semi-structured and structured data.
Monitoring Concurrent Users
Problem
You need to determine how many concurrent users you have at any particular time. This can help you gauge whether some hosts are overloaded and enable you to better provision resources to meet peak demand.
79

Exploring Splunk
Solution
First, perform a search to retrieve relevant events. Next, use the concurrency command to find the number of users that overlap. Finally, use the timechart reporting command to display a chart of the number of concurrent users over time.
Let’s say you have the following events, which specify date, time, request duration, and username:
5/10/10 1:00:01 ReqTime=3 User=jsmith
5/10/10 1:00:01 ReqTime=2 User=rtyler
5/10/10 1:00:01 ReqTime=50 User=hjones
5/10/10 1:00:11 ReqTime=2 User=rwilliams 5/10/10 1:00:12 ReqTime=3 User=apond
You can see that, at 1:00:01, there are three concurrent requests (jsmith, rtyler, hjones); at 1:00:11, there are two (hjones, rwilliams); and at 1:00:12, there are three (hjones, rwilliams, apond).
Use this search to show the maximum concurrent users for any particular time:
<your search here> sourcetype=login_data | concurrency duration=ReqTime
| timechart max(concurrency)
To learn more about the concurrency command, see http://splunk.com/goto/ book#concurrency
Monitoring Inactive Hosts
Problem
You need to determine which hosts have stopped sending data. A host might stop logging events if the server, or application producing logs, has crashed or been shut down. This often indicates a serious problem. If a host stops logging events, you’ll want to know about it.
Solution
Use the metadata command, which reports high-level information about hosts, sources, and source types in the Splunk indexes. This is what is used to create the Summary Dashboard. Note the pipe character is at the beginning of this search, because we’re not retrieving events from a Splunk index, rather we’re calling a data-generating command (metadata).
80

Chapter 6: Recipes for Monitoring and Alerting
Use the following search to take the information on hosts, sort it so the least recently referenced hosts are first, and display the time in a readable time format:
| metadata type=hosts | sort recentTime
| convert ctime(recentTime) as Latest_Time
You’ll quickly see which hosts haven’t logged data lately.
To learn more about the metadata command, see http://splunk.com/goto/ book#metadata
Reporting on Categorized Data
Problem
You need to report on segments of your data that aren’t neatly defined.
Solution
To search for specific parts of your data, classify your events using tags and event types. Tags are simpler but event types are more powerful (tags and event types are discussed in Chapter 5).
You might wonder how this categorization of data comes under monitoring.
That’s because when you categorize data using tags and event types, you not only categorize the data you have today, but you teach Splunk to categorize data like that every time it shows up.You are teaching Splunk to be on the lookout for data that has certain characteristics. Think of tags and event types like putting out an all points bulletin (APB) for your data.
Using Tags
You can classify simple field=value pairs using tags. For example, classify events that have host=db09 as a database host by tagging that field value.
This creates a tag::host field having a value of database, on events with host=db09. You can then use this custom classification to generate reports.
Here are a couple of examples that use tags.
Show the top ten host types (good for bar or pie charts):
... | top 10 tag::host
Compare how the various host types perform over time:
81

Exploring Splunk
... | timechart avg(delay) by tag::host
Using Event Types
When you use event types, instead of tags, to classify events, you are not limited to a simple field=value. You can use the full power of the search command, including Boolean operations, phrase matching, and wildcards. You could make an event type called database_host with a definition of “host=db* OR host=orcl*”, and another event type called web_ host. Repeat the same searches as you did for tags, but replace tag::host with eventtype. For example, to show the top ten event types:
... | top 10 eventtype
Because event types are not specific to a dimension, such as hosts, user type, or error codes, they are all in a common namespace, jumbled together. A search for top eventtypes might return database_host and web_error, which is probably not what you want because you’d be comparing apples to oranges. Fortunately you can filter which event types you report on, using the eval command, if you use a common naming convention for your event types.
As an example, using event types, compare how the various host types perform (displayed as a timechart), using only event types that end in
_host:
…| eval host_types = mvfilter(match(eventtype, “_host$”)) | timechart avg(delay) by host_types
Comparing Today’s Top Values to Last Month’s
Problem
You need to know the top N values today and how they compare to last month’s values. This can answer questions like, which products, or database errors, are suddenly becoming more popular than they used to be?
Solution
For this solution, we’ll use the example of music data to show the top 10 most played artists today and their average position for the month. Assume the events have an artist field and a sales field that tells how many units were sold at a particular time. We’ll use the sum of sales as our metric—sum(sales)—but we could use any other metric.
The full search looks daunting at first, but you can break it down into simple steps:
1.Get the monthly rankings by artist.
2.Get the daily rankings by artist and append them to the results.
82

Chapter 6: Recipes for Monitoring and Alerting
3.Use stats to join the monthly and daily rankings by artist.
4.Use sort and eval to format the results.
Get the monthly rankings
Use this search to find the 10 biggest monthly sales by artist: sourcetype=music_sales earliest=-30d@d
| stats sum(sales) as month_sales by artist | sort 10 - month_sales
| streamstats count as MonthRank
The earliest=-30d@d tells Splunk to retrieve events starting at 30 days ago (in other words, get events from the last month). stats calculates the sums of sales for each artist as the month_sales field.You now have a row for each artist, with two columns: month_sales and artist. sort 10
– month_sales keeps only those rows with the ten largest month_sales values, in sorted order from largest to smallest. The streamstats command adds one or more statistics to each event, based on the current value of the aggregate at the time the event is seen (not on the results as a whole, like the stats command does). Effectively, streamstats count as MonthRank assigns the first result MonthRank=1, the second result MonthRank=2, and so on.
Get yesterday’s rankings
Make three small changes to the monthly-rankings search to get yesterday’s rank:
•Change the value for earliest from -30d@d to -1d@d to get the rankings from yesterday.
•Change every instance of “month” in the search to “day”.
•Wrap the search in an append command so that the results are appended to the results from the first search.
append [
search sourcetype=music_sales earliest=-1d@d | stats sum(sales) as day_sales by artist
| sort 10 - day_sales
| streamstats count as DayRank
]
Use stats to join the monthly and daily ranks by artist
Use the stats command to join the results by artist, putting the first monthly and daily rankings into one result.
stats first(MonthRank) as MonthRank first(DayRank) as DayRank by artist
83