

exploring-splunk
.pdf3 Searching with Splunk
Now that you’ve gained an understanding of the way Splunk indexes data (in Chapter 2), it will be easier to understand what is happening when you search with Splunk.
Of course, the goal of search is to help you find exactly what you need. It can mean filtering, summarizing, and visualizing a large amount of data, to answer your questions about the data. At other times, you might need to regularly explore large amounts of data. Often, you simply want to find the needle in the haystack, the one buried event that threw everything off.
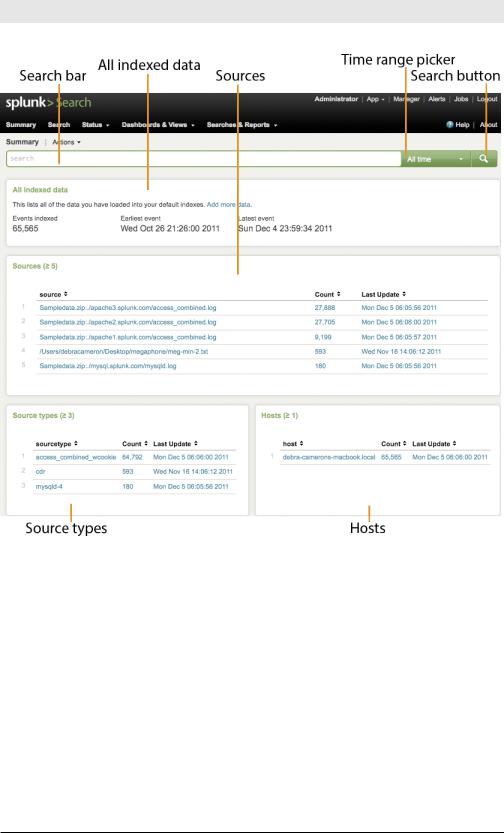
The Summary dashboard gives you a quick overview of the data visible to you. Click Launch search app on the Splunk Welcome tab. If you’re on the Splunk Home tab, click Search under Your Apps. The Summary dashboard displays, as shown in Figure 3-1
21
Exploring Splunk
Figure 3-1. The Search app’s Summary dashboard
Notice a few things about this dashboard:
•The search bar at the top is empty, ready for you to type in a search.
•The time range picker to the right of the search bar permits time range adjustment. You can see events from the last 15 minutes, for example, or any desired time interval. For real-time streaming data, you can select an interval to view, ranging from 30 seconds to an hour.
•The All indexed data panel displays a running total of the indexed data.
22

Chapter 3: Searching With Splunk
The next three panels show the most recent or common values that have been indexed in each category:
•The Sources panel shows which files (or other sources) your data came from.
•The Source types panel shows the types of sources in your data.
•The Hosts panel shows which hosts your data came from.
Now, let’s look at the Search navigation menus near the top of the page:
Figure 3-2. Search navigation menus
•Summary is where we are.
•Search leads to the main search interface, the Search dashboard.
•Status lists dashboards on the status of your Splunk instance.
•Dashboards &Views lists your dashboards and views.
•Searches & Reports lists your saved searches and reports.
The next section introduces you to the Search dashboard.
The Search Dashboard
If you click the Search option or enter a search in the search bar, the page switches to the Search dashboard (sometimes called the timeline or flashtimeline view). When a search is kicked off, the results almost immediately start displaying. For example, entering an asterisk (*) in the search bar retrieves all the data in your default indexes, and a screen similar to Figure 3-3 appears.
23

Exploring Splunk
Timeline
Fields |
Raw text |
|
|
menu |
Results area |
Field discovery switch |
|
Figure 3-3. The Search dashboard
Let’s examine the contents of this dashboard:
•Timeline: A graphic representation of the number of events matching your search over time.
•Fields sidebar: Relevant fields along with event counts. This menu also allows you to add a field to the results.
•Field discovery switch: Turns automatic field discovery on or off. When Splunk executes a search and field discovery is on, Splunk attempts to identify fields automatically for the current search.
24
Chapter 3: Searching With Splunk
•Results area: Shows the events from your search. Events are ordered by Timestamp, which appears to the left of each event. Beneath the
Raw text of each event are any fields selected from the Fields sidebar for which the event has a value.
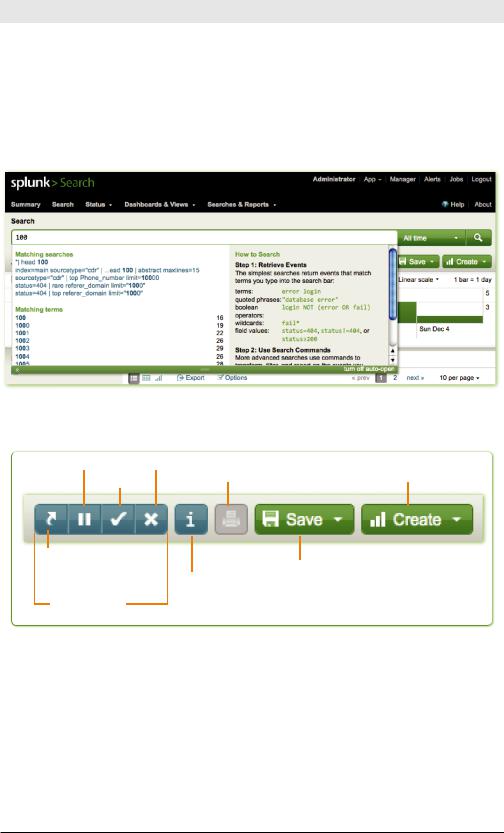
When you start typing in the search bar, context-sensitive information appears below, with matching searches on the left and help on the right:
Figure 3-4. Helpful info appears when you enter text in the search bar
Under the time range picker, you see a row of icons:
Pause |
Cancel |
Print results |
Create menu |
||
Finalize |
|||||
|
|
|
|||
end to |
|
|
Save search |
|
|
background |
|
Job inspector |
|
||
|
|
|
|
||
Search job controls
Figure 3-5. Search icons
The search job controls are only active when a search is running. If you haven’t run a search, or if your search has finished, they are inactive and greyed out. But if you’re running a search that takes a long time to complete, you can use these icons to control the search progress:
•Sending a search to the background lets it keep running to completion on the server while you run other searches or even close the window and log out. When you click Send to background, the search bar clears and you can continue with other tasks. When
25

Exploring Splunk
the job is done, a notification appears on your screen if you’re still logged in; otherwise, Splunk emails you (if you’ve specified an email address). If you want to check on the job in the meantime, or at a later time, click the Jobs link at the top of the page.
•Pausing a search temporarily stops it and lets you explore the results to that point. While the search is paused, the icon changes to a play button. Clicking that button resumes the search from the point where you paused it.
•Finalizing a search stops it before it completes, but retains the results to that point and so you can view and explore it in the search view.
•In contrast, canceling a search stops it running, discards the results, and clears them from the screen.
The Job inspector icon takes you to the Job inspector page, which shows details about your search, such as the execution costs of your search, debug messages, and search job properties.
Use the Save menu to save the search, save the results, or save and share the results. If you save the search, you can find it on the Searches & Reports menu. If you save the results, you can review them by clicking on Jobs in the upper right corner of the screen.
Use the Create menu to create dashboards, alerts, reports, event types, and scheduled searches. We’ll explain those in detail in Chapter 5.
Moving down to the upper left corner of the Results area, you see the following row of icons.
Options for displaying events
List Table Chart Export search results
Figure 3-6. Results area icons
By default, Splunk shows events as a list, from most recent events to least, but you can click on the Table icon to view your results as a table, or you can click the Chart icon to view them as a chart. The Export button exports your search results in various formats: CSV, raw events, XML, or JSON.
26
Chapter 3: Searching With Splunk
Events? Results? What’s the Difference?
Technically speaking, retrieved events from your indexes are called “events.” If those events are transformed or summarized so that there is no longer a one-to- one mapping with events on disk, they are properly called “results.” For example, a web-access event retrieved from a search is an event, but the top URL visited today is a result. That said, we are not going to be that picky, and will use the two terms interchangeably.
SPL™: Search Processing Language
Splunk helps sift data from the mass of indexed events into a form that is useful for answering real-world questions.
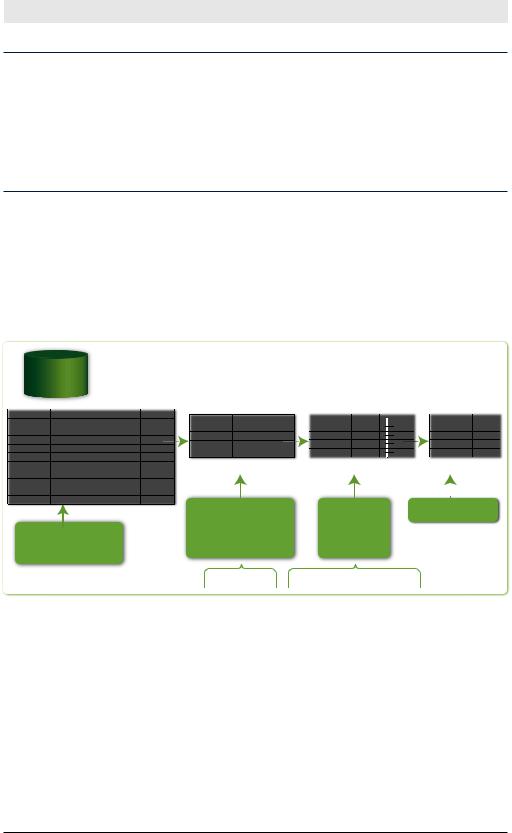
Figure 3-7 illustrates a common search pattern: retrieve events and generate a report. This search returns the top users in syslog errors.
Disk |
sourcetype = syslog ERROR | top user | fields - percent |
||||||||||||||||||
|
|
|
|
|
|
|
|
|
|
|
|
|
|
|
|
|
|
|
|
sourcetype |
raw |
|
IP address |
< elds...> |
|
|
|
|
|
|
|
|
|
|
|
|
|
|
|
|
|
|
User |
count |
percent |
|
|
User |
count |
percent |
|
|
User |
count |
|||||
syslog |
… |
|
… |
… |
|
|
|
|
|
|
|||||||||
syslog |
… ERROR … |
|
user_A |
… |
|
|
user_01 |
22 |
22 |
|
|
user_01 |
22 |
22 |
|
|
user_01 |
22 |
|
|
|
|
user_02 |
17 |
17 |
|
|
user_02 |
17 |
17 |
|
|
user_02 |
17 |
|||||
other-source |
… |
|
… |
… |
|
|
|
|
|
|
|||||||||
|
|
|
... |
… |
… |
|
|
... |
… |
… |
|
|
... |
|
… |
||||
syslog |
… ERROR … |
|
user_A |
… |
|
|
|
|
|||||||||||
|
|
|
user-10 |
5 |
5 |
|
|
user-10 |
5 |
5 |
|
|
user-10 |
5 |
|||||
syslog |
… WARNING … |
|
user_A |
… |
|
|
|
|
|
|
|||||||||
|
|
|
|
|
|
|
|
|
|
|
|
|
|
|
|
||||
syslog |
… WARNING … |
|
|
… |
|
|
|
|
|
|
|
|
|
|
|
|
|
|
|
|
user_A |
|
|
|
|
|
|
|
|
|
|
|
|
|
|
|
|||
other-source |
… |
|
… |
… |
|
|
|
|
|
|
|
|
|
|
|
|
|
|
|
|
|
|
|
|
|
|
|
|
|
|
|
|
|
|
|
||||
syslog |
… ERROR … |
|
user_B |
… |
|
|
|
|
|
|
|
|
|
|
|
|
|
|
|
|
|
|
|
|
|
|
|
|
|
|
|
|
|
|
|||||
other-source |
… |
|
… |
… |
|
|
|
|
|
|
|
|
|
|
|
|
|
|
|
<events…> |
… |
|
… |
… |
|
|
Summarize into |
|
|
Remove |
|
Final results |
|||||||
|
|
|
|
|
|
|
|
|
|
||||||||||
Events fetched |
|
|
|
table of top |
|
|
|
“percent” |
|
|
|
|
|
|
|||||
|
|
|
ten users |
|
|
|
column |
|
|
|
|
|
|
||||||
from disk |
|
|
|
|
|
|
|
|
|
|
|
|
|
|
|||||
|
|
|
|
|
|
|
|
|
|
|
|
|
|
|
|
|
|
||
|
|
|
|
|
|
|
top user |
fields - percent |
|
|
|
|
|
||||||
Figure 3-7. How a simple Splunk search is processed
The entire string
sourcetype=syslog ERROR | top user | fields - percent
is called a search, and the pipe character (|) separates the individual commands that make up the search.
Pipes
The first keyword after the pipe is the name of the search command. In this case the commands are top and fields. What command is retrieving the events from the index? Well, there is an implied command called
27

Exploring Splunk
search, at the beginning of any search that doesn’t start with a pipe character. So, really, there are three search commands in the above search: search, top, and fields.
The results from each command are passed as input to the next command. If you have ever used a Linux shell such as bash, this concept is probably familiar.
Implied AND
sourcetype=syslog ERROR tells the search command to retrieve only events that have a sourcetype equal to syslog AND contain the term
ERROR.
top user
The next command, top, returns the most common values of the specified fields. By default, top returns the top 10 most common values for the specified field, in descending order (thank you, David Letterman). In this case, the specified field is user, so top returns the users that appear most often in syslog events that contain the term ERROR. The output of top is a table of 3 columns (user, count, and percent), with 10 rows of values.
It’s also important to understand that the output of the top command becomes the input to the next command after the pipe. In this sense, top has transformed the search results to a smaller set of values, which are further refined by the next command.
fields – percent
The second command, fields, with an argument of – percent, tells Splunk to remove the percent column from the output of the top command.
Exploratory Data Analysis: Spelunking with Splunk
What if you don’t know anything about the data? Get creative and explore. You can do a search for “*” to retrieve all events and then learn about them: look at some events, extract some interesting looking fields, get a top of that field, see how the events are broken up, perhaps derive some new fields based on other fields, cluster your results, see how one field varies with another field, and so on. (For more tips about learning what’s in a source that you have little knowledge about, refer to http://splunk.com/goto/book#mining_tips.)
28

Chapter 3: Searching With Splunk
Before we dive into the search commands in Chapter 4, let’s cover the search command itself: a very special command that is critical for using Splunk.
The search Command
The search command is the workhorse of Splunk. It’s one of the simplest and most powerful commands. It’s such a basic command that you don’t even need to type it anywhere before the first pipe, because it is invoked implicitly at the head of a search, retrieving events from the indexes on disk.
Not all searches retrieve data from Splunk indexes. For example, the inputcsv command reads data from a CSV file. To enter commands of this sort as the first command, precede them with the pipe character. For example:
myfile.csv
When it’s not the first command in a search, the search command can filter a set of results of the previous search. To do this, use the search command like any other command—with a pipe character followed by an explicit command name. For example, the command error | top url | search count>=2 searches for events on disk that have the word error, finds the top URLs, and filters any URLs that only occur once. In other words, of the 10 error events that top returns, show me only the ones where there are two or more instances of that URL.
Table 3-1 shows a few examples of implicit calls to the search command and their results.
Table 3-1. Implicit search commands
Search Arguments |
Result |
(warn OR error) NOT fail* |
Retrieves all events containing either |
|
“warn” or “error”, but not those that |
|
have “fail”, “fails”, “failed”, failure”, |
|
etc. |
|
|
“database error” fatal disk |
Retrieves all events containing the |
|
phrase “database error”, “fatal”, and |
|
“disk” (the AND is implied). |
|
|
host=main_web_server delay>2 |
Retrieves all events that have a host |
|
field with a value of main_web_serv- |
|
er and a delay field with a value |
|
greater than 2. |
|
|
29

Exploring Splunk
Tips for Using the search Command
Here are a few tips for using the search command. They apply to many other commands as well.
Case-sensitivity
Keyword arguments to the search command are not case-sensitive, but field names are. (See Appendix B for more details about case-sensitivity.)
Using quotation marks in a search
You need quotation marks around phrases or field values that contain breaking characters such as whitespace, commas, pipes, square brackets, and equals signs. So, host=web09 is fine, but if the host value has spaces, for example, you’ll need quotes around the value, as in host=”webserver #9”. In addition, to search for reserved keywords (e.g., AND, OR, NOT, etc.), use quotes.
To search for quotes use a backslash to escape the quote character. To find the phrase—Splunk changed “life itself” for me—you’d search for:
“Splunk changed \”life itself\” for me”
Boolean logic
Arguments—keywords and fields—to the search command are ANDed together, implicitly.
You can specify that either one of two or more arguments should be true using the OR keyword, in uppercase. OR has higher precedence than AND, so you can think of arguments using OR as having parentheses around them.
To filter out events that contain a particular word, use the NOT keyword.
Finally, you can use parentheses explicitly to make things more clear if you want to. For example, a search for x y OR z NOT w is the same as x
AND (y OR z) AND NOT w.
Subsearches
The search command, like all commands, can be used as a subsearch—a search whose results are used as an argument to another search command. Subsearches are enclosed in square brackets. For example, to find all syslog events from the user that had the last login error, use the following command:
sourcetype=syslog [search login error | return user]
30