

exploring-splunk
.pdfExploring Splunk
Splunk has been at the forefront of raising awareness about operational intelligence, a new category of methods and technology for using machine data to gain visibility into the business and discover insights for IT and the entire enterprise. Operational intelligence is not an outgrowth of business intelligence (BI), but a new approach based on sources of information not typically within the purview of BI solutions. Operational data is not only incredibly valuable for improving IT operations, but also for yielding insights into other parts of the business.
Operational intelligence enables organizations to:
•Use machine data to gain a deeper understanding of their customers: For example, if you just track transactions on a website, you see what people bought. But by looking closely at the web server logs you can see all the pages they looked at before they purchased, and, perhaps even more important for the bottom line, you can see the pages that the people who didn’t buy looked at. (Remember our new product search example from the intro?)
•Reveal important patterns and analytics derived from correlating events from many sources: When you can track indicators of consumer behavior from websites, call detail records, social media, and in-store retail transactions, a far more complete picture of the customer emerges. As more and more customer interactions show up in machine data, more can be learned.
•Reduce the time between an important event and its detection:
Machine data can be monitored and correlated in real time.
•Leverage live feeds and historical data to make sense of what is happening now, to find trends and anomalies, and to make more informed decisions based on that information: For example, the traffic created by a web promotion can be measured in real time and compared with previous promotions.
•Deploy a solution quickly and deliver the flexibility needed by organizations today and in the future—that is, the ability to provide ad hoc reports, answer questions, and add new data sources:
Splunk data can be presented in traditional dashboards that allow users to explore the events and keep asking new questions.
10

Chapter 1: The Story of Splunk
Operational Intelligence at Work
Splunk does something that no other product can: efficiently capture and analyze massive amounts of unstructured, time-series textual machine data. Although IT departments generally start out using Splunk to solve technically esoteric problems, they quickly gain insights valuable elsewhere in their business.
Using machine data in Splunk helps solve vexing business problems. Here are a few examples:
•An operations team implemented a cloud-delivered customer-facing application and used Splunk for diagnostics. They soon realized they could track user statistics and better plan capacity—a metric with profound business implications.
•Web server traffic logs can be used to track shopping carts being filled and abandoned in real time. The marketing department can use this information to determine where consumers are getting stuck and what types of purchases are being abandoned so that any problems can be fixed right away and promotions can target items that are abandoned.
•Organizations using Splunk to monitor applications for troubleshooting have realized that they can easily provide views to their first-line support team to handle customer calls directly, versus escalating those calls to expensive engineering resources.
•A major utility company was able to eliminate costly software maintenance fees by replacing six other monitoring and diagnostic tools with Splunk, while enhancing their NERC and SOX compliance efforts.
•A major public media organization reduced the time it took to capture critical web analytics from months to hours. They were also able to track their digital assets with a granularity and accuracy that they couldn’t have otherwise, resulting in better royalty accounting and content marketing.
•A taco fast-food restaurant connected its points of sale (POS) to Splunk, and within an hour, business analysts were able to begin answering questions like, “How many people are buying tacos in the midnight-to-2 AM period, in this geography, during this time of the year?”
11

Exploring Splunk
Ultimately, operational intelligence enables organizations to ask the right questions, leading to answers that deliver business insights, using combinations of real-time and historical data, displayed in easily digestible dashboards and graphical tools.
There’s a reason for the trend toward calling machine data “big data.” It’s big, it’s messy, and in there, buried somewhere, is the key to the future of your business. Now let’s move on to Chapter 2, where you’ll learn how to get data into Splunk and start finding the gold hidden in your data.
12

2 Getting Data In
Chapter 1 provided an introduction to Splunk and described how it can help you. Now let’s take the next step in your journey: getting your data into Splunk.
This chapter covers installing Splunk, importing your data, and a bit about how the data is organized to facilitate searching.
Machine Data Basics
Splunk’s mission is to make machine data useful for people. To give you some context, it’s worth reviewing a few basics about machine data and how Splunk keeps track of it.
People who create systems (such as web servers or load balancers or video games or social media platforms) also specify the information those systems write to log files when they are running. This information (the machine data in the log files) is what people using the systems can use to understand what those systems are doing as they run (or fail to run). For example, the log file output for a hypothetical clock application might look like this:
Action: ticked s:57, m:05, h:10, d:23, mo:03, y:2011 Action: ticked s:58, m:05, h:10, d:23, mo:03, y:2011 Action: ticked s:59, m:05, h:10, d:23, mo:03, y:2011 Action: ticked s:00, m:06, h:10, d:23, mo:03, y:2011
Every time the clock ticks, it logs the action and the time that the action occurred. If you were really going to keep track of the clock, in addition to the fact that it ticked, the log might also include other useful information: the battery level, when an alarm was set, turned on or off, or sounded—anything that could give you insight into how the clock was working. Each line of the machine data shown above can be considered a separate event, although it’s common for other machine data to have events that span multiple or even hundreds of lines.
Splunk divides raw machine data into discrete pieces of information known as events. When you do a simple search, Splunk retrieves the events that match your search terms. Each event consists of discrete piec-
13

Exploring Splunk
es of data known as fields. In clock data, the fields might include second, minute, hour, day, month, and year. If you think of groups of events organized in a spreadsheet or database, the events are the rows and the fields are the columns, as shown in Figure 2-1.
Second |
Minute |
Hour |
Day |
Month |
Year |
58 |
1 |
14 |
23 |
11 |
2011 |
59 |
1 |
14 |
23 |
11 |
2011 |
60 |
1 |
14 |
23 |
11 |
2011 |
1 |
2 |
14 |
23 |
11 |
2011 |
2 |
2 |
14 |
23 |
11 |
2011 |
3 |
2 |
14 |
23 |
11 |
2011 |
Figure 2-1. Clock Events in a Spreadsheet Form
In practice, another way to think of events is as a set of fields of keyword/ value pairs. If represented as keyword/value pairs, the clock events look like Figure 2-2.
Second=58, Minute=01, Hour=14, Day=23, Year=2011
Second=59, Minute=01, Hour=14, Day=23, Year=2011
Second=60, Minute=01, Hour=14, Day=23, Year=2011
Second=01, Minute=02, Hour=14, Day=23, Year=2011
Second=02, Minute=02, Hour=14, Day=23, Year=2011
Figure 2-2. Clock Events as Fields of Keyword/Value Pairs
Here’s a real-world example of one of the most common and useful types of machine data. A web server has a log file that records every URL requested from the server.
Some of the fields in web server data are:
client IP, timestamp, http method, status, bytes, referrer, user agent
A visit to one webpage can invoke dozens of requests to retrieve text, images, and other resources. Each request is typically logged as a separate event in a log file. The result is a file that looks something like Figure 2-3 (without the fancy highlighting to help you see the fields).
Http Command |
Status |
"GET /pages/hltabs_c.html HTTP/1.1" 200
"GET /pages/joy.html HTTP/1.1" 200
"GET /pages/dochomepage.html HTTP/1.1" 200
Figure 2-3. Typical Web Server Log
14

Chapter 2: Getting Data In
Types of Data Splunk Can Read
One of the common characteristics of machine data is that it almost always contains some indication of when the data was created or when an event described by the data occurred. Given this characteristic, Splunk’s indexes are optimized to retrieve events in time-series order. If the raw data does not have an explicit timestamp, Splunk assigns the time at which the event was indexed by Splunk to the events in the data or uses other approximations, such as the time the file was last modified or the timestamp of previous events.
The only other requirement is that the machine data be textual, not binary, data. Image and sound files are common examples of binary data files. Some types of binary files, like the core dump produced when a program crashes, can be converted to textual information, such as a stack trace. Splunk can call your scripts to do that conversion before indexing the data. Ultimately, though, Splunk data must have a textual representation to be indexed and searched.
Splunk Data Sources
During indexing, Splunk can read machine data from any number of sources. The most common input sources are:
•files: Splunk can monitor specific files or directories. If data is added to a file or a new file is added to a monitored directory, Splunk reads that data.
•the network: Splunk can listen on TCP or UDP ports, reading any data sent.
•scripted inputs: Splunk can read the machine data output by programs or scripts, such as a Unix® command or a custom script that monitors sensors.
Enough background: now let’s get started working with Splunk.
Downloading, Installing, and Starting Splunk
We recommend that you install Splunk and add some machine data to help you work through the topics discussed in this book. Everything we’ll cover can be done using Splunk Free (see below).
This section describes how to get Splunk up and running.
15

Exploring Splunk
Downloading Splunk
You can download fully functional Splunk for free, for learning or to support small to moderate use of Splunk. On the splunk.com home page, you see this button:
Click it to begin downloading and installing Splunk on computers running Windows®, Mac™, Linux®, and Unix.
Installing Splunk
Installing Splunk is easy, so we’ll assume you’ll do that part on your own. If you have any questions, refer to the Splunk Tutorial (http://splunk.com/ goto/book#tutorial), which covers everything in detail.
Starting Splunk
To start Splunk on Windows, launch the application from the Start menu. Look for the Welcome screen, shown in Figure 2-4, and keep reading.
To start Splunk on Mac OS X or Unix, open a terminal window. Go to the directory where you installed Splunk, go to the bin subdirectory and, at the command prompt, type:
./splunk start
The very last line of the information you see when Splunk starts is:
The Splunk web interface is at http://your-machine- name:8000
Follow that link to the login screen. If you don’t have a username and password, the default credentials are admin and changeme. After you log in, the Welcome screen appears.
16

Chapter 2: Getting Data In
Figure 2-4. The Welcome Screen
The Welcome screen shows what you can do with your pristine instance of Splunk: add data or launch the search app.
Bringing Data in for Indexing
The next step in learning and exploring Splunk is to add some data to the index so you can explore it.
We’re going to use some sample data for the purposes of this chapter.
You can find instructions for getting this data here: http://splunk.com/goto/ book#add_data
There are two steps to the indexing process:
•Downloading the sample file from the Splunk website
•Telling Splunk to index that file
To download the sample file, follow this link and save the file to your desktop: http://splunk.com/goto/book#sample_data
To add the file to Splunk:
1.From the Welcome screen, click Add Data.
2.Click From files and directories on the bottom half of the screen.
3.Select Skip preview.
4.Click the radio button next to Upload and index a file.
5.Select the file you downloaded to your desktop.
6.Click Save.
17
Exploring Splunk
You’re finished adding your data. Let’s talk about what Splunk is doing behind the scenes.
Understanding How Splunk Indexes Data
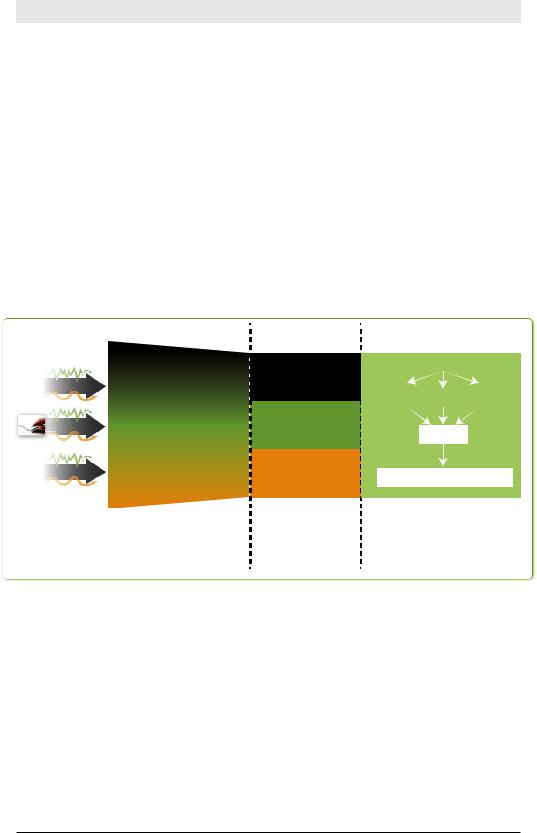
Splunk’s core value to most organizations is its unique ability to index machine data so that it can be quickly searched for analysis, reporting, and alerts. The data that you start with is called raw data. Splunk indexes raw data by creating a time-based map of the words in the data without modifying the data itself.
Before Splunk can search massive amounts of data, it must index the data. The Splunk index is similar to indexes in the back of textbooks, which point to pages with specific keywords. In Splunk, the “pages” are called events.
Indexing Pipeline |
Indexes |
Social12.1.1.140 - - [01/Aug /2009:09::37:01 -0700]
Media"GET /home/themes/ComB eta/images/btn_login.g
if HTTP/1.1" 304 - "ht Datap:///webdev:2000/home/i
ex.php" "Mozillla/5.0
12.1.1.140 - - [01/Aug /2009:09::37:01 -0700] "GET /home/themes/ComB eta/images/btn_login.g if HTTP/1.1" 304 - "ht p://webdev:2000/home/i ex.php" "Mozillla/5.0
Credit12.1.1.140 - - [01/Aug /2009:09::37:01 -0700]
"GET /home/themes/ComB Card eta/images/btn_login.g
if HTTP/1.1" 304 - "ht Data p:///webdev:2000/home/i
ex.php" "Mozillla/5.0
|
INDEX A |
EVENT: raw text |
|
+ fields such |
|
as source, |
INDEX B |
sourcetype, |
|
host, and _time |
|
|
INDEX C |
The indexing pipeline reads |
Machine data is |
copied to the index |
|
the machine data, divides it |
where it is available |
into events, and identi es |
during the search |
some default elds |
process |
Search Head
splunk search command
Index |
|
Index |
|
Index |
A |
|
B |
|
C |
Merge
Results
Search
Results
12.1.1.140 - - [01/Aug/2009:09 :37:01 -0700] "GET /home/theme s/ComBeta/images/btn_login.gif
The search head distributes the search across many indexes and consolidates the results
Figure 2-5. The Unique Characteristics of Splunk Indexes
Splunk divides a stream of machine data into individual events. Remember, an event in machine data can be as simple as one line in a log file or as complicated as a stack trace containing several hundred lines.
Every event in Splunk has at least the four default fields shown in Table
2-1.
18

|
|
|
Chapter 2: Getting Data In |
|
|
|
|
|
|
|
|
Table 2-1. Fields Splunk Always Indexes |
||
|
|
|
|
|
|
Field |
Answers the question |
|
Examples |
|
source |
Where did the data come from? |
|
files (/var/log/), scripts |
|
|
|
|
(myscript.bat), net- |
|
|
|
|
work feeds (UDP:514) |
|
|
|
|
|
|
sourcetype |
What kind of data is it? |
|
access_combined, |
|
|
|
|
syslog |
|
host |
Which host or machine did the |
|
webserver01, cisco_ |
|
|
data come from? |
|
router |
|
|
|
|
|
|
_time |
When did the event happen? |
|
Sat Mar 31 02:16:57 |
|
|
|
|
2012 |
|
|
|
|
|
These default fields are indexed along with the raw data.
The timestamp (_time) field is special because Splunk indexers uses it to order events, enabling Splunk to efficiently retrieve events within a time range.
Chapter 3 brings us to the place where most of the action happens: Splunk’s search interface.
19