

exploring-splunk
.pdfExploring Splunk
It’s often said that you can’t prove a negative. You can’t look everywhere and say, what I seek is not there. With Splunk you can do negative searching and in fact you should. The reason it’s hard to see what’s happening with log files, and many other types of data, is that so much of it is the same, sort of business- as-usual machine data. With Splunk you can categorize that uninteresting data and tell Splunk to show you only what’s unusual or different. Show me what I haven’t seen before. Some security experts use Splunk in just this way to identify anomalous events that could indicate an intrusion, for example. If they’ve seen it before, they give it a tag and exclude it from their search. After you do this for a while, if anything odd happens, you’ll see it right away.
Event Types
When you search in Splunk, you start by retrieving events. You implicitly look for a particular kind of event by searching for it. You could say that you were looking for events of a certain type. That’s how “event types” are used: they let you categorize events.
Event types facilitate event categorization using the full power of the search command, meaning you can use Boolean expressions, wildcards, field values, phrases, and so on. In this way, event types are even more powerful than tags, which are limited to field values. But, like tags, how your data is categorized is entirely up to you.
You might create event types to categorize events such as where a customer purchased, when a system crashed, or what type of error condition occurred.
It’s all about what you need to know about your events.
Here are some ground rules for a search that defines an event type:
•No pipes. You can’t have a pipe in a search used to create an event type (i.e., it cannot have any search commands other than the implied search command).
•No subsearches. At the end of Chapter 3, we briefly covered the wheel-within-a-wheel that is subsearches; for now, remember that you can’t use them to create event types.
Here’s a simple example. In our ongoing quest to improve our website, we’re going to create four event types based on the status field:
•status=”2*” is defined as success.
•status=”3*” is defined as redirect.
•status=”4*” is defined as client_error.
•status=”5*” is defined as server_error.
62
Chapter 5: Enriching Your Data
To create the event type success as we’ve defined it, you would perform a search like this:
sourcetype=”access*” status=”2*”
Next, choose Create » Event type. The Save As EventType dialog appears where you name the event type, optionally assign tags, and click Save.
To see the event types matching your search results, click eventtype in the Fields sidebar. This multivalued field shows all the event types for the events in the events list.
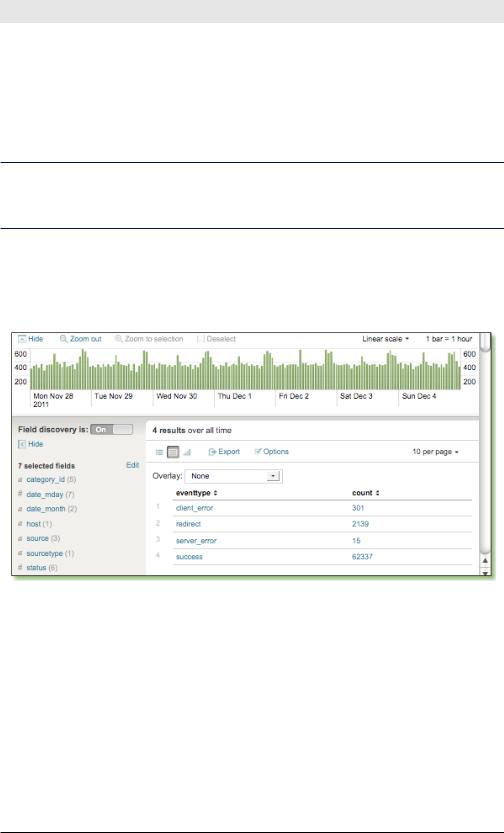
We create the other three event types in just the same way, and then run a stats count to see the distribution:
sourcetype=”access*”| stats count by eventtype
The results look like Figure 5-5.
Figure 5-5. Breaking down events by event type
There are relatively few events with an event type of server_error but, nonetheless, they merit a closer look to see if we can figure out what they have in common.
Clicking server_error lets us to drill down into events of just that event type, where we see 15 events that all look something like the one shown in Figure 5-6.
63

Exploring Splunk
Figure 5-6. An event with a server error
The server_error events have one rather disturbing thing in common: people are trying to buy something when the server unavailable status occurs. In other words, this is costing us money! It’s time to go talk to the person who administers that server and find out what’s wrong.
Nesting Event Types
You can build more specific event types on top of more general event types. We could define a new event type web_error with other event types as building blocks:
eventtype=client_error OR eventtype=server_error
Of course, you should use this sparingly because you don’t want to risk losing track and inadvertently creating circular definitions.
Tagging Event Types
Event types can have tags (and so can any field value for that matter). For example, you can tag all error event types with the tag error. You can then add a more descriptive tag about the types of errors relevant to that event type. Perhaps there are three types of errors: one type that indicates early warnings of possible problems, others that indicate an outage that affects the user, and others that indicate catastrophic failure. You can add another tag to the error event types that is more descriptive, such as early_warning, user_impact, or red_alert, and report on them separately.
Together, event types and tags let you start building a higher-level model from the detailed events of the machine data in question. Usually, this is an iterative process. You begin by tagging a few useful fields, using them for monitoring and alerting. Soon after, you’ll create a few event types to do more complex categorization. Perhaps you build higher-level event types by referencing lower-level event types. Perhaps you then add tags to your event types to unify several categorizations. All the while, you’re adding knowledge to Splunk about how to organize and label your data for your needs.
64

Chapter 5: Enriching Your Data
Earlier we mentioned negative searching. If you tag all the event types you don’t especially want to see with a tag of normal, you can then search for events that are NOT normal. This brings abnormalities to the surface.
NOT tag::eventtype=normal
Visualizing Data
So far we’ve shown you a couple of ways to get at data visualizations:
•Clicking a fieldname in the Fields sidebar to see some quick graphics about a field.
•Using the top and stats search commands.
•Using sparklines to see inline visualizations in the events table results.
This section shows you how to create charts and dashboards for visualizing your data.
Creating Visualizations
When you look at a table of data, you may see something interesting. Putting that same data into charts and graphs can reveal new levels of information and bring out details that are hard to see otherwise.
To create charts of your data, after you run a search, select Create » Report. Alternatively, in Splunk 4.3, click the Results Chart icon in the Results area to display a chart of your results.
Splunk offers various chart types: column, line, area, bar, pie, and scatterplots.
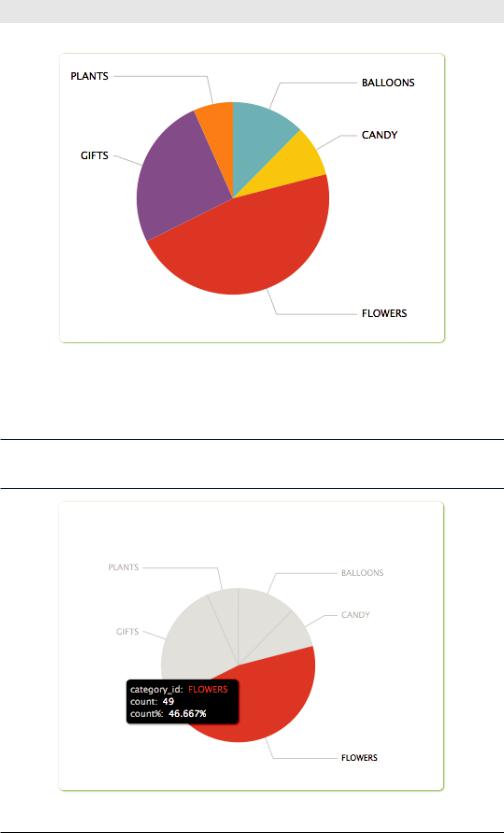
What product categories are affected most by 404 errors? This search calculates the number of events for each category_id and generates the pie chart shown in Figure 5-7.
sourcetype=”access*” status=”404” | stats count by category_id
65
Exploring Splunk
Figure 5-7. Pages not found by product category
Given that flowers and gifts are among the highest-margin products, we’d better add some redirects for the bad URLs (and try to get the sites that are linking to our pages to update their links).
When you mouse over any graphic in Splunk, you get more information about the data behind that portion of the graphic. See Figure 5-8.
Hovering over part of a graphic displays detail about the data
Figure 5-8. Hovering over part of a graphic displays detail about the data
66
Chapter 5: Enriching Your Data
Creating Dashboards
The end result of using Splunk for monitoring is usually a dashboard with several visualizations. A dashboard is made up of report panels, which can be a chart, a gauge, or a table or list of search results (often the data itself is interesting to view).
When designing dashboards, ask yourself, “Of all of these charts, which ones would I want to see first? Which ones would end users want to see first? Which ones would line-of-business managers want to see first?”
Maybe each audience needs its own dashboard.
Then you can ask, “What questions arise from looking at this dashboard?” Splunk automatically handles many kinds of drill downs into chart specifics with a simple click on the chart. (Advanced users can specify drilldown behavior explicitly, but that is beyond the scope of this book.)
One key point to remember is that simple visualizations are generally the most popular with all levels of users. You can, and should, make more advanced and detailed dashboards, but make sure to do a good job covering the simple, high-level views.
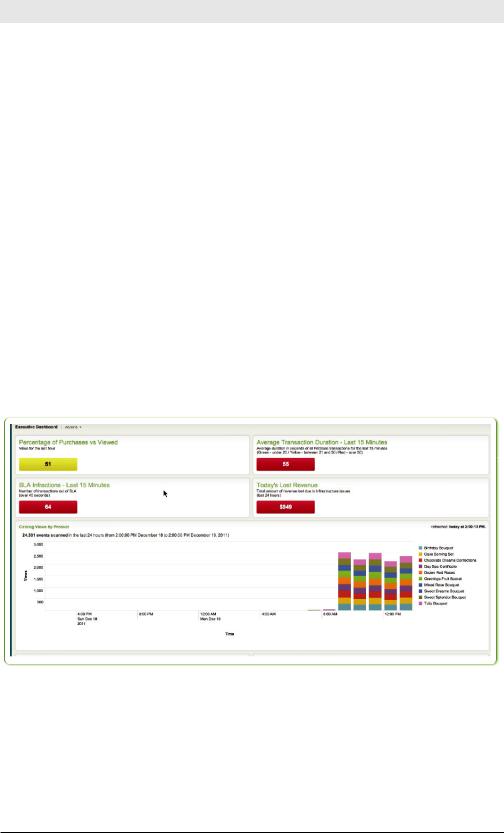
Figure 5-9 shows an example of a dashboard.
Figure 5-9. A dashboard
The best way to build a dashboard is not from the top down but from the bottom up, with each panel. Start by using Splunk’s charting capabilities to show the vital signs in various ways. When you have several individual charts showing different parts of the system’s health, place them onto a dashboard.
67

Exploring Splunk
Creating a Dashboard
In Splunk 4.3, to create a dashboard and add a report, chart, or search results to it:
1.Run a search that generates a report for a dashboard.
2.Select Create » Dashboard panel.
3.Give your search a name, and click Next.
4.Decide if you want this report to go on a new dashboard or on an existing dashboard. If you’re creating a new dashboard, give it a name. Click Next.
5.Specify a title for your dashboard and a visualization (table, bar, pie, gauge, etc.), and when you want the report for the panel to run
(whenever the dashboard is displayed or on a fixed schedule).
6.Click Next followed by the View dashboard link or OK.
Viewing a Dashboard
At any time you can view a dashboard by selecting it from the Dashboards &Views menu at the top of the page.
Editing a Dashboard
While viewing your dashboard, you can edit it by clicking On in the Edit mode selector and then clicking the Edit menu of any panel you want to edit. From there, you can edit the search that generates a report or how it’s visualized, or delete the panel.
Creating Alerts
What is an alert? You can think of an alert as an “if-then” statement that gets evaluated on a schedule:
If this happens, then do that in response.
The “if” in this case is a search. The “then” is the action you want to be taken in response to the “if” clause being fulfilled.
More formally, an alert is a search that runs periodically with a condition evaluated on the search results. When the condition matches, some actions are executed.
Creating Alerts through a Wizard
To get started with creating an alert, the first step is to search for the condition about which you want to be alerted. Splunk takes whatever search
68
Chapter 5: Enriching Your Data
is in the search bar when you create an alert and uses that as a saved search, which becomes the basis for your alert (the “if” in your “if-then”).
With the search you want in the search bar, select Create » Alert. This starts a wizard that makes it easy to create an alert.
Scheduling an Alert
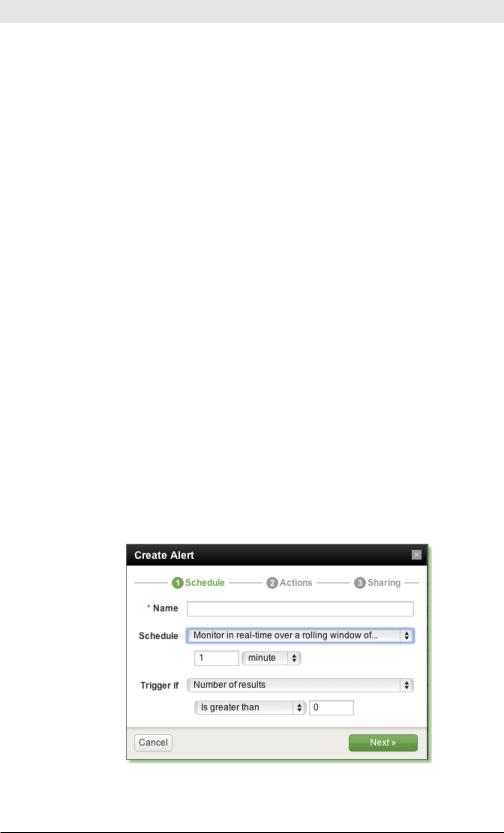
On the Schedule screen of the Create Alerts dialog, you name the alert and specify how you want Splunk to execute it.
You can choose whether Splunk monitors for a condition by running a search in real time, by running a scheduled search periodically, or by monitoring in real time over a rolling window.
Here are the use cases for these three options:
•Monitor in real time if you want to be alerted whenever the condition happens.
•Monitor on a scheduled basis for less urgent conditions that you nonetheless want to know about.
•Monitor using a real-time rolling window if you want to know if a certain number of things happen within a certain time period (it’s a hybrid of the first two options in that sense). For example, trigger the alert as soon as you see more than 20 404s in a 5-minute window.
If you specify that you want to monitor on a schedule or in a rolling window, you must also specify the time interval and the number of results that should match the search to trigger the alert. Alternatively, you could enter a custom condition, which is a search that is executed if the alert condition is met. Custom conditions are described later in this chapter.
Figure 5-10. Scheduling an alert
69
Exploring Splunk
The next step is to set limits and specify what to do if the alert is triggered.
Specifying Actions
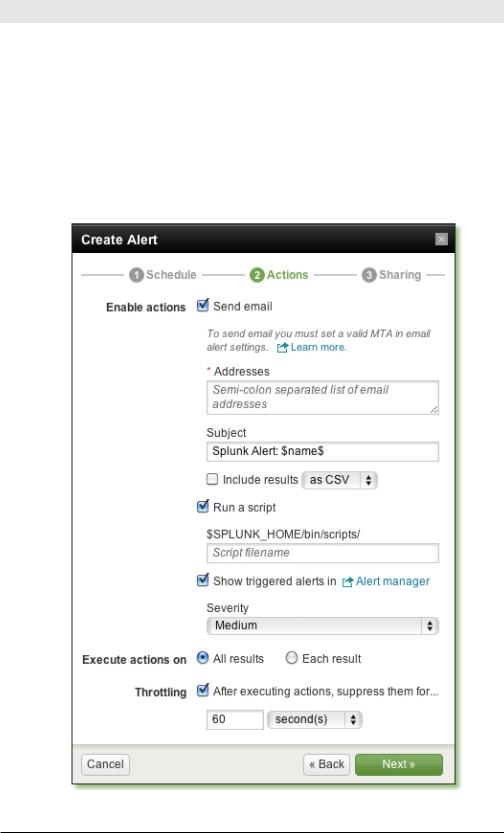
What should happen if the alert condition occurs? On the Action screen of the Create Alert dialog, you specify what action or actions you want to take (sending email, running a script, showing triggered alerts in Alerts Manager).
In Figure 5-11, the user chose all of the above actions, letting us see all the options available here.
Figure 5-11. Action screen of the wizard
70

Chapter 5: Enriching Your Data
•Send email. Email has the following options:
◊Email addresses. Enter at least one.
◊Subject line. You can leave this as the default, which is Splunk Alert: AlertName. The alert name is substituted for $name$. (This means you could change that subject to: Oh no! $name$ happened.)
◊Include the results that triggered the alert. Click the checkbox to include them either as an attached CSV file or select inline to put them right into the email itself.
•Run a script.You specify the script name, which must be placed in Splunk’s home directory, within /bin/scripts or within an app’s / bin/scripts directory.
•Show triggered alerts in Alert manager, which you reach by click-
ing Alerts in the upper right corner of the UI.
After you choose an action (or two or three), you can fill in a few more options:
•Set the severity. The severity is metadata for your reference so that you can classify alerts. The levels are info, low, medium, high, and critical. Severity shows up in Alert manager.
•Execute actions on all results or each result. This determines whether Splunk takes the action (such as sending an email) for the group
of results that matches the search or for each individual result. “All results” is the default.
•Throttling. Alerts are effective only if they tell you what you need to know when you need to know it. Too many alerts and you’ll ignore them. Too few and you won’t know what’s happening. This option specifies how long Splunk should wait to perform the action associated with the alert again, after it has been triggered. If you specify a rolling window, the wizard defaults the throttling interval to match that window. More throttling options are described later in this chapter.
After you click Next, the final step is to specify whether the alert is private or shared for read-only access to users of the current app. Click Finish to finalize the alert.
Tuning Alerts Using Manager
Setting the right limits for alerting usually requires trial and error. It may take some adjustment to prevent too many unimportant alerts or too few important ones. The limits should be tuned so that, for example, one spike
71