


vk.com/id446425943
Transneft
Transneft
Transneft’s dividend payout ratio grew from 5% in 2014 to 43% in 2017. We believe a 50% payout ratio will become a permanent feature of the company’s future dividend policy, which would imply a 2018 dividend of RUB14,177/common share, on our estimates, reflecting a current yield of 8.3%. Higher dividend payments are just one of the signs of the recent improvements in the company’s corporate governance, with future changes possibly including a conversion of prefs into commons and a formal change in the dividend policy to reflect the higher actual payout ratio (vs the 25% currently stated). Additional upside may be presented by the potential to realise the value of its quasitreasury shareholding and line-fill in the longer term. Maintain BUY with a 4% higher TP of RUB224,000.
Significant improvement in dividend policy drives equity outlook
We estimate that Transneft’s 2018 dividend could amount to RUB14,177/pref share, based on a 50% dividend payout ratio, which implies a dividend yield of 8.3%. Higher dividend payments are just one of the signs of the recent improvements in the company’s corporate governance, with future changes possibly including a conversion of prefs into commons and a formal change in the dividend policy to reflect the higher actual payout ratio (vs the 25% currently stated).
Fair regulation and capex slowdown drive sustainable positive FCF
We believe the oil transportation tariff – unlike that for gas – is fairly regulated, with Transneft achieving an RoIC of between 9% and 10%, significantly higher than the same metrics for Gazprom’s gas pipelines (2-3%). As the East Siberia Pacific Ocean pipeline (ESPO) expansion project comes to an end in 2020, we estimate the company’s capex will decline from $5.5bn in 2018 to under $4bn in 2021, with improved FCF gradually leaving more room for a higher dividend payout ratio in future years.
Valuation and risks
We value Transneft based on an EVA/DCF approach with an estimated WACC of 12%. Our TP includes the value of its quasi-treasury shares and a 57.4% stake in Novorossiysk Commercial Sea Port, but excludes the value of the line-fill. The main risks to our investment case include slower tariff growth or higher-than-expected capex, a further tightening of anti-Russian sanctions, and lower-than-expected dividend payouts.
Company update
BUY (maintained) TP: RUB224,000
(previously RUB215,000)
Oil & Gas Russia
Report date: |
14 December 2018 |
|
Current price, RUB |
|
169,900.0 |
Upside/downside, % |
|
31.8 |
MktCap, $mn |
|
18,221.3 |
Average daily volume, RUBmn |
253.3 |
|
Free float, RUBmn |
|
79,252.1 |
Bloomberg |
|
TRNFP RX |
|
|
|
Summary valuation and financials, RUBbn (unless otherwise stated)
|
|
2017 |
2018E |
2019E |
2020E |
|
Revenue |
884 |
976 |
1,003 |
1,009 |
||
EBITDA |
395 |
462 |
480 |
484 |
||
Net income |
192 |
202 |
196 |
188 |
||
Net debt |
345 |
418 |
397 |
364 |
||
EPS, RUB |
26,949 |
28,354 |
27,556 |
26,383 |
||
DPS pref, RUB |
11,582 |
14,177 |
13,778 |
13,192 |
||
EV/Sales, x |
1.8 |
1.7 |
1.6 |
1.6 |
||
EV/EBITDA, x |
4.1 |
3.5 |
3.4 |
3.4 |
||
P/E, x |
6.3 |
6.0 |
6.2 |
6.4 |
||
Net debt/EBITDA, x |
0.9 |
0.9 |
0.8 |
0.8 |
||
Dividend yield |
6.8 |
8.3 |
8.1 |
7.8 |
||
FCF yield, % |
-4.2 |
18.8 |
10.0 |
10.9 |
||
RoIC, % |
9 |
|
9 |
9 |
9 |
|
Source: Company data, Renaissance Capital estimates |
||||||
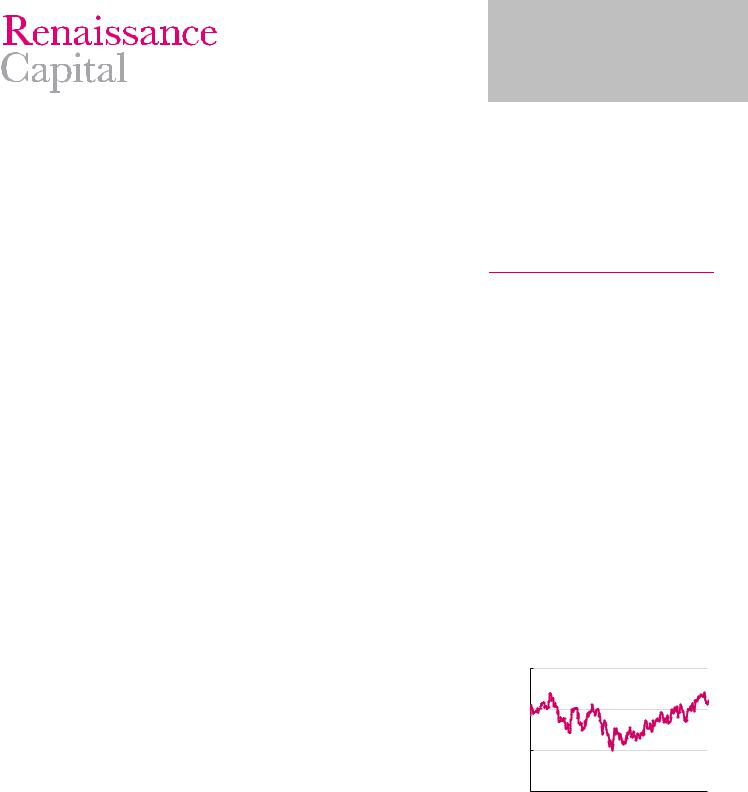
Figure 101: Price performance – 52 weeks, RUB |
||||||
RUB |
|
|
TRNFP RX |
|
|
|
|
|
|
|
|||
200,000 |
|
|
|
|
|
|
|
|
|
|
|
|
180,000 |
|
|
|
|
|
|
|
|
|
|
|
|
160,000 |
|
|
|
|
|
|
|
|
|
|
|
|
140,000 |
|
|
|
|
|
|
|
|
|
|
|
|
120,000 |
Jan-18 |
|
Mar-18 |
|
May-18 |
Jun-18 |
Jul-18 |
|
|
|
|
|
Dec-17 |
Feb-18 |
Apr-18 |
Aug-18 |
Sep-18 |
Oct-18 |
Nov-18 |
Dec-18 |
Source: Bloomberg

vk.com/id446425943 |
|
|
|
|
|
|
|
|
|
|
|
|
|
|
|
|
|
|
|
|
|
|
|
|
Renaissance Capital |
||
|
|
|
|
|
|
|
|
|
|
|
14 December 2018 |
||
|
|
|
|
|
|
|
|
|
|
|
|
|
Transneft |
Figure 102: Transneft prefs current shareholding structure |
Figure 103: Transneft prefs dividend and payout |
|
|
|
|
||||||||
|
|
Quasi treasury |
Preferred dividend (lhs), RUB/share |
|
|
Total payout ratio, rhs |
|||||||
Russian fund |
|
|
|
|
|
|
|
|
|
|
|
|
|
Freefloat |
shares (via |
16,000 |
|
|
|
|
|
|
|
|
|
60% |
|
of direct |
|
|
|
|
|
|
|
|
|
||||
Gazprombank) |
|
|
|
|
|
|
|
|
|
||||
30% |
|
|
|
|
|
|
|
|
|
|
|
||
investments |
|
|
|
|
|
|
|
|
|
|
|
||
31% |
14,000 |
|
|
|
|
|
|
|
|
|
|
||
|
|
|
|
|
|
|
|
|
|
|
|||
0% |
|
|
|
|
|
|
|
|
|
|
50% |
||
|
|
|
|
|
|
|
|
|
|
|
|
||
|
|
|
12,000 |
|
|
|
|
|
|
|
|
|
|
|
|
|
10,000 |
|
|
|
|
|
|
|
|
|
40% |
|
|
|
|
|
|
|
|
|
|
|
|
|
|
|
Gazfond |
|
8,000 |
|
|
|
|
|
|
|
|
|
30% |
|
pension fund |
|
|
|
|
|
|
|
|
|
|
||
|
|
|
|
|
|
|
|
|
|
|
|
|
|
|
15% |
|
6,000 |
|
|
|
|
|
|
|
|
|
20% |
|
|
|
|
|
|
|
|
|
|
|
|
|
|
Russian- |
|
Gazprombank |
4,000 |
|
|
|
|
|
|
|
|
|
|
Chinese |
|
|
|
|
|
|
|
|
|
|
|
||
|
|
|
|
|
|
|
|
|
|
|
10% |
||
|
- finansovyi |
|
|
|
|
|
|
|
|
|
|
||
investment |
|
2,000 |
|
|
|
|
|
|
|
|
|
||
|
|
|
|
|
|
|
|
|
|
|
|||
|
mutual fund |
|
|
|
|
|
|
|
|
|
|
||
fund |
|
|
|
|
|
|
|
|
|
|
|
|
|
|
(minorities) |
- |
|
|
|
|
|
|
|
|
|
0% |
|
1% |
|
|
|
|
|
|
|
|
|
|
|||
|
23% |
2008 |
2009 |
2010 |
2011 |
2012 |
2013 |
2014 |
2015 |
2016 |
2017 |
2018E |
|
|
|
||||||||||||
|
|
|
|
|
|
|
|
|
|
|
|
|
|
|
|
Source: Gazprombank |
|
|
|
|
|
|
|
|
Source: Company data, Bloomberg |
||
Figure 104: Transneft – load and traffic (rhs) |
|
Figure 105: Transneft – sources and uses of funds, $bn |
||||
|
|
Russian refineries |
FSU refineries |
CFFO |
|
Divestments |
|
|
Non-FSU |
CPC |
Capex and investments |
|
Interest |
|
|
Traffic, bn t*km |
|
Dividends |
|
FCF to equity |
|
|
|
|
|||
600 |
|
|
|
|
|
|
|
|
|
|
|
1,250 |
15 |
|
|
|
|
|
|
|
|
|
|
|
|
|
|
|
|
|
|
|
|
|
|
|
|
|
|
|
|||
500 |
|
|
|
|
|
|
|
|
|
|
|
1,200 |
10 |
|
|
|
|
|
|
|
|
400 |
|
|
|
|
|
|
|
|
|
|
|
1,150 |
5 |
|
|
|
|
|
|
|
|
|
|
|
|
|
|
|
|
|
|
|
|
|
|
|
|
|
|
|
|
||
300 |
|
|
|
|
|
|
|
|
|
|
|
1,100 |
- |
|
|
|
|
|
|
|
|
|
|
|
|
|
|
|
|
|
|
|
|
|
|
|
|
|
|
|
|
||
200 |
|
|
|
|
|
|
|
|
|
|
|
1,050 |
|
|
|
|
|
|
|
|
|
|
|
|
|
|
|
|
|
|
|
|
|
|
(5) |
|
|
|
|
|
|
|
|
100 |
|
|
|
|
|
|
|
|
|
|
|
1,000 |
|
|
|
|
|
|
|
|
|
- |
|
|
|
|
|
|
|
|
|
|
|
950 |
(10) |
|
|
|
|
|
|
|
|
|
|
|
|
|
|
|
|
|
|
|
|
|
|
|
|
|
|
|
|||
2008 |
2009 |
2010 |
2011 |
2012 |
2013 |
2014 |
2015 |
2016 |
2017 |
2018E |
2019E |
2020E |
(15) |
|
|
|
|
|
|
|
|
2011 |
2012 |
2013 |
2014 |
2015 |
2016 |
2017 |
2018E 2019E 2020E 2021E |
||||||||||||||
|
|
|
|
|
|
|
|
|
|
|
|
|
Source: Company data, Renaissance Capital estimates Source: Company data, Renaissance Capital estimates
Figure 106: Transneft – FCF bridge 2018E, $bn |
|
|
|
Figure 107: Transneft – FCF bridge 2019E, $bn |
|
|
|
|
|||||||||||
8 |
|
|
|
|
|
|
|
|
8 |
|
|
|
|
|
|
|
|
|
|
7 |
|
|
|
|
|
|
|
|
|
|
|
|
|
|
|
|
|
||
|
|
|
|
|
|
|
|
7 |
|
|
|
|
|
|
|
|
|
||
|
|
|
|
|
|
|
|
|
|
|
|
|
|
|
|
|
|||
6 |
|
|
|
|
|
|
|
|
|
|
|
|
|
|
|
|
|
||
|
|
|
|
|
|
|
|
6 |
|
|
|
|
|
|
|
|
|
||
|
|
|
|
|
|
|
|
|
|
|
|
|
|
|
|
|
|||
5 |
|
|
|
|
|
|
|
|
|
|
|
|
|
|
|
|
|
||
|
|
|
|
|
|
|
|
|
|
|
|
|
|
|
|
|
|||
|
|
|
|
|
|
|
|
5 |
|
|
|
|
|
|
|
|
|
||
|
|
|
|
|
|
|
|
|
|
|
|
|
|
|
|
|
|||
4 |
|
|
|
|
|
|
|
|
|
|
|
|
|
|
|
|
|
||
|
|
|
|
|
|
|
|
|
|
|
|
|
|
|
|
|
|||
|
|
|
|
|
|
|
|
4 |
|
|
|
|
|
|
|
|
|
||
|
|
|
|
|
|
|
|
|
|
|
|
|
|
|
|
|
|||
3 |
|
|
|
|
|
|
|
|
|
|
|
|
|
|
|
|
|
||
|
|
|
|
|
|
|
|
|
|
|
|
|
|
|
|
|
|||
|
|
|
|
|
|
|
|
3 |
|
|
|
|
|
|
|
|
|
||
|
|
|
|
|
|
|
|
|
|
|
|
|
|
|
|
|
|||
2 |
|
|
|
|
|
|
|
|
|
|
|
|
|
|
|
|
|
||
|
|
|
|
|
|
|
|
|
|
|
|
|
|
|
|
|
|||
|
|
|
|
|
|
|
|
2 |
|
|
|
|
|
|
|
|
|
||
|
|
|
|
|
|
|
|
|
|
|
|
|
|
|
|
|
|||
1 |
|
|
|
|
|
|
|
|
|
|
|
|
|
|
|
|
|
||
|
|
|
|
|
|
|
|
|
|
|
|
|
|
|
|
|
|||
|
|
|
|
|
|
|
|
1 |
|
|
|
|
|
|
|
|
|
||
- |
|
|
|
|
|
|
|
|
|
|
|
|
|
|
|
|
|
||
|
|
|
|
|
|
|
|
|
|
|
|
|
|
|
|
|
|||
|
|
|
|
|
|
|
|
- |
|
|
|
|
|
|
|
|
|
||
(1) |
|
|
|
|
|
|
|
|
|
|
|
|
|
|
|
|
|
||
|
|
|
|
|
|
|
|
CFFO 2018 |
WC |
Other |
CFFO 2019 |
Capex |
FCF 2019 |
Interest |
Dividends 2019 |
||||
CFFO 2017 |
WC |
Other |
CFFO 2018 |
Capex |
FCF 2018 |
Interest |
Dividends 2018 |
||||||||||||
|
|
||||||||||||||||||
|
|
|
|
|
Source: Company data, Renaissance Capital estimates |
|
|
|
Source: Company data, Renaissance Capital estimates |
||||||||||
53

vk.com/id446425943
Renaissance Capital
14 December 2018
Transneft
Figure 108: Transneft – operational and financial forecasts, RUBbn (unless otherwise stated)
|
2012 |
2013 |
2014 |
2015 |
2016 |
2017 |
2018E |
2019E |
2020E |
Load, mnt |
481 |
481 |
478 |
481 |
483 |
478 |
479 |
483 |
483 |
Traffic, bnt-km |
1,128 |
1,156 |
1,147 |
1,185 |
1,219 |
1,211 |
1,215 |
1,225 |
1,225 |
|
|
|
|
|
|
|
|
|
|
Income statement |
2012 |
2013 |
2014 |
2015 |
2016 |
2017 |
2018E |
2019E |
2020E |
Gross revenue |
732 |
750 |
774 |
816 |
848 |
884 |
976 |
1,003 |
1,009 |
Operating expenses |
(493) |
(496) |
(532) |
(579) |
(576) |
(642) |
(720) |
(731) |
(749) |
EBITDA |
324 |
356 |
354 |
356 |
401 |
395 |
462 |
480 |
484 |
EBITDA margin |
44% |
47% |
46% |
44% |
47% |
45% |
47% |
48% |
48% |
EBIT |
240 |
253 |
242 |
237 |
272 |
242 |
256 |
272 |
260 |
EBIT margin |
33% |
34% |
31% |
29% |
32% |
27% |
26% |
27% |
26% |
Financial items |
(5) |
(41) |
(146) |
(71) |
29 |
0 |
(8) |
(24) |
(22) |
Profit before tax |
235 |
212 |
96 |
166 |
301 |
242 |
247 |
248 |
238 |
Net income |
181 |
153 |
59 |
143 |
233 |
192 |
202 |
196 |
188 |
Average number of shares outstanding, mn |
7.1 |
7.1 |
7.1 |
7.1 |
7.1 |
7.1 |
7.1 |
7.1 |
7.1 |
EPS, RUB per share |
25,418 |
21,532 |
8,275 |
20,189 |
32,789 |
26,949 |
28,354 |
27,556 |
26,383 |
DPS - common, RUB per share |
685 |
1,221 |
319 |
2,077 |
4,296 |
11,582 |
14,177 |
13,778 |
13,192 |
DPS - preferred, RUB per share |
685 |
724 |
758 |
823 |
4,296 |
11,582 |
14,177 |
13,778 |
13,192 |
Payout ratio |
3% |
5% |
5% |
9% |
13% |
43% |
50% |
50% |
50% |
|
|
|
|
|
|
|
|
|
|
Growth rates |
|
|
|
|
|
|
|
|
|
Traffic |
1% |
3% |
-1% |
3% |
3% |
-1% |
0% |
1% |
0% |
Revenue |
9% |
2% |
3% |
5% |
4% |
4% |
10% |
3% |
1% |
EPS |
-4% |
-15% |
-62% |
144% |
62% |
-18% |
5% |
-3% |
-4% |
DPS, preferred |
-4% |
6% |
5% |
9% |
422% |
170% |
22% |
-3% |
-4% |
|
|
|
|
|
|
|
|
|
|
Balance sheet |
2012 |
2013 |
2014 |
2015 |
2016 |
2017 |
2018E |
2019E |
2020E |
Current assets |
462 |
532 |
697 |
641 |
536 |
458 |
404 |
427 |
463 |
Non-current assets |
1,535 |
1,585 |
1,777 |
2,018 |
2,231 |
2,430 |
2,657 |
2,731 |
2,791 |
Total assets |
1,997 |
2,117 |
2,474 |
2,659 |
2,767 |
2,888 |
3,061 |
3,159 |
3,253 |
Current liabilities |
152 |
226 |
384 |
240 |
291 |
280 |
301 |
304 |
309 |
Long-term liabilities |
672 |
575 |
722 |
931 |
757 |
756 |
827 |
827 |
827 |
Minorities |
37 |
25 |
26 |
2 |
2 |
2 |
2 |
1 |
1 |
Equity |
1,136 |
1,290 |
1,342 |
1,486 |
1,716 |
1,849 |
1,931 |
2,026 |
2,116 |
Total equity and liabilities |
1,997 |
2,117 |
2,474 |
2,659 |
2,767 |
2,888 |
3,061 |
3,159 |
3,253 |
|
|
|
|
|
|
|
|
|
|
Cash-flow statement |
2012 |
2013 |
2014 |
2015 |
2016 |
2017 |
2018E |
2019E |
2020E |
Net income |
181 |
153 |
59 |
143 |
233 |
192 |
202 |
196 |
188 |
DD&A |
84 |
102 |
112 |
119 |
129 |
153 |
207 |
208 |
224 |
Other |
(4) |
17 |
128 |
32 |
(33) |
(9) |
(4) |
7 |
65 |
Changes in working capital |
(49) |
41 |
33 |
3 |
34 |
(17) |
(1) |
(7) |
(61) |
Cash flow from operations |
212 |
313 |
332 |
297 |
363 |
318 |
403 |
404 |
415 |
Cash flow used for investments |
(236) |
(245) |
(295) |
(351) |
(335) |
(369) |
(176) |
(283) |
(283) |
Cash flow used for/from financing |
(38) |
6 |
190 |
83 |
(176) |
(71) |
(46) |
(101) |
(98) |
Effect of exchange rate changes |
34 |
34 |
(80) |
(59) |
53 |
38 |
(245) |
- |
- |
Cash flow for the year |
(29) |
108 |
147 |
(30) |
(95) |
(84) |
(64) |
20 |
34 |
|
|
|
|
|
|
|
|
|
|
Key data |
2012 |
2013 |
2014 |
2015 |
2016 |
2017 |
2018E |
2019E |
2020E |
Net debt/(cash), RUBbn |
272 |
175 |
226 |
343 |
274 |
345 |
418 |
397 |
364 |
Net debt/equity |
24% |
14% |
17% |
23% |
16% |
19% |
22% |
20% |
17% |
Days receivables |
62 |
22 |
21 |
17 |
16 |
18 |
18 |
18 |
18 |
Days payables |
94 |
93 |
125 |
100 |
115 |
97 |
97 |
97 |
97 |
RoE |
16% |
12% |
4% |
10% |
14% |
10% |
10% |
10% |
9% |
RoIC |
14% |
13% |
12% |
11% |
11% |
9% |
9% |
9% |
9% |
Source: Company data, Renaissance Capital estimates
54
vk.com/id446425943
MOL Group
We believe 2019 could be an exceptionally strong and eventful year for MOL as the years of strategic focus and investments come to fruition. In the downstream, we upside potential to our estimates of refining margins in the run-up to IMO2020 regulations and on the back of high diesel crack spreads in Europe. In the upstream, we see exploration potential from three new drills in Norway, with results expected by the end of 2019. Elsewhere, the final outcome of arbitration by the International Centre for Settlement of Investment Disputes (ICSID) could pave the way for a resolution of the INA dispute during 2019, we think. Poor dividend policy remains the weakest link in MOL’s investment case, in our view, but a strong FCF outlook and IMO upside could make special dividends a more permanent feature. Maintain BUY with a 5% higher TP of HUF4,400.
Attractive core franchise; positive exposure to IMO2020
MOL’s two flagship refineries (Danube and Bratislava) are among the largest and most complex in Europe, with NCIs of 10.2 and 11.0, respectively. With a 45% share of output in the form of diesel, we believe MOL is attractively positioned to benefit from strong growth in middle distillate consumption in the near term, as well as the higher diesel crack spreads that are likely in the run-up to the introduction of IMO2020 regulations from 1 January 2020.
Exploration upside
MOL plans to drill three exploration wells in its core exploration portfolio around the Mandal High area offshore Norway, with the results expected by the end of 2019. Net risked resource potential associated with these three wells is sufficient to double
MOL Group’s current 2P reserve base of 356mn boe. The company’s efforts in
Norway are supported by world-class partners (Lundin Petroleum, Aker BP and Petoro), with exploration expectations further shaped by alleged similarities between Mandal High and the highly prospective Utsira High areas, according to Lundin. If successful, Norway’s discoveries could go a long way towards fulfilling MOL’s target of adding 350mn boe of new 2P reserves by 2023, substantially reducing future M&A risk, in our view.
INA case close to resolution?
We believe the ongoing corporate dispute over MOL’s 49% stake in INA weighs on the company’s investment case and is delaying an investment decision on the Rijeka refinery upgrade. The final ruling in the ICSID arbitration case (expected in 1Q19) could accelerated resolution of the dispute, particularly in light of the recently stated intention of the Croatian government to repurchase INA shares. With MOL reportedly looking to at least recoup its original $1.8bn investment, a possible resolution of this dispute could support MOL’s share price, in our view.
Company update
BUY (maintained)
TP: HUF4,400 (previously HUF4,200)
Oil & Gas
Hungary
Report date: |
14 December 2018 |
|
Current price, HUF |
|
3,110.0 |
Upside/downside, % |
|
41.5 |
MktCap, HUFmn |
|
2,548,411.2 |
Average daily volume, HUFmn |
2,491.1 |
|
Free float, HUFmn |
|
1,164,620.5 |
Bloomberg |
|
MOL HB |
|
|
|
Summary valuation and financials, HUFmn (unless otherwise stated)
|
2017 |
2018E |
2019E |
2020E |
|
Revenue |
5,497 |
6,939 |
6,317 |
6,075 |
|
EBITDA |
680 |
766 |
732 |
707 |
|
Net income |
307 |
302 |
273 |
255 |
|
Net debt |
435 |
277 |
(11) |
(248) |
|
EPS, HUF |
438 |
433 |
392 |
366 |
|
DPS, HUF |
128 |
94 |
103 |
113 |
|
EV/sales, x |
0.5 |
0.4 |
0.4 |
0.5 |
|
EV/EBITDA, x |
4.1 |
3.6 |
3.8 |
3.9 |
|
P/E, x |
7.1 |
7.2 |
7.9 |
8.5 |
|
Net debt/EBITDA, x |
0.6 |
0.4 |
(0.0) |
(0.4) |
|
Dividend yield, % |
4.1 |
3.0 |
3.3 |
3.6 |
|
FCF yield, % |
10.6 |
11.4 |
15.8 |
14.3 |
|
RoIC, % |
10.6 |
10.7 |
9.8 |
9.2 |
|
Source: Company data, Renaissance Capital estimates |
|||||
Figure 109: Price performance – 52 weeks |
|
||||
HUF |
|
|
MOL HB |
|
|
|
|
|
|
||
3,500 |
|
|
|
|
|
|
|
|
|
|
|
|
3,000 |
|
|
|
|
|
|
|
|
|
|
|
|
2,500 |
|
|
|
|
|
|
|
|
|
|
|
|
2,000 |
Jan-18 |
|
Mar-18 |
|
May-18 |
Jun-18 |
Jul-18 |
|
|
|
|
|
Dec-17 |
Feb-18 |
Apr-18 |
Aug-18 |
Sep-18 |
Oct-18 |
Nov-18 |
Dec-18 |
Source: Bloomberg

vk.com/id446425943 |
|
|
|
|
|
|
|
|
|
|
|
|
|
|
||
|
|
|
|
|
|
|
|
|
|
|
|
|
|
Renaissance Capital |
||
|
|
|
|
|
|
|
|
|
|
|
|
|
|
14 December 2018 |
||
|
|
|
|
|
|
|
|
|
|
|
|
|
|
|
|
MOL Group |
Figure 110: MOL current shareholding structure |
|
Figure 111: MOL – model refining margin, $/bl |
|
|
|
|
Figure 3: MO |
|||||||||
OmanOil |
OTP ING Bank |
UniCredit |
|
|
|
|
|
|
5Y range |
|
Margin |
|
|
|||
(Budapest) |
Bank Plc |
N.V. |
Bank Ag |
|
14 |
|
|
|
|
|
|
|
|
|
|
|
Ltd |
5% |
4% |
3% |
|
12 |
|
|
|
|
|
|
|
|
|
|
|
7% |
|
|
|
|
|
|
|
|
|
|
|
|
|
|
||
|
|
|
|
|
|
|
|
|
|
|
|
|
|
|
||
|
|
|
|
|
10 |
|
|
|
|
|
|
|
|
|
|
|
|
Hungarian |
|
Other |
8 |
|
|
|
|
|
|
|
|
|
|
|
|
|
State |
|
|
56% |
6 |
|
|
|
|
|
|
|
|
|
|
|
|
25% |
|
|
|
|
|
|
|
|
|
|
|
|
|
|
|
|
|
|
|
|
|
|
|
|
|
|
|
|
|
|
|
|
|
|
|
|
|
4 |
|
|
|
|
|
|
|
|
|
|
|
|
|
|
|
|
2 |
|
|
|
|
|
|
|
|
|
|
|
|
|
|
|
|
0 |
February |
March |
|
May |
June |
July |
August |
September |
October |
|
|
|
|
|
|
|
January |
April |
November |
December |
||||||||
Note: Unicredit’s (3.6%) and ING’s (4.7%) stakes are effectively treasury shares put into lending structures secured through call and put options. OTP Bank’s 4.9% is a share swap long-term cross-shareholding. 9.3% is physically in
treasury. Maximum voting right for any shareholder is 10%. A special B share is owned by the Hungarian government. |
Source: Thomson Reuters Datastream, Bloomberg |
|
Source: Company data |
||
|
Figure 112: MOL – share price performance ($) vs model refining margin ($/bl) |
Figure 113: MOL – sources and uses of funds, $mn |
|
|
|
|||||||||||||||
|
Refining Margin (30-day moving average) |
|
|
MOL HB Equity RHS |
CFFO |
|
|
|
|
Divestments |
|
|
|||||||
|
|
|
Capex and investments |
|
Dividends |
|
|
||||||||||||
11 |
|
|
|
|
|
|
|
|
|
|
14 |
|
|
|
|||||
|
|
|
|
|
|
|
|
|
|
Interest |
|
|
|
FCF to equity |
|
||||
|
|
|
|
|
|
|
|
|
|
|
|
|
|
|
|
||||
10 |
|
|
|
|
|
|
|
|
|
|
13 |
4,000 |
|
|
|
|
|
|
|
|
|
|
|
|
|
|
|
|
|
|
|
|
|
|
|
|
|
||
9 |
|
|
|
|
|
|
|
|
|
|
12 |
3,000 |
|
|
|
|
|
|
|
|
|
|
|
|
|
|
|
|
|
|
|
|
|
|
|
|
|
||
8 |
|
|
|
|
|
|
|
|
|
|
11 |
2,000 |
|
|
|
|
|
|
|
7 |
|
|
|
|
|
|
|
|
|
|
|
|
|
|
|
|
|
||
|
|
|
|
|
|
|
|
|
|
10 |
|
|
|
|
|
|
|
|
|
6 |
|
|
|
|
|
|
|
|
|
|
1,000 |
|
|
|
|
|
|
|
|
|
|
|
|
|
|
|
|
|
|
|
|
|
|
|
|
|
|
||
|
|
|
|
|
|
|
|
|
|
|
|
|
|
|
|
|
|
|
|
5 |
|
|
|
|
|
|
|
|
|
|
9 |
- |
|
|
|
|
|
|
|
|
|
|
|
|
|
|
|
|
|
|
|
|
|
|
|
|
|
||
4 |
|
|
|
|
|
|
|
|
|
|
8 |
|
|
|
|
|
|
|
|
|
|
|
|
|
|
|
|
|
|
|
(1,000) |
|
|
|
|
|
|
|
|
3 |
|
|
|
|
|
|
|
|
|
|
7 |
|
|
|
|
|
|
|
|
|
|
|
|
|
|
|
|
|
|
|
|
|
|
|
|
|
|
||
2 |
|
|
|
|
|
|
|
|
|
|
6 |
(2,000) |
|
|
|
|
|
|
|
|
|
Jun-17 |
Aug-17 |
|
|
|
|
Jun-18 |
Aug-18 |
|
|
|
|
|
|
|
|
||
Dec-16 |
Feb-17 |
Apr-17 |
Oct-17 |
Dec-17 |
Feb-18 |
Apr-18 |
Oct-18 |
(3,000) |
|
|
|
|
|
|
|
||||
2013 |
2014 |
2015 |
2016 |
2017 |
2018E 2019E |
2020E |
2021E |
||||||||||||
Source: Thomson Reuters Datastream, Bloomberg Source: Company data, Renaissance Capital estimates
Figure 114: MOL – 2018E FCF bridge, $mn |
|
|
|
|
|
Figure 115: MOL – 2019E FCF bridge, $mn |
|
|
|
|
|
|
|||||||||
2,500 |
|
|
|
|
|
|
|
|
|
|
3,000 |
|
|
|
|
|
|
|
|
|
|
|
|
|
|
|
|
|
|
|
|
2,500 |
|
|
|
|
|
|
|
|
|
|
|
2,000 |
|
|
|
|
|
|
|
|
|
|
|
|
|
|
|
|
|
|
|
|
|
|
|
|
|
|
|
|
|
|
|
|
|
|
|
|
|
|
|
|
|
||
|
|
|
|
|
|
|
|
|
|
2,000 |
|
|
|
|
|
|
|
|
|
|
|
|
|
|
|
|
|
|
|
|
|
|
|
|
|
|
|
|
|
|
|
||
1,500 |
|
|
|
|
|
|
|
|
|
|
|
|
|
|
|
|
|
|
|
|
|
|
|
|
|
|
|
|
|
|
|
|
|
|
|
|
|
|
|
|
|
||
|
|
|
|
|
|
|
|
|
|
1,500 |
|
|
|
|
|
|
|
|
|
|
|
|
|
|
|
|
|
|
|
|
|
|
|
|
|
|
|
|
|
|
|||
1,000 |
|
|
|
|
|
|
|
|
|
|
|
|
|
|
|
|
|
|
|
|
|
|
|
|
|
|
|
|
|
|
|
|
|
|
|
|
|
|
|
|
|
||
|
|
|
|
|
|
|
|
|
|
1,000 |
|
|
|
|
|
|
|
|
|
|
|
|
|
|
|
|
|
|
|
|
|
|
|
|
|
|
|
|
|
|
|||
500 |
|
|
|
|
|
|
|
|
|
|
|
|
|
|
|
|
|
|
|
|
|
|
|
|
|
|
|
|
|
|
|
|
|
|
|
|
|
|
|
|
|
||
|
|
|
|
|
|
|
|
|
|
500 |
|
|
|
|
|
|
|
|
|
|
|
|
|
|
|
|
|
|
|
|
|
|
|
|
|
|
|
|
|
|
|||
- |
|
|
|
|
|
|
|
|
|
|
|
|
|
|
|
|
|
|
|
|
|
|
|
|
|
|
|
|
|
|
|
- |
|
|
|
|
|
|
|
|
|
|
|
|
|
|
|
|
|
|
|
|
|
|
|
|
|
|
|
|
|
|
|
||
(500) |
|
|
|
|
|
|
|
|
|
|
|
|
|
|
|
|
|
|
|
|
|
|
|
|
|
|
|
|
|
|
|
(500) |
|
|
|
|
|
|
|
|
|
|
|
|
|
|
|
|
|
|
|
|
|
|
|
|
|
|
|
|
|
||||
|
|
|
|
|
|
|
|
|
|
|
|
|
|
|
|
|
|
|
|
||
(1,000) |
|
|
|
|
|
|
|
|
|
|
(1,000) |
|
|
|
|
|
|
|
|
|
|
|
|
|
|
|
|
|
|
|
|
CFFO 2018 |
WC |
Other |
CFFO 2019 |
|
Capex |
FCF 2019 |
Interest |
Dividends |
|||
CFFO 2017 |
WC |
Other |
CFFO 2018 |
Capex |
FCF 2018 |
Interest |
Dividends |
|
|||||||||||||
|
|
|
|
||||||||||||||||||
|
|
|
|
|
Source: Company data, Renaissance Capital estimates |
|
|
|
|
|
Source: Company data, Renaissance Capital estimates |
||||||||||
56

vk.com/id446425943
Renaissance Capital
14 December 2018
MOL Group
Figure 116: MOL – operating and financial summary, HUFmn (unless otherwise stated)
Operating statistics |
2015 |
2016 |
2017 |
2018E |
2019E |
2020E |
Crude oil production, mnt |
47 |
48 |
45 |
50 |
49 |
48 |
Gas production, bcm |
57 |
56 |
54 |
51 |
49 |
48 |
Total hydrocarbon production, mn boe |
104 |
104 |
99 |
101 |
98 |
96 |
Refining throughput, mnt |
19 |
19 |
20 |
19 |
20 |
20 |
|
|
|
|
|
|
|
Income statement |
2015 |
2016 |
2017 |
2018E |
2019E |
2020E |
Gross revenue |
4,467 |
4,700 |
5,497 |
6,939 |
6,317 |
6,075 |
Operating expenses |
(4,683) |
(4,392) |
(5,143) |
(6,527) |
(5,954) |
(5,741) |
EBITDA |
672 |
630 |
680 |
766 |
732 |
707 |
EBITDA margin |
15% |
13% |
12% |
11% |
12% |
12% |
EBIT |
(216) |
308 |
354 |
412 |
364 |
334 |
EBIT margin |
-5% |
7% |
6% |
6% |
6% |
5% |
Financial items |
(93) |
(50) |
(7) |
(35) |
(19) |
(12) |
Profit before tax |
(303) |
273 |
366 |
392 |
359 |
337 |
Net income |
(257) |
263 |
307 |
302 |
273 |
255 |
Average number of shares outstanding, mn |
92 |
91 |
701 |
697 |
697 |
697 |
EPS, HUF per share |
(2,794) |
2,893 |
438 |
433 |
392 |
366 |
DPS, HUF per share |
567 |
625 |
128 |
94 |
103 |
113 |
Payout ratio, % |
(20) |
22 |
29 |
22 |
26 |
31 |
|
|
|
|
|
|
|
Growth rates, % |
|
|
|
|
|
|
Total hydrocarbon production |
7 |
1 |
(5) |
2 |
(3) |
(2) |
Revenue |
47 |
(6) |
8 |
13 |
(4) |
(3) |
EPS |
(6,312) |
(204) |
(85) |
(1) |
(9) |
(7) |
DPS |
17 |
10 |
(80) |
(27) |
10 |
10 |
|
|
|
|
|
|
|
Balance sheet |
2015 |
2016 |
2017 |
2018E |
2019E |
2020E |
Current assets |
1,067 |
1,237 |
1,340 |
1,752 |
1,964 |
2,155 |
Non-current assets |
2,861 |
2,867 |
2,892 |
2,948 |
2,952 |
2,952 |
Total assets |
3,928 |
4,104 |
4,232 |
4,700 |
4,917 |
5,108 |
Current liabilities |
1,131 |
1,383 |
1,170 |
1,468 |
1,468 |
1,468 |
Long-term liabilities |
975 |
919 |
1,006 |
898 |
898 |
898 |
Minorities |
364 |
310 |
315 |
331 |
351 |
371 |
Equity |
1,457 |
1,492 |
1,741 |
2,003 |
2,200 |
2,370 |
Total equity and liabilities |
3,928 |
4,104 |
4,232 |
4,700 |
4,917 |
5,108 |
|
|
|
|
|
|
|
Cash-flow statement |
2015 |
2016 |
2017 |
2018E |
2019E |
2020E |
Net income |
(257) |
263 |
307 |
302 |
273 |
255 |
DD&A |
863 |
315 |
318 |
359 |
368 |
373 |
Other |
13 |
(32) |
19 |
78 |
24 |
17 |
Changes in working capital |
(27) |
(28) |
(84) |
(122) |
76 |
46 |
Cash flow from operations |
592 |
519 |
560 |
616 |
742 |
691 |
Cash flow used for investments |
(218) |
(307) |
(255) |
(278) |
(358) |
(358) |
Cash flow used for/from financing |
(445) |
(126) |
(320) |
(135) |
(96) |
(96) |
Effect of exchange rate changes |
(1) |
(1) |
(5) |
3 |
- |
- |
Cash flow for the year |
(72) |
85 |
(21) |
206 |
288 |
237 |
|
|
|
|
|
|
|
Key data |
2015 |
2016 |
2017 |
2018E |
2019E |
2020E |
Net debt/(cash) |
472 |
606 |
435 |
277 |
(11) |
(248) |
Net debt/equity, % |
0.7 |
1.0 |
0.6 |
0.4 |
(0.0) |
(0.4) |
RoE, % |
(17.6) |
17.7 |
17.6 |
15.1 |
12.4 |
10.8 |
RoIC, % |
(9.2) |
10.4 |
10.6 |
10.7 |
9.8 |
9.2 |
RoACE, % |
(8.2) |
9.4 |
10.2 |
9.2 |
7.5 |
6.5 |
Source: Company data, Renaissance Capital estimates
57

vk.com/id446425943
|
Company update |
Koncern Naftowy ORLEN SA |
HOLD (maintained) |
|
TP: PLN111.0 (previously PLN98.0) |
Oil & Gas
Poland
Polski Koncern Naftowy ORLEN SA
PKN ORLEN is the largest refiner in emerging Europe, but its refining margin is one of the lowest due to its product slate. What we view as the company’s strong FCF potential is offset by low dividend payouts and continuing investment risks, related to the pending acquisition of Grupa LOTOS and the possible construction of a power plant in Poland. We further note the lack of a decision on the required upgrade of its 204kb/d Mazeikiai refinery, which will put pressure on margins from 2020 due to IMO2020 regulations, we think. Our updated model results in an increased TP of PLN111/share; maintain HOLD.
Margins under pressure
PKN ORLEN’s refining margins are negatively affected by a below-average yield of middle distillates and an above-average yield of gasoline and fuel oil, with lower gasoline margins (36% of PKN’s output) likely affecting the 2018 outlook. We further note the lack of a decision on the required upgrade of its 204kb/d Mazeikiai refinery
– a substantial producer of fuel oil – which will put pressure on margins from 2020, we think.
Too much uncertainty
Report date: |
14 December 2018 |
|
Current price, PLN |
|
106.0 |
Upside/downside, % |
|
4.7 |
MktCap, PLNmn |
|
45,337.2 |
Average daily volume, PLNmn |
101.1 |
|
Free float, PLNmn |
|
25,329.8 |
Bloomberg |
|
PKN PW |
|
|
|
Summary valuation and financials, PLNmn (unless otherwise stated)
|
2017 |
2018E |
2019E |
2020E |
Revenue |
95,364 |
118,389 |
114,601 |
111,360 |
EBITDA |
10,278 |
8,986 |
9,268 |
9,365 |
Net income |
6,655 |
6,464 |
5,307 |
5,360 |
Net debt |
194 |
3,631 |
1,641 |
(787) |
EPS, PLN |
15.6 |
15.1 |
12.4 |
12.5 |
DPS, PLN |
3.0 |
3.2 |
3.3 |
3.5 |
EV/sales, x |
0.5 |
0.4 |
0.4 |
0.4 |
EV/EBITDA, x |
4.8 |
5.4 |
5.3 |
5.2 |
P/E, x |
6.8 |
7.0 |
8.5 |
8.5 |
ND/EBITDA, x |
0.0 |
0.4 |
0.2 |
(0.1) |
Dividend yield, % |
2.8 |
3.0 |
3.1 |
3.3 |
FCF yield, % |
8.6 |
5.2 |
7.4 |
8.5 |
RoIC, % |
17.2 |
14.0 |
11.1 |
10.9 |
Source: Company data, Renaissance Capital estimates
PKN ORLEN’s preeminent position in the East European refining sector is complicated by the uncertainty of its future investment projects. Key risks include the ongoing discussions of plans for PKN ORLEN to invest in a power sector in Poland; uncertainty surrounding the timing and valuation of the possible takeover of Grupa
LOTOS; as well as the lack of clarity on the company’s investment plans towards its
Mazeikiai refinery in Lithuania.
Below-average dividend yield
PKN ORLEN’s 2019E FCF yield of 7.4% contrasts with a low dividend yield of just 3.1%, which is below the 4.4% sector average. We believe the company’s dividend payouts will remain depressed at least until the company’s investment projects are clarified.
Figure 117: Price performance – 52 weeks PLN PKN PW
140 |
|
|
|
|
|
|
|
|
|
|
|
|
120 |
|
|
|
|
|
|
|
|
|
|
|
|
100 |
|
|
|
|
|
|
|
|
|
|
|
|
80 |
|
|
|
|
|
|
|
|
|
|
|
|
60 |
Jan-18 |
Feb-18 |
Mar-18 |
Apr-18 |
May-18 |
Jun-18 |
Jul-18 |
Aug-18 |
Sep-18 |
Oct-18 |
|
|
Dec-17 |
Nov-18 |
Dec-18 |
Source: Bloomberg

vk.com/id446425943
Renaissance Capital
14 December 2018
PKN ORLEN
Figure 118: PKN ORLEN current shareholding structure |
Figure 119: PKN ORLEN – model refining margin, $/bl |
|
|
|
|
|
|
|
|
|
|
|
|
16 |
|
|
|
|
5Y range |
|
Margin |
|
|
|
|
|
|
|
|
|
|
|
|
|
|
|
|
|
|
|
|
|
|
|
|
|
|
|
|
|
|
|
|
|
|
|
|
|
|
|
|
14 |
|
|
|
|
|
|
|
|
|
|
|
|
|
|
|
|
|
|
|
|
|
|
|
12 |
|
|
|
|
|
|
|
|
|
|
|
|
|
|
|
|
|
|
State Treasury |
|
|
10 |
|
|
|
|
|
|
|
|
|
|
|
||
|
|
Others |
|
|
|
|
28% |
|
|
|
8 |
|
|
|
|
|
|
|
|
|
|
|
|
|
|
51% |
|
|
|
|
|
|
|
|
PERN |
6 |
|
|
|
|
|
|
|
|
|
|
|
|
|
|
|
|
|
|
|
|
|
|
Spolka |
4 |
|
|
|
|
|
|
|
|
|
|
|
|
|
|
|
|
|
|
|
|
|
|
Akcjyna |
2 |
|
|
|
|
|
|
|
|
|
|
|
|
|
|
|
|
|
|
|
|
|
|
5% |
|
|
|
|
|
|
|
|
|
|
|
|
|
|
|
|
|
|
|
|
|
|
|
0 |
|
|
|
|
|
|
|
|
|
|
|
|
|
|
|
|
|
|
|
|
|
|
Nationale- |
|
|
|
|
|
|
|
|
|
|
|
||
|
|
|
|
|
|
|
|
|
|
-2 |
|
|
|
|
|
|
|
|
|
|
|
||
|
|
|
|
|
|
|
Aviva OFE |
|
Nederlanden |
|
|
|
|
|
|
|
|
|
|
|
|||
|
|
|
|
|
|
|
|
-4 |
|
|
|
|
|
|
|
|
|
|
|
||||
|
|
|
|
|
|
|
7% |
|
|
|
OFE |
February |
March |
April |
May |
June |
July |
August |
September |
October |
|
|
|
|
|
|
|
|
|
|
|
|
|
January |
November |
December |
|||||||||||
|
|
|
|
|
|
|
|
|
|
|
9% |
||||||||||||
|
|
|
|
|
|
|
|
|
|
|
|
|
|
|
|
|
|
|
|
|
|
|
|
|
|
|
|
|
|
|
|
|
|
Source: Company data |
|
|
|
|
|
|
|
Source: Thomson Reuters Datastream, Bloomberg |
|||||
Figure 120: PKN ORLEN – share price performance ($) vs model refining margin ($/bl) |
Figure 121: PKN ORLEN – sources and uses of funds, $mn |
|
|
||||||||||||||||||||
|
Refining Margin (30-day moving average) |
|
|
PKN PW Equity RHS |
|
|
CFFO |
|
|
|
|
|
Divestments |
|
|||||||||
|
|
|
|
|
|
|
|
|
|
|
|
|
|
|
|||||||||
11 |
|
|
|
|
|
|
|
|
|
|
40 |
|
|
Capex and investments |
|
|
Dividends |
|
|
||||
|
|
|
|
|
|
|
|
|
|
|
|
Interest |
|
|
|
|
FCF to equity |
|
|||||
|
|
|
|
|
|
|
|
|
|
|
|
|
|
|
|
|
|
|
|||||
10 |
|
|
|
|
|
|
|
|
|
|
|
3,000 |
|
|
|
|
|
|
|
|
|
|
|
9 |
|
|
|
|
|
|
|
|
|
|
35 |
|
|
|
|
|
|
|
|
|
|
|
|
|
|
|
|
|
|
|
|
|
|
|
|
|
|
|
|
|
|
|
|
|
|
|
|
8 |
|
|
|
|
|
|
|
|
|
|
|
2,000 |
|
|
|
|
|
|
|
|
|
|
|
|
|
|
|
|
|
|
|
|
|
30 |
|
|
|
|
|
|
|
|
|
|
|
|
|
7 |
|
|
|
|
|
|
|
|
|
|
1,000 |
|
|
|
|
|
|
|
|
|
|
|
|
|
|
|
|
|
|
|
|
|
|
|
|
|
|
|
|
|
|
|
|
|
|
||
6 |
|
|
|
|
|
|
|
|
|
|
25 |
|
|
|
|
|
|
|
|
|
|
|
|
5 |
|
|
|
|
|
|
|
|
|
|
- |
|
|
|
|
|
|
|
|
|
|
|
|
|
|
|
|
|
|
|
|
|
|
|
|
|
|
|
|
|
|
|
|
|
|
||
|
|
|
|
|
|
|
|
|
|
|
|
|
|
|
|
|
|
|
|
|
|
|
|
4 |
|
|
|
|
|
|
|
|
|
|
20 |
(1,000) |
|
|
|
|
|
|
|
|
|
|
|
3 |
|
|
|
|
|
|
|
|
|
|
|
|
|
|
|
|
|
|
|
|
|
|
|
2 |
|
|
|
|
|
|
|
|
|
|
15 |
(2,000) |
|
|
|
|
|
|
|
|
|
|
|
|
|
Jun-17 |
Aug-17 |
|
|
|
|
Jun-18 |
Aug-18 |
|
|
|
|
|
|
|
|
|
|
|
|
||
Dec-16 |
Feb-17 |
Apr-17 |
Oct-17 |
Dec-17 |
Feb-18 |
Apr-18 |
Oct-18 |
(3,000) |
|
|
|
|
|
|
|
|
|
|
|
||||
|
2013 |
2014 |
2015 |
2016 |
2017E |
2018E |
2019E |
2020E 2021E |
|||||||||||||||
|
|
|
|
|
Source: Thomson Reuters Datastream, Bloomberg |
|
|
|
|
Source: Company data, Renaissance Capital estimates |
|||||||||
Figure 122: PKN ORLEN – 2018E FCF bridge, $mn |
|
|
|
Figure 123: PKN ORLEN – 2019E FCF bridge, $mn |
|
|
|
|
|||||||||||
2,500 |
|
|
|
|
|
|
|
|
|
2,500 |
|
|
|
|
|
|
|
|
|
2,000 |
|
|
|
|
|
|
|
|
|
2,000 |
|
|
|
|
|
|
|
|
|
|
|
|
|
|
|
|
|
|
|
|
|
|
|
|
|
|
|
||
|
|
|
|
|
|
|
|
|
|
|
|
|
|
|
|
|
|
||
1,500 |
|
|
|
|
|
|
|
|
|
1,500 |
|
|
|
|
|
|
|
|
|
|
|
|
|
|
|
|
|
|
|
|
|
|
|
|
|
|
|
||
1,000 |
|
|
|
|
|
|
|
|
|
1,000 |
|
|
|
|
|
|
|
|
|
|
|
|
|
|
|
|
|
|
|
|
|
|
|
|
|
|
|
||
500 |
|
|
|
|
|
|
|
|
|
500 |
|
|
|
|
|
|
|
|
|
|
|
|
|
|
|
|
|
|
|
|
|
|
|
|
|
|
|
||
|
|
|
|
|
|
|
|
|
|
|
|
|
|
|
|
|
|
||
- |
|
|
|
|
|
|
|
|
|
- |
|
|
|
|
|
|
|
|
|
|
|
|
|
|
|
|
|
|
|
|
|
|
|
|
|
|
|
||
(500) |
|
|
|
|
|
|
|
|
|
(500) |
|
|
|
|
|
|
|
|
|
|
|
|
|
|
|
|
|
|
|
|
|
|
|
|
|
|
|
||
(1,000) |
|
|
|
|
|
|
|
|
|
(1,000) |
|
|
|
|
|
|
|
|
|
CFFO 2017 |
WC |
Other |
CFFO 2018 |
|
Capex |
FCF 2018 |
Interest |
Dividends |
CFFO 2018 |
WC |
Other |
CFFO 2019 |
Capex |
FCF 2019 |
Interest |
Dividends |
|||
|
|
|
|||||||||||||||||
|
|
|
|
Source: Company data, Renaissance Capital estimates |
|
|
|
|
Source: Company data, Renaissance Capital estimates |
||||||||||
59

vk.com/id446425943
Renaissance Capital
14 December 2018
PKN ORLEN
Figure 124: PKN ORLEN – operating and financial summary, PLNmn (unless otherwise stated)
Operating statistics |
2014 |
2015 |
2016 |
2017 |
2018E |
2019E |
2020E |
Total hydrocarbon production, mn boe |
5.2 |
6.2 |
11.2 |
12.8 |
14.0 |
13.8 |
13.8 |
Refining throughput, mnt |
27.3 |
30.9 |
30.1 |
33.2 |
32.9 |
33.1 |
33.1 |
|
|
|
|
|
|
|
|
Income statement |
2014 |
2015 |
2016 |
2017 |
2018E |
2019E |
2020E |
Gross revenue |
106,832 |
88,336 |
79,553 |
95,364 |
118,389 |
114,601 |
111,360 |
Operating expenses |
(111,543) |
(83,996) |
(72,021) |
(86,707) |
(110,293) |
(107,958) |
(104,661) |
EBITDA |
(147) |
7,750 |
9,550 |
10,278 |
8,986 |
9,268 |
9,365 |
EBITDA margin |
0% |
9% |
12% |
11% |
8% |
8% |
8% |
EBIT |
(4,711) |
4,340 |
7,532 |
8,657 |
8,096 |
6,643 |
6,699 |
EBIT margin |
-4% |
5% |
9% |
9% |
7% |
6% |
6% |
Financial items |
(1,535) |
(642) |
(645) |
60 |
(76) |
(92) |
(82) |
Profit before tax |
(6,246) |
3,698 |
6,887 |
8,717 |
8,019 |
6,551 |
6,617 |
Net income |
(5,828) |
2,837 |
5,261 |
6,655 |
6,464 |
5,307 |
5,360 |
Average number of shares outstanding, mn |
428 |
428 |
428 |
428 |
428 |
428 |
428 |
EPS, PLN per share |
(13.6) |
6.6 |
12.3 |
15.6 |
15.1 |
12.4 |
12.5 |
DPS, PLN per share |
1.7 |
2.0 |
3.0 |
3.0 |
3.2 |
3.3 |
3.5 |
Payout ratio, % |
(12) |
30 |
24 |
19 |
21 |
27 |
28 |
|
|
|
|
|
|
|
|
Growth rates, % |
|
|
|
|
|
|
|
Total hydrocarbon production |
|
20.2 |
79.5 |
14.7 |
9.2 |
(1.3) |
(0.3) |
Revenue |
|
(5,372) |
23 |
8 |
(13) |
3 |
1 |
EPS |
|
(149) |
85 |
26 |
(3) |
(18) |
1 |
DPS |
|
21 |
50 |
5 |
5 |
5 |
5 |
|
|
|
|
|
|
|
|
Balance sheet |
2014 |
2015 |
2016 |
2017 |
2018E |
2019E |
2020E |
Current assets |
21,754 |
20,775 |
25,238 |
28,924 |
33,721 |
34,684 |
35,183 |
Non-current assets |
24,971 |
27,362 |
30,321 |
31,740 |
34,143 |
36,366 |
38,548 |
Total assets |
46,725 |
48,137 |
55,559 |
60,664 |
67,863 |
71,049 |
73,731 |
Current liabilities |
14,034 |
13,666 |
16,622 |
16,382 |
20,396 |
19,622 |
18,359 |
Long-term liabilities |
12,305 |
10,227 |
9,652 |
9,071 |
11,016 |
11,016 |
11,016 |
Minorities |
1,615 |
2,071 |
2,522 |
3,014 |
- |
- |
- |
Equity |
18,771 |
22,173 |
26,763 |
32,197 |
36,451 |
40,411 |
44,356 |
Total equity and liabilities |
46,725 |
48,137 |
55,559 |
60,664 |
67,863 |
71,049 |
73,731 |
|
|
|
|
|
|
|
|
Cash-flow statement |
2014 |
2015 |
2016 |
2017 |
2018E |
2019E |
2020E |
Net income |
(5,828) |
2,837 |
5,261 |
6,655 |
6,464 |
5,307 |
5,360 |
DD&A |
1,991 |
1,895 |
2,110 |
2,421 |
2,521 |
2,625 |
2,666 |
Other |
5,272 |
1,942 |
1,144 |
941 |
487 |
(156) |
(166) |
Changes in working capital |
1,752 |
(1,320) |
816 |
(1,967) |
(1,712) |
253 |
665 |
Cash flow from operations |
3,187 |
5,354 |
9,331 |
8,050 |
7,760 |
8,029 |
8,525 |
Cash flow used for investments |
(4,020) |
(4,096) |
(4,436) |
(3,925) |
(8,890) |
(4,600) |
(4,600) |
Cash flow used for/from financing |
2,083 |
(2,866) |
(2,210) |
(2,832) |
265 |
(1,439) |
(1,497) |
Effect of exchange rate changes |
(2) |
19 |
39 |
(121) |
(8) |
- |
- |
Cash flow for the year |
1,248 |
(1,589) |
2,724 |
1,172 |
(874) |
1,990 |
2,428 |
|
|
|
|
|
|
|
|
Key data |
2014 |
2015 |
2016 |
2017 |
2018E |
2019E |
2020E |
Net debt/(cash) |
5,858 |
5,836 |
3,114 |
194 |
3,631 |
1,641 |
(787) |
Net debt/equity, % |
(39.9) |
0.8 |
0.3 |
0.0 |
0.4 |
0.2 |
(0.1) |
RoE, % |
(31.0) |
12.8 |
19.7 |
20.7 |
17.7 |
13.1 |
12.1 |
RoIC, % |
(11.8) |
10.0 |
16.5 |
17.2 |
14.0 |
11.1 |
10.9 |
RoACE, % |
(14.3) |
13.5 |
21.2 |
21.7 |
18.3 |
13.8 |
12.9 |
Source: Company data, Renaissance Capital estimates
60