


vk.com/id446425943
Downstream outlook: EE refiners
We have updated our near-term estimates for the emerging European refiners under our coverage to reflect the 3Q18 reporting season and the most recent trends in the European refining and petrochemical segments. Specifically:
▪Fuel demand growth in emerging Europe remains very strong – particularly for diesel and middle distillates – underscoring our fundamentally positive outlook for the sector. MOL Group reported c. 4% motor fuel consumption growth around its relevant CEE markets in 3Q18. PKN ORLEN said diesel demand in Poland was up 5% YoY, while gasoline consumption increased 3%. In Turkey, Tupras reported diesel and gasoline demand growth of 8% and 4%, respectively, for 8M18. Romania saw a marginal 0.2% YoY decline in fuel demand, but gas and power demand increased 5% and 1% YoY, respectively.
▪3Q18 performance proved strong QoQ, driven by higher gasoline and diesel crack spreads in Europe, somewhat offset by lower fuel oil margins. PKN
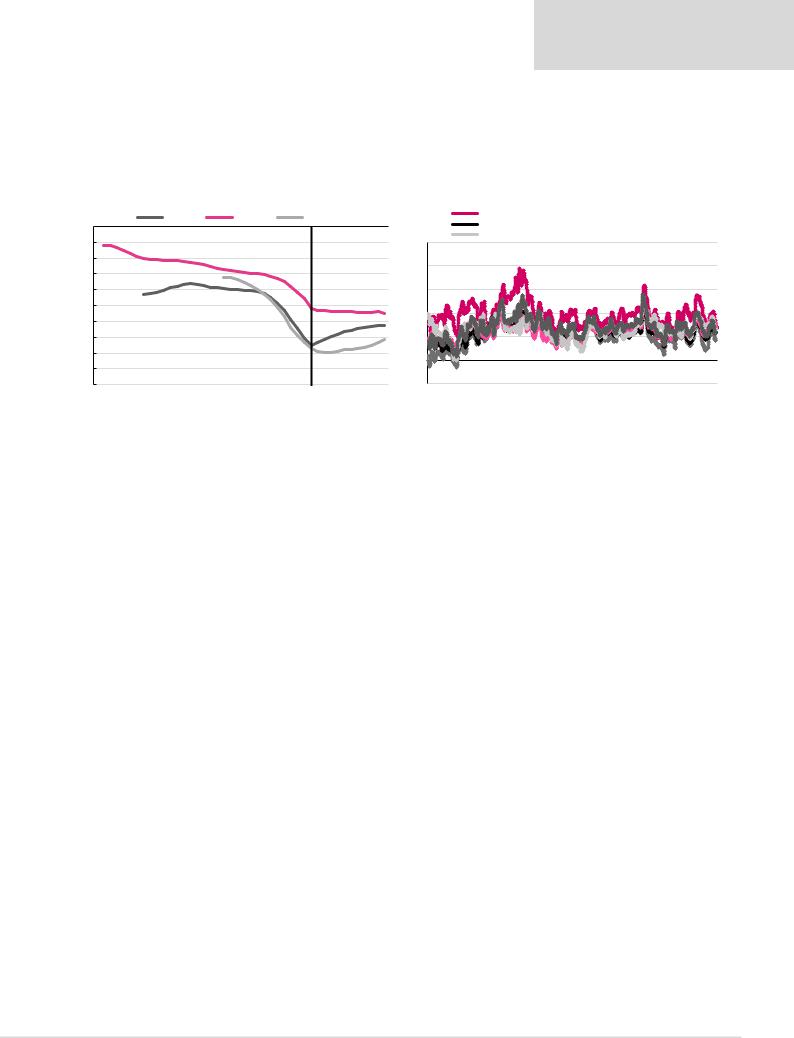
ORLEN’s refining margin decreased 22% YoY in 3Q18 to an average of $6.1/bl, in comparison to $7.9/bl in 3Q17; however, 3Q18 margins improved 19% QoQ in comparison with 2Q18. The 4Q18 margin is showing a downward trend QoQ, having decreased 20% QtD to $4.9/bl. Grupa LOTOS’s refining margin decreased 14% YoY to $7.4/bl in 3Q18. However, the margin improved 1% QoQ and is currently up 19% QtD. The model refining margins for both PKN ORLEN and LOTOS are related, among other things, to the Brent-Urals spread, which recently narrowed by 39% QoQ to $1.3/bl in 3Q18. MOL Group’s refinery margin was down 22% YoY to $5.8/bl in 3Q18, but increased 5% QoQ and is currently down 10% QtD to $5.2/bl. The quarterly improvement could be associated with improved motor fuel cracks and healthy demand in the driving season, according to the company. Tupras reported a net refining margin of $13.5/bl, 48% greater than 3Q17. The strong performance was associated with, among other factors, higher reported capacity utilisation. Consequently, Tupras has raised its net refinery margin expectation to $9.5-10.0/bl. OMV Petrom’s indicator refining margin weakened 24% YoY and 1% QoQ to $6.6/bl, resulting from increased crude oil prices. Our model refining margins (Figures 34-39) show common downward trends QtD as we approach the end of the final month of 2018 – in line with negative seasonality factors expected by some companies.
We continue to associate the future prospects of the sector with the strong demand growth we expect for middle distillates, as a result of underlying consumption trends in the region, as well as the planned introduction of new marine fuel regulations from 2020. In particular, on 26 October 2018, the International Maritime Organisation (IMO) officially adopted an amendment to support the implementation of the 0.5% sulphur limit in fuel oil. Ships will be prohibited from carriage of non-compliant fuel oil for combustion purposes for propulsion or operation on board a ship, unless the ship has a scrubber installed. This complementary amendment, referred to as the “carriage ban”, is expected to enter into force on 1 March 2020. The amendment does not change the original compliance date from 1 January 2020, but is intended as an additional measure to support consistent implementation and compliance. Since this change was proposed in February 2018, it has caused a significant widening in the differential between fuel oil and gasoil futures, as shown in Figure 31. As of December 2018, the forward January 2020 fuel oil-diesel spread is 20% wider than in May 2017. Grupa LOTOS, MOL and Tupras are well positioned to benefit from the increasing demand in middle distillate as a result of the
IMO2020 regulations, in our view. LOTOS’s EFRA project is to be completed in 1H19 and will add 900kt of middle distillate to its output, while MOL and Tupras benefit from some of the more complex refineries in the region and above-average middle distillate yields.
2018 has seen generally stronger refining margins in the region. Tupras has emerged as having the highest refining margin in the sector, with the most significant improvement in its refining margin during 2016-2018, driven by the completion of the residuum upgrade (RUP) project in 2015. Grupa LOTOS follows closely, driven by its diesel-dominated
Renaissance Capital
14 December 2018
Oil & Gas
24
vk.com/id446425943
Renaissance Capital
14 December 2018
Oil & Gas
product slate, and in our view has the potential to overcome Tupras as the most profitable refiner in emerging Europe following the completion of its EFRA project. OMV Petrom’s margin remains above average, benefiting from higher diesel output. MOL Group and PKN ORLEN have the lowest margins in the region, with PKN ORLEN’s performance negatively affected by its unfavourable product slate and high share of gasoline output, in comparison with its competitors.
Figure 31: Widening of fuel oil & gasoil futures, $/t |
Figure 32: Model refining margins against 211 crack spread benchmark, $/bl |
-150 |
|
Dec-17 |
|
May-17 |
Dec-18 |
|
|
|
|
|
|
|
|
|
|
|
|
-170 |
|
|
|
|
|
|
|
25 |
-190 |
|
|
|
|
|
|
|
20 |
-210 |
|
|
|
|
|
|
|
|
|
|
|
|
|
|
|
|
|
-230 |
|
|
|
|
|
|
|
15 |
-250 |
|
|
|
|
|
|
|
10 |
-270 |
|
|
|
|
|
|
|
|
|
|
|
|
|
|
|
|
|
-290 |
|
|
|
|
|
|
|
5 |
-310 |
|
|
|
|
|
|
|
0 |
-330 |
|
|
|
|
|
|
|
|
|
|
|
|
|
|
|
|
|
-350 |
|
|
|
|
|
|
|
-5 |
May-17 |
Nov-17 |
May-18 |
Nov-18 |
May-19 |
Nov-19 |
May-20 |
Nov-20 |
Dec-13 |
211 crack spread |
|
PKN ORLEN |
|
||
MOL Group |
|
Grupa LOTOS |
|
||
Tupras |
|
OMV Petrom |
|
Dec-14 |
Dec-15 |
Dec-16 |
Dec-17 |
Dec-18 |
Source: Bloomberg |
Source: Bloomberg, Thomson Reuters Datastream |
Although most companies have not announced their 2019 macro expectations, their 4Q18 outlook remains relatively robust. PKN ORLEN expects continued GDP growth in Poland as well as an increasing trend for both diesel and gasoline demand. Higher crude oil prices YoY are expected to weigh on downstream margins, but this will somewhat be offset by the continued growth in fuel and petrochemical consumption, according to management. OMV Petrom expects fuel demand to remain flat in the region for the remainder of 2018, with some risk resulting from seasonality factors. MOL also notes that the fourth quarter tends to be seasonally lower. Tupras has revised its net refinery margin expectation up to $9.5-10.0/bl, following higher utilisation rates. Local market dynamics in Turkey remain strong, with diesel consumption expected to grow 4% in 2018 and 2019.
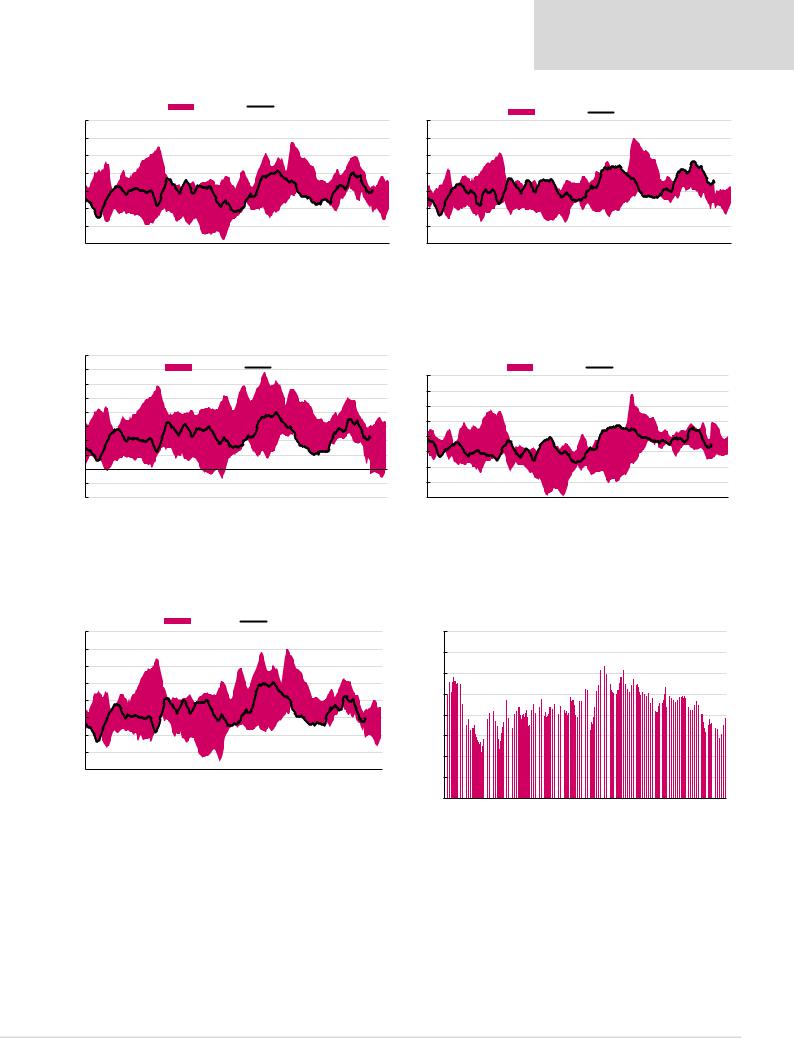
Figure 33 details the companies’ current guidance and our forecast refining margins. However, we believe our forecasts are conservative and that the EE refining sector is generally well positioned to capture possible upside potential from strong expected growth in demand for middle distillates. In particular, we note that if we were to use forward prices to calculate 2020 refining margins (instead of our own price forecasts), our model refining margins would increase substantially.
Figure 33: Refining margins outlook for 2018, $/bl (unless otherwise stated)
Company |
Indicator |
2014 |
2015 |
2016 |
2017 |
2018E |
|
2019E |
2020E based on |
||
Guidance |
Our estimates |
RC forecasts |
Forward prices |
||||||||
|
|
|
|
|
|
|
|||||
PKN ORLEN |
Model refining margin |
3.4 |
8.2 |
5.3 |
6.4 |
lower YoY |
6.0 |
5.6 |
5.3 |
7.8 |
|
MOL Group |
Group refinery margin |
3.4 |
6.1 |
5.7 |
6.5 |
4.00-5.00 |
5.8 |
5.8 |
5.6 |
8.2 |
|
Tupras |
Net refining margin |
3.2 |
6.5 |
6.0 |
8.1 |
7.50-8.00 |
10.5 |
9.1 |
8.4 |
9.9 |
|
|
Med complex margin |
2.0 |
4.8 |
4.0 |
5.3 |
4.75-5.00 |
|
|
|
|
|
OMV Petrom |
Indicator refining margin |
1.9 |
8.7 |
7.0 |
7.8 |
<7.75 |
6.0 |
6.3 |
6.4 |
6.8 |
|
Grupa LOTOS |
Model refining margin |
6.1 |
7.8 |
6.8 |
7.5 |
5.00-6.00 |
6.4 |
8.6 |
8.2 |
11.1 |
|
Source: Company data, Renaissance Capital estimates
25
vk.com/id446425943
Renaissance Capital
14 December 2018
Oil & Gas
Figure 34: MOL model refining margin 7-day average, $/bl |
Figure 35: Grupa LOTOS model refining margin 7-day average, $/bl |
|
|
|
|
|
5Y Range |
|
Margin |
|
|
|
|
14 |
|
|
|
|
|
|
|
|
|
|
14 |
12 |
|
|
|
|
|
|
|
|
|
|
12 |
10 |
|
|
|
|
|
|
|
|
|
|
10 |
8 |
|
|
|
|
|
|
|
|
|
|
8 |
6 |
|
|
|
|
|
|
|
|
|
|
6 |
4 |
|
|
|
|
|
|
|
|
|
|
4 |
2 |
|
|
|
|
|
|
|
|
|
|
2 |
0 |
February |
March |
|
May |
June |
July |
August |
September |
October |
|
0 |
January |
April |
November |
December |
||||||||
Source: Bloomberg, Thomson Reuters Datastream
|
|
|
|
|
5Y Range |
|
Margin |
|
|
|
|
January |
February |
March |
April |
May |
June |
July |
August |
September |
October |
November |
December |
Source: Bloomberg, Thomson Reuters Datastream
Figure 36: PKN ORLEN model refining margin 7-day average, $/bl |
|
|
Figure 37: Tupras model refining margin 7-day average, $/bl |
|
|
|
|||||||||||||||||
16 |
|
|
|
|
|
|
|
|
|
|
|
|
|
|
|
|
|
|
|
|
|
|
|
14 |
|
|
|
|
5Y Range |
|
Margin |
|
|
|
16 |
|
|
|
|
5Y Range |
|
Margin |
|
|
|
||
12 |
|
|
|
|
|
|
|
|
|
|
|
|
|
|
|
|
|
|
|
|
|
|
|
|
|
|
|
|
|
|
|
|
|
|
14 |
|
|
|
|
|
|
|
|
|
|
|
|
10 |
|
|
|
|
|
|
|
|
|
|
|
|
|
|
|
|
|
|
|
|
|
|
|
|
|
|
|
|
|
|
|
|
|
|
12 |
|
|
|
|
|
|
|
|
|
|
|
|
8 |
|
|
|
|
|
|
|
|
|
|
|
|
|
|
|
|
|
|
|
|
|
|
|
|
|
|
|
|
|
|
|
|
|
|
10 |
|
|
|
|
|
|
|
|
|
|
|
|
6 |
|
|
|
|
|
|
|
|
|
|
|
|
|
|
|
|
|
|
|
|
|
|
|
|
|
|
|
|
|
|
|
|
|
|
|
|
|
|
|
|
|
|
|
|
|
|
|
4 |
|
|
|
|
|
|
|
|
|
|
|
8 |
|
|
|
|
|
|
|
|
|
|
|
|
|
|
|
|
|
|
|
|
|
|
|
|
|
|
|
|
|
|
|
|
|
|
|
2 |
|
|
|
|
|
|
|
|
|
|
|
6 |
|
|
|
|
|
|
|
|
|
|
|
|
|
|
|
|
|
|
|
|
|
|
|
|
|
|
|
|
|
|
|
|
|
|
|
0 |
|
|
|
|
|
|
|
|
|
|
|
4 |
|
|
|
|
|
|
|
|
|
|
|
-2 |
|
|
|
|
|
|
|
|
|
|
|
2 |
|
|
|
|
|
|
|
|
|
|
|
-4 |
|
|
|
|
|
|
|
|
|
|
|
0 |
February |
March |
April |
May |
June |
July |
August |
September |
October |
|
|
January |
February |
March |
April |
May |
June |
July |
August |
September |
October |
November |
December |
January |
November |
December |
|||||||||
Source: Bloomberg, Thomson Reuters Datastream Source: Bloomberg, Thomson Reuters Datastream
Figure 38: OMV Petrom model refining margin 7-day average, $/bl Figure 39: North-Western Europe LDPE-Naphtha spread, $/t
|
|
|
|
|
5Y range |
|
Margin |
|
|
|
|
|
|
|
|
|
|
|
|
16 |
|
|
|
|
|
|
|
|
|
|
|
1,600 |
|
|
|
|
|
|
|
14 |
|
|
|
|
|
|
|
|
|
|
|
1,400 |
|
|
|
|
|
|
|
|
|
|
|
|
|
|
|
|
|
|
|
|
|
|
|
|
|
|
|
12 |
|
|
|
|
|
|
|
|
|
|
|
1,200 |
|
|
|
|
|
|
|
|
|
|
|
|
|
|
|
|
|
|
|
|
|
|
|
|
|
|
|
10 |
|
|
|
|
|
|
|
|
|
|
|
|
|
|
|
|
|
|
|
8 |
|
|
|
|
|
|
|
|
|
|
|
1,000 |
|
|
|
|
|
|
|
|
|
|
|
|
|
|
|
|
|
|
|
|
|
|
|
|
|
|
|
6 |
|
|
|
|
|
|
|
|
|
|
|
800 |
|
|
|
|
|
|
|
|
|
|
|
|
|
|
|
|
|
|
|
|
|
|
|
|
|
|
|
4 |
|
|
|
|
|
|
|
|
|
|
|
600 |
|
|
|
|
|
|
|
2 |
|
|
|
|
|
|
|
|
|
|
|
400 |
|
|
|
|
|
|
|
|
|
|
|
|
|
|
|
|
|
|
|
|
|
|
|
|
|
|
|
0 |
February |
|
|
May |
June |
July |
|
September |
October |
|
|
200 |
|
|
|
|
|
|
|
January |
March |
April |
August |
November |
December |
|
|
|
|
|
|
|
|||||||
- |
|
|
|
|
|
|
|
||||||||||||
Dec-10 Dec-11 |
Dec-12 |
Dec-13 |
Dec-14 |
Dec-15 |
Dec-16 |
Dec-17 |
Dec- |
||||||||||||
|
|
|
|
|
|
|
|
||||||||||||
Source: Bloomberg, Thomson Reuters Datastream |
Source: Thomson Reuters Datastream |
26

vk.com/id446425943
Gas market outlook
Domestic gas market outlook
Renaissance Capital
14 December 2018
Oil & Gas
We continue to believe the current structure of the Russian domestic gas market is far from the target model and foresee significant changes to the sector landscape, with possible consequences including the industry’s much-awaited deregulation, potential relaxation of export rights and even a possible break-up of Gazprom. We discuss our fundamental outlook for the Russian gas sector in our 28 September 2018 report Gazprom: BUY is not enough. While the current regulatory model is hardly sustainable, in our view, we continue to believe that it is likely to remain unchanged at least until 2020. This is because the Russian government needs Gazprom to complete the build-out of its major new infrastructure projects (including the Power of Siberia pipeline and two Ukraine bypasses), while the independent gas producers jointly have less than a 50% share of the domestic market currently and, hence, deregulation looks premature to us. This will change after
2020, we think, when Gazprom’s market share will move closer to 50% (chiefly because of our expectation that Rosneft’s market share will increase accordingly, Figure 40). Also, the infrastructure build-out will have been completed by then – weakening the argument for keeping Gazprom’s production and pipeline units bundled together – and Rosneft may possibly have succeeded in its push for (partial) liberalisation of gas pipeline export rights.
Within this context, we do not expect radical regulatory changes in 2019 as Gazprom continues its work on the Power of Siberia, Nord Stream II and TurkStream pipelines. We expect Gazprom’s regulated end-user price will increase by 1.4% on 1 July 2019, in line with the Forecast parameters of Russia’s socio-economic development until 2036, released by the Ministry of Economic Development. We forecast there will be no increase in third-party transportation tariffs next year, for the fourth consecutive year, with the current half-measures to rein in inflation continuing until around 2020, when we think the industry can be reformed.
Domestic gas consumption in Russia increased 6.6% YoY in 9M18, according to Gazprom, driven by higher industrial and household consumption despite the slowdown in GDP growth. The recent increase in the pace of Russia’s economic activity, estimated for
10M18, suggests that gas consumption growth is also likely to remain robust through the rest of the 2018, barring weather-related surprises.
A rebound in domestic gas consumption as well as higher gas deliveries to Europe caused a 5.0% YoY increase in Russian gas output in 11M18 to 658.1 bcm. This was led mostly by Gazprom (+24.7bcm or 5.8%, as other Russian gas producers, most notably Rosneft, faced production constraints). In 2019, we forecast Russia’s gas production will increase by 16bcm (or 2.2%) to 749bcm, driven by Yamal LNG (+12bcm) and Rosneft (+4bcm, driven by the launch of its 20bcm pa Rospan project, the key driver of its expected market share gains over 2020-2021), while we forecast Gazprom’s production will increase by 0.8% or 4bcm in 2019 to accommodate for the increase in gas demand in Europe and prepare for the start of gas sales to China.
Figure 40: Domestic market share in end-user gas sales |
|
|
|
Figure 41: Russian gas production 2017-2019E, bcm |
|
|
||||||||
|
|
Gazprom |
Rosneft |
Novatek |
|
650 |
670 |
690 |
710 |
730 |
750 |
|||
100% |
|
|
|
|
|
|
|
|
||||||
|
|
|
|
|
|
|
|
2017 |
|
|
|
|
|
|
|
|
|
|
|
|
|
|
|
|
|
|
|
|
|
80% |
|
|
|
|
|
|
|
|
Gazprom |
|
|
|
|
|
|
|
|
|
|
|
|
|
Rosneft |
|
|
|
|
|
|
|
|
|
|
|
|
|
|
|
|
|
|
|
|
|
60% |
|
|
|
|
|
|
|
|
NOVATEK* |
|
|
|
|
|
|
|
|
|
|
|
|
|
Other |
|
|
|
|
|
|
|
|
|
|
|
|
|
|
|
|
|
|
|
|
|
40% |
|
|
|
|
|
|
|
|
2018E |
|
|
|
|
|
|
|
|
|
|
|
|
|
Gazprom |
|
|
|
|
|
|
|
|
|
|
|
|
|
|
|
|
|
|
|
|
|
20% |
|
|
|
|
|
|
|
|
Rosneft |
|
|
|
|
|
|
|
|
|
|
|
|
|
NOVATEK* |
|
|
|
|
|
|
|
|
|
|
|
|
|
|
|
|
|
|
|
|
|
0% |
|
|
|
|
|
|
|
|
Other |
|
|
|
|
|
|
|
|
|
|
|
|
|
2019E |
|
|
|
|
|
|
2006 |
2008 |
2010 |
2012 |
2014 |
2016 |
2018E |
2020E |
2022E |
|
|
|
|
|
|
|
|
|
|
|
|
|||||||||
*This chart shows 100% of Yamal LNG as NOVATEK.
Source: Company data, Renaissance Capital estimates |
Source: Company data, Renaissance Capital estimates |
27

vk.com/id446425943
Renaissance Capital
14 December 2018
Oil & Gas
European gas market outlook
We detail the European gas balance in Figure 42. A recent recovery in European gas demand has been accompanied by higher-than-previously-expected decline rates in
Europe’s indigenous gas production, with 2017 output of 262bcm – 49bcm, or 16%, below 2010 levels. While 2017 EU gas demand of 569bcm was 43bcm below the 2010 peak, LNG supplies to Europe have declined substantially over this period – helped by higher LNG prices in Asia – with the difference supplied by Gazprom, which saw its share in the European market increase to 34% in 2017 (from 24% in 2010).
Figure 42: European natural gas balance, bcm
|
2006 |
2007 |
2008 |
2009 |
2010 |
2011 |
2012 |
2013 |
2014 |
2015 |
2016 |
2017 |
2018E |
2019E |
2020E |
Total gas consumption in Europe |
593 |
592 |
605 |
569 |
613 |
561 |
552 |
544 |
491 |
509 |
543 |
569 |
570 |
576 |
581 |
Growth, YoY |
-1% |
0% |
2% |
-6% |
8% |
-8% |
-2% |
-2% |
-10% |
4% |
7% |
5% |
0% |
1% |
1% |
Re-exports to Ukraine |
- |
- |
- |
- |
- |
- |
- |
1 |
5 |
11 |
11 |
14 |
12 |
11 |
9 |
Indigenous production (including Norway) |
324 |
312 |
319 |
306 |
311 |
282 |
292 |
279 |
269 |
263 |
264 |
262 |
256 |
251 |
246 |
Algeria, Libya |
36 |
34 |
36 |
31 |
36 |
35 |
35 |
30 |
24 |
24 |
36 |
35 |
33 |
29 |
28 |
Other pipelines (including Azerbaijan) |
20 |
23 |
25 |
22 |
25 |
16 |
20 |
20 |
23 |
23 |
21 |
22 |
20 |
24 |
28 |
Call on Russia/LNG |
214 |
224 |
224 |
209 |
240 |
228 |
206 |
216 |
180 |
209 |
233 |
264 |
273 |
282 |
289 |
LNG (including from North America) |
63 |
59 |
59 |
73 |
87 |
89 |
62 |
50 |
41 |
52 |
47 |
63 |
73 |
80 |
85 |
Russia |
165 |
162 |
164 |
146 |
139 |
154 |
144 |
162 |
147 |
159 |
179 |
194 |
200 |
202 |
204 |
Source: Gazprom, EIA, IHS CERA, Renaissance Capital estimates
Given our assumptions for 1% annual growth in European gas demand, and a steady 2% annual decline in indigenous production, we estimate that Europe’s annual call for Russian gas plus LNG supplies will grow by 42bcm between 2018 and 2023. With no lack of global LNG supplies (the US alone has 60mn tpa of new LNG capacity under construction and a further 470mn tpa under consideration, according to recent estimates presented by Shell), Gazprom will face significant competition, with our estimated full costs of US LNG supplies of c. $8.0/mmbtu and cash costs of c. $5.0/mmbtu (Figure 44). This is likely to mean almost permanent price pressure in European gas markets (more on this below), but with the majority of Gazprom’s European sales now linked to the spot price (YtD average $7.7/mmbtu vs a more attractive $9.7/mmbtu in Asia), we believe its volumes will be largely unaffected, with our forecasts implying gradual growth in Gazprom’s supplies from 200bcm in 2018 to 204bcm in 2020, with LNG imports growing to 85bcm in 2020, from 63bcm in
2017. Our forecasts imply that Gazprom’s European market share will remain stable at around 35%. We note, however, that growing LNG supplies represent an inherent risk to our forecast. In our view, this risk needs to be assessed against other important factors, such as relatively low gas prices in Europe (making LNG deliveries more attractive elsewhere, although this has not been the case in recent weeks) and uncertainty over Chinese gas policy, with its ability to mop up any spare LNG volumes.
The extensive renegotiation of European gas supply contracts during 2010-2015 has come to an end, and while contract prices continue to be adjusted, their structure seems to have stabilised. Gazprom disclosed in February 2018 that its current contract portfolio is equally split between the oil link, spot link and hybrid contracts, where the selling price is, on the one hand, still determined by the oil price link with an average sixto ninemonth lag, but on the other hand needs to fall within a fairly narrow band (such as +/-5%, for example) set by the relevant spot hub. As Gazprom’s sales further include spot trading and reselling volumes, we estimate that spot prices account for c. 80% of Gazprom’s total gas sales in Europe, either as a result of direct gas sales on the spot market, or from having a spot price component in its long-term contracts.
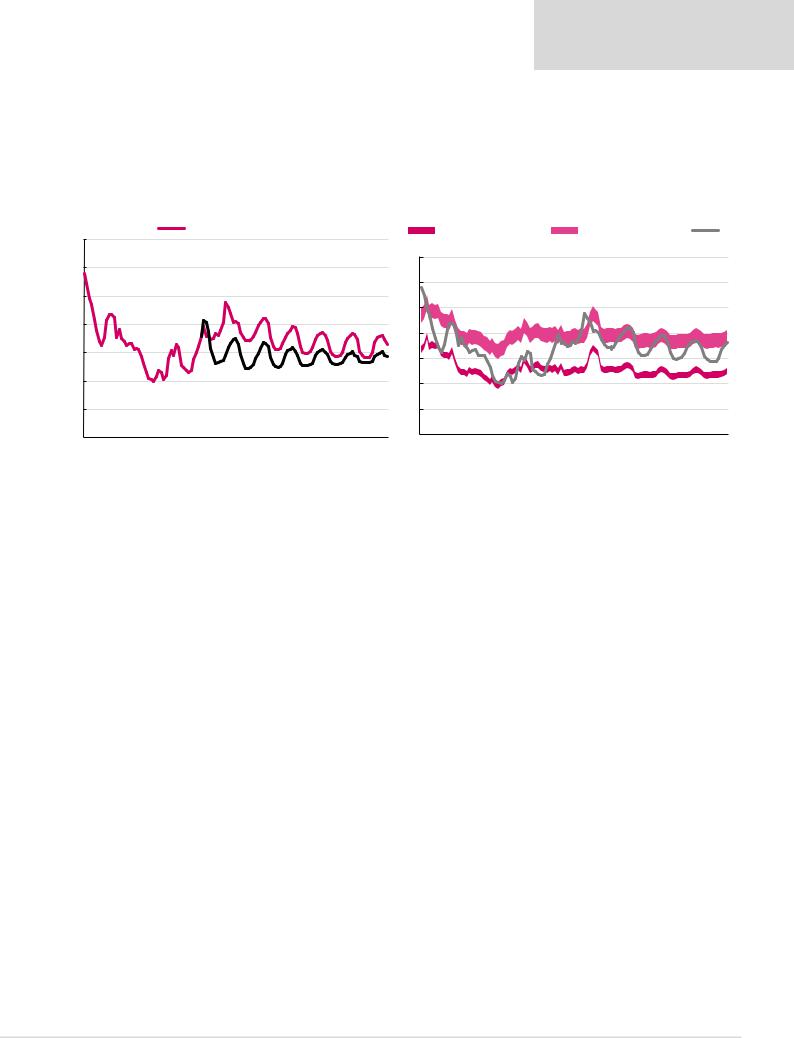
The European gas price outlook has improved significantly compared with 12 months ago (Figure 43). The current spot natural gas price in the UK (NBP) is 32% above the level implied by last year’s forward curve, as shown in Figure 43, driven by low storage levels and reduced indigenous production in Europe. The January 2019 forward price of $8.16/mmbtu is 17% higher than the January 2019 forward price 12 months ago. At the same time, higher oil prices have also pushed the oil-linked part of Gazprom’s realised
28
vk.com/id446425943
Renaissance Capital
14 December 2018
Oil & Gas
price upwards. Our view is therefore that the medium-term spot natural gas price in Europe will fluctuate around $6-7/mmbtu, with higher prices in 2018-2019. Our assumptions continue to imply that, similar to the US market, the correlation between oil prices and the spot natural gas price in Europe will decline. For Gazprom, we estimate an average selling price in Europe of $243/mcm ($6.8/mmbtu) in 2018 and $232/cm ($6.5/mmbtu) in 2019.
Figure 43: Stronger outlook for European gas prices (NBP forward curves now Figure 44: Full costs* of US LNG vs European hub prices ($/mmbtu) and one year ago, $/mmbtu)
Today |
|
One year ago |
|
14
12
10
8
6
4
2
-
2014 |
2015 |
2016 |
2017 |
2018 |
2019 |
2020 |
2021 |
2022 |
2023 |
2024 |
|
Short-term breakeven range |
|
Long-term breakeven range |
NBP |
|||||
14 |
|
|
|
|
|
|
|
|
|
12 |
|
|
|
|
|
|
|
|
|
10 |
|
|
|
|
|
|
|
|
|
8 |
|
|
|
|
|
|
|
|
|
6 |
|
|
|
|
|
|
|
|
|
4 |
|
|
|
|
|
|
|
|
|
2 |
|
|
|
|
|
|
|
|
|
0 |
|
|
|
|
|
|
|
|
|
2014 |
2015 |
2016 |
2017 |
2018 |
2019 |
2020 |
2021 |
2022 |
|
*Based on typical contract price formula, incl. 115% of Henry Hub, $2.4-3.0/mmbtu tolling, shipping ($1.0/mmbtu) and regasification costs ($1.0/mmbtu).
Source: Bloomberg, Renaissance Capital estimates |
Source: Bloomberg, IEA, EIA, Renaissance Capital estimates |
29