


vk.com/id446425943
A year of regulatory change
From a regulatory standpoint, 2019 will see a plethora of regulatory changes in Russia, following a regulatory pause over 2018. Presidential elections held in April 2018, subsequent changes in the composition of the new government, including the appointment of Finance Minister Anton Siluanov as first deputy prime minister, as well as the appointment of Dmitry Kozak as deputy prime minister in charge of the energy sector, led to a series of regulatory initiatives that will culminate in three groups of regulatory changes from 1 January 2019:
1.The commencement of the final phase of the tax manoeuvre with Federal Law No. 301-FZ On amending part two of the Tax Code of the Russian Federation, dated 3 August 2018. Another key part of this regulatory change was the adoption of Federal Law No. 305-FZ On amending article 3.1 of the Custom Law of the Russian Federation, on the same date, which officially established the export duty rates for 2019-2024 and also reviewed the list of exempt oil fields. The parameters of the tax manoeuvre were subsequently adjusted with the adoption of Federal Law No. 424-FZ On amending part two of the Tax Code of the Russian Federation and certain fiscal legislative acts, dated 27 November 2018.
2.The introduction of the excess profits tax regime with Federal Law No. 199FZ On amending parts one and two of the Tax Code of the Russian Federation, dated 19 July 2018. The parameters of the regime were subsequently adjusted with the adoption of the Federal Law No. 424-FZ On amending part two of the Tax Code of the Russian Federation and certain fiscal legislative acts, dated 27 November 2018.
3.A more structured approach to the control of domestic gasoline and diesel prices in Russia. We note that Federal Law No. 305-FZ On amending article 3.1 of the Custom Law of the Russian Federation, mentioned above, has formally enshrined in law the government’s right to impose a prohibitive 90% export duty on petroleum products if the government is not pleased with the absolute level of domestic product prices. The government aims to control domestic prices via a so-called dampening coefficient that will serve to keep the average domestic wholesale oil product price for gasoline and diesel within a 10% range of a targeted level (set as RUB56,000/t for gasoline and RUB50,000/t for diesel in nominal 2019 prices). While talked about throughout most of 2018, the concept was finalised on 27 November 2018 with the adoption of Federal Law No. 424-FZ On amending part two of the Tax Code of the Russian Federation and certain fiscal legislative acts.
We note that the grouping of these changes in the three categories above is rather arbitrary. While they seem to address seemingly unrelated regulatory or fiscal issues, many of the concepts, introduced by the related laws, are intertwined with other regulatory areas both formally (e.g. the dampening mechanism introduced to control retail prices will have a direct mathematical impact on the calculation of the mineral extraction tax [MET]) and informally (as a more strict approach in one regulatory aspect may have been compensated by a softer stance in a seemingly completely unrelated area). Still, we find this grouping useful if not for modelling purposes, but to set a framework for our discussion below.
Regulatory change 1: Final phase of the oil tax manoeuvre
The commencement of the final phase of the tax manoeuvre, which will see a gradual reduction in the export duty on crude and its replacement with a higher MET during 20192024. This process will be accompanied by a necessary suite of other tax changes, required to keep the status quo in relation to existing upstream tax breaks as well as downstream tax incentives (including negative excise tax on crude oil used for domestic refining, effective 1 January 2019). We have analysed the key parameters and effects of the tax manoeuvre here and here, viewing it as broadly neutral for the sector. The parameters of the tax manoeuvre were subsequently adjusted with the adoption of
Renaissance Capital
14 December 2018
Oil & Gas
13

vk.com/id446425943
Federal Law No. 424-FZ On amending part two of the Tax Code of the Russian Federation and certain fiscal legislative acts, dated 27 November 2018, in two specific aspects: amendments to the dampening mechanism and the expansion of the list of refineries subject to a higher logistical coefficient.
The dampening mechanism was introduced to allow the government to control retail petrol prices in Russia. It will be used to increase or reduce the amount of negative excise tax to reduce volatility of end-prices, compensating the oil companies with 60% (in 2019) and 50% (thereafter) of the difference between the export netback and the target price within a 10% range. If the actual netback exceeds the target price, the negative oil excise will increase, reducing the tax burden for the refineries. Conversely, if the actual netback price is below the target price, the size of the negative oil excise will be reduced, thus increasing the tax take for the government at the expense of the customer. Should the positive difference exceed 10% (i.e., actual wholesale prices are more than 10% above the target prices), the dampening mechanism will not apply and we understand the government can revert to more draconian measures, such as the introduction of the prohibitive 90% export duty rate in accordance with the powers given by Federal Law No. 305-FZ On amending article 3.1 of the Custom Law of the Russian Federation. Should the negative difference exceed 10% (i.e., actual prices are less than 10% below the target price), the original version of the law assumed no action, while the 27 November 2018 version has no downside limit for the dampening mechanism, effectively meaning that retail petrol prices in Russia will never be reduced: if the oil price goes down, the government’s tax take will increase via a reduction of the negative excise tax.
Despite its superficial simplicity, the mathematics behind the calculation of the dampening mechanism is quite complex, as the government and the oil companies have each tried to negotiate a favourable outcome for themselves. Therefore there are several balancing coefficients, kickers and compensatory mechanisms, which, among other things, have resulted in an additional coefficient that will be introduced to the calculation of the seemingly unrelated MET. We calculate that this coefficient will kick in if indicative prices are below export netback, and will amount to RUB32/bl ($0.5/bl) or 2% of our estimated average 2019 statutory MET rate, on our estimates. In essence, the rationale behind this approach is to redistribute some of the cost of the damper mechanism from the government to the upstream segment when export prices are too high, relative to the target domestic price level.
The 27 November 2018 changes in the legislation also expanded the geography of the application of the regional (logistical) coefficients, which are supposed to provide additional compensation to geographically disadvantaged refineries in Russia. In particular, a coefficient of 1.1 was introduced for Kemerovo Region and Khanty-Mansiysk Autonomous Region. In our coverage universe, this will affect the smaller refineries of Rosneft (Nizhnevartovsk, Krasnoleninsk) and LUKOIL (Urai), as well as Gazprom’s Surgut ZSK. In total, the changes will generate small additional benefits for both Rosneft and LUKOIL and represent less than 1% of our current 2019 EBITDA estimates for these two companies, respectively. While the introduction of the regional coefficient in Khabarovsk Region was also widely discussed (this would have benefited Rosneft’s Komsomolsk refinery), the government decided against such move on the basis that Russia’s Far East is a premium market. Instead, the government has opted to support the region by increasing the amount of negative excise tax on the production of high-sulphur fuel oil (HSFO) used for marine bunkering (the RUB1,000/t negative excise tax on HSFO will apply to the whole industry from 2022; the government has now favoured the Khabarovsk Region by bringing this tax forward to 2019 and raising the base level by RUB2,100/t for 2019-2021 and RUB1,100/t from 2022, benefiting Rosneft’s Komsomolsk and independent Khabarovsk refineries).
Taking into account the above-mentioned changes to the Russian petroleum industry legislation, as well as our update for the oil price outlook for 2019, we review the impact of the tax manoeuvre on the budget in 2019-2024. We estimate the effect will stand at
Renaissance Capital
14 December 2018
Oil & Gas
14

vk.com/id446425943
Renaissance Capital
14 December 2018
Oil & Gas
RUB1.2trn of revenue for the government, below our previous forecast of RUB1.3trn due to our accounting for the RUB570bn dampening mechanism compensation. This is in line with Deputy Prime Minister Dmitry Kozak’s statement on 21 June 2018 that he estimates the tax manoeuvre will result in an incremental RUB1.3-1.6trn of revenue for the budget during 2019-2024, according to Interfax, depending on the actual oil price. Our model in Figure 18 shows a gradual increase in government revenues as the tax manoeuvre progresses, with the annual net win for the budget levelling out at about RUB360400bnbn ($4-5bn) from 2024 (line 16). We estimate this gain will come from:
▪A RUB13.0trn ($51bn) increase in MET revenue.
▪A RUB5.0trn ($66bn) reduction in crude export duty revenue.
▪A RUB1.0trn ($24bn) reduction in oil products export duty revenue.
▪A RUB5.0trn ($65bn) loss to the budget as a result of the introduction of a negative oil excise to support the Russian refining industry.
Figure 18: Tax revenue scenarios for the Russian budget
|
|
Current tax regime (our published assumptions on 3 July 2018) |
Oil tax manouevre (our current assumptions) |
||||||||||||||
|
|
2016 |
2017 |
2018 |
2019 |
2020 |
2021 |
2022 |
2023 |
2024 |
2019 |
2020 |
2021 |
2022 |
2023 |
2024 |
2025 |
|
Macroeconomic parameters |
|
|
|
|
|
|
|
|
|
|
|
|
|
|
|
|
(1) |
RUB/$ average |
65 |
58 |
61 |
62 |
63 |
63 |
63 |
63 |
63 |
67 |
69 |
71 |
72 |
74 |
76 |
78 |
(2) |
Brent oil price, $/bl |
44 |
54 |
69 |
60 |
60 |
61 |
61 |
62 |
62 |
65 |
60 |
61 |
61 |
62 |
62 |
63 |
(3) |
Urals oil price, $/bl |
42 |
54 |
68 |
59 |
59 |
60 |
60 |
61 |
61 |
64 |
59 |
60 |
60 |
61 |
61 |
62 |
(4) |
Urals oil price less oil-related taxes, $/bl |
19.6 |
22.4 |
24.8 |
22.6 |
22.6 |
22.8 |
22.9 |
23.0 |
23.2 |
23.8 |
22.7 |
22.9 |
23.0 |
23.2 |
23.3 |
23.5 |
(5) |
Gross refining margin |
13.6 |
17.6 |
13.7 |
13.2 |
12.2 |
12.3 |
12.4 |
12.5 |
12.7 |
12.0 |
13.7 |
14.1 |
14.6 |
15.0 |
15.5 |
14.7 |
|
Tax rates, $/bl |
|
|
|
|
|
|
|
|
|
|
|
|
|
|
|
|
(6) |
MET, $/bl |
12.2 |
19.4 |
26.5 |
22.2 |
22.2 |
22.4 |
22.7 |
23.0 |
23.3 |
27.1 |
26.8 |
29.5 |
32.3 |
35.2 |
38.1 |
38.6 |
(7) |
Oil export duty, $/bl |
10.4 |
11.9 |
17.0 |
14.2 |
14.2 |
14.4 |
14.6 |
14.7 |
14.9 |
13.1 |
9.5 |
7.2 |
4.8 |
2.5 |
- |
- |
(8) |
Light oil products export duty, $/bl |
6.3 |
3.6 |
5.1 |
4.3 |
4.3 |
4.3 |
4.4 |
4.4 |
4.5 |
3.9 |
2.8 |
2.2 |
1.5 |
0.7 |
- |
- |
(9) |
Heavy oil products export duty, $/bl |
7.8 |
11.9 |
17.0 |
14.2 |
14.2 |
14.4 |
14.6 |
14.7 |
14.9 |
13.1 |
9.5 |
7.2 |
4.8 |
2.5 |
- |
- |
(10) |
Total marginal tax rate on crude |
54% |
60% |
65% |
63% |
63% |
63% |
63% |
63% |
64% |
64% |
63% |
63% |
63% |
63% |
63% |
63% |
|
Tax revenue for the budget, RUBbn |
|
|
|
|
|
|
|
|
|
|
|
|
|
|
|
|
(11) |
MET |
2,676 |
3,834 |
5,466 |
4,633 |
4,735 |
4,797 |
4,860 |
4,923 |
4,987 |
6,249 |
6,323 |
7,113 |
7,947 |
8,832 |
9,825 |
10,207 |
(12) |
Crude export duty |
1,039 |
1,068 |
1,659 |
1,260 |
1,299 |
1,326 |
1,343 |
1,360 |
1,377 |
1,414 |
1,068 |
835 |
575 |
300 |
- |
- |
(13) |
Oil products export duty |
490 |
336 |
500 |
424 |
434 |
439 |
445 |
450 |
456 |
423 |
317 |
246 |
169 |
88 |
- |
- |
(14) |
Negative oil excise |
- |
- |
- |
- |
- |
- |
- |
- |
- |
(542) |
(509) |
(702) |
(906) |
(1,023) |
(1,273) |
(1,290) |
(15) |
Total |
4,205 |
5,238 |
7,625 |
6,316 |
6,468 |
6,563 |
6,647 |
6,733 |
6,819 |
7,543 |
7,199 |
7,492 |
7,785 |
8,197 |
8,551 |
8,917 |
(16) |
Net win for the budget |
|
|
|
|
|
|
|
|
|
(19) |
134 |
172 |
216 |
323 |
366 |
413 |
Source: Bloomberg, Renaissance Capital estimates
Regulatory change 2: The introduction of the excess profits tax regime
The long-awaited introduction of the excess profits tax (EPT) regime, which will apply to four specified groups of fields, will have a disproportionate positive benefit to greenfieldheavy producers, notably Rosneft and Gazprom Neft, in our view. The introduction of EPT regime will expand the number of Russia’s upstream tax regimes to 20, as shown in
Figure 19. We analysed the parameters and likely effects of the EPT regime in our 11 September 2018 report here. The ensuing three months have brought more changes to the EPT regime (with the adoption of Federal Law No. 424-FZ On amending part two of the Tax Code of the Russian Federation and certain fiscal legislative acts, dated 27 November 2018), as well as caused us to re-assess some of our prior conclusions (as the oil companies can make a choice for applicable fields between keeping them under the legacy tax regime or switching to EPT, our understanding of their future choice is influenced by many different parameters).
The key change introduced by the 27 November 2018 law in relation to the EPT regime was the increase in the level of initial recoverable reserves at the group 4 fields (West Siberian greenfields) from 10mnt to 30mnt per field and from 51mnt to 150mnt, cumulatively. These changes almost doubled the total number of the fields that can apply for the EPT from 11 to 26. In addition, the list of the pilot fields for the West Siberian brownfields (group 3) has increased from 35 to 39, without changing the cumulative production limit of 15mntpa. While
15
vk.com/id446425943
Renaissance Capital
14 December 2018
Oil & Gas
these changes incentivise more development work in West Siberia, they do not have an outright impact on our estimates, as we have based our analysis on the pilot brownfield production quotas attributed to each firm, which have not changed.
Figure 19: Netback ($/bl) for various oil taxation regimes in Russia
|
|
|
|
|
|
|
Netback |
|
Income tax |
|
Mineral Extraction Tax |
|
Export duty |
|
Royalty |
|
Excess profit tax |
|
|
|
|
|
||
|
|
|
|
|
|
|
|
|
|
|
|
|
|
|
|
|
||||||||
|
|
|
|
|
|
|
|
|
|
|
|
|
|
|
|
|
||||||||
60 |
|
|
|
|
|
|
|
|
|
|
|
|
|
- |
|
|
- |
- |
|
|
3 |
2 |
||
|
|
|
|
|
|
|
|
|
|
|
|
|
|
|
|
|
|
|
|
|
|
|
||
|
|
|
|
|
|
8 |
|
|
|
|
|
|
|
|
|
|
|
|
|
|
6 |
|
|
|
|
|
|
|
|
|
|
|
10 |
|
|
|
|
|
|
|
9 |
9 |
9 |
|
|
|
|||
|
|
|
|
|
|
|
|
|
|
|
|
|
|
|
|
|
|
|
|
|||||
|
|
|
|
|
|
|
|
|
|
|
|
|
|
|
|
|
|
|
|
|
|
|
|
|
|
15 |
15 |
15 |
15 |
15 |
|
|
15 |
|
15 |
15 |
14 |
|
|
15 |
|
|
|
11 |
12 |
||||
|
|
|
|
|
|
|
|
|
|
|
|
|
|
|
|
18 |
|
|
|
|
|
|||
50 |
|
|
|
|
|
|
|
|
|
|
|
|
|
20 |
|
|
|
|
|
|
||||
|
|
|
|
|
|
|
|
|
|
|
|
|
|
|
|
|
|
|
11 |
|
|
|||
|
|
|
|
|
|
|
|
|
|
|
|
|
|
|
|
|
|
|
|
|
|
|
|
|
|
|
|
|
|
|
15 |
|
|
|
|
|
|
|
|
|
|
10 |
10 |
10 |
|
|
|
||
|
|
|
|
|
|
|
|
|
|
|
|
|
|
|
|
|
|
|
|
|
|
|
||
|
|
|
|
|
|
|
|
|
|
15 |
|
|
|
9 |
|
|
9 |
|
|
|
|
|
||
40 |
|
|
|
|
|
|
|
|
|
|
|
|
9 |
|
|
|
|
|
|
|
||||
|
|
|
|
|
|
|
15 |
|
12 |
|
|
|
|
|
|
|
|
|
|
|
|
|||
|
|
|
|
|
|
|
|
|
|
|
|
|
|
|
|
|
|
|
|
|
||||
|
|
|
|
|
|
|
|
|
|
|
|
|
|
8 |
|
|
|
|
|
|
|
|||
|
|
|
|
|
18 |
|
|
|
|
|
|
|
|
|
|
|
|
|
|
|
|
|
||
|
|
20 |
20 |
18 |
|
|
|
|
|
|
|
|
8 |
|
|
|
|
|
|
|
|
|
||
|
22 |
|
|
|
|
|
|
|
|
|
|
|
|
|
|
|
|
|
|
|
|
|
||
|
|
|
|
|
8 |
|
|
2 |
|
|
|
7 |
|
|
|
|
|
|
|
|
|
|||
|
|
|
|
|
|
|
|
|
|
7 |
|
|
|
|
|
|
|
|
|
|||||
|
|
|
|
|
|
|
|
|
|
|
|
|
|
|
|
|
|
|
|
|
|
|||
30 |
|
|
|
|
|
|
|
|
|
7 |
7 |
|
|
|
|
|
|
|
|
|
|
|
|
|
|
|
|
|
|
|
|
|
|
|
|
|
|
|
|
|
|
|
|
|
|
|
|
|
|
|
|
|
|
|
|
6 |
6 |
|
|
|
|
|
|
|
|
|
|
|
|
|
|
|
||
|
|
|
|
|
|
|
|
|
|
|
|
|
|
|
|
|
|
|
|
|
|
|
||
|
|
|
|
5 |
6 |
|
|
|
|
|
|
|
|
|
|
|
|
|
|
|
|
|
|
|
|
|
5 |
5 |
|
|
|
|
|
|
|
|
|
|
|
|
|
|
|
|
|
|
|
46 |
|
|
|
|
|
|
|
|
|
|
|
|
|
|
|
|
|
|
|
|
|
43 |
46 |
|||
|
5 |
|
|
|
|
|
|
|
|
|
|
|
|
|
|
|
|
41 |
41 |
41 |
|
|
||
20 |
|
|
|
|
|
|
|
|
|
|
|
|
|
|
|
|
|
|
|
|||||
|
|
|
|
|
|
|
|
|
|
|
|
|
|
|
|
|
|
|
|
|||||
|
|
|
|
|
|
|
|
|
|
|
|
|
|
|
|
34 |
36 |
|
|
|
|
|
||
|
|
|
|
|
|
|
|
|
|
|
|
|
|
32 |
|
|
|
|
|
|
|
|||
|
|
|
|
|
|
|
|
|
|
|
|
|
|
|
|
|
|
|
|
|
|
|
||
|
|
|
|
|
|
|
|
|
|
26 |
27 |
29 |
29 |
|
|
|
|
|
|
|
|
|
||
|
|
|
|
|
|
24 |
25 |
|
|
|
|
|
|
|
|
|
|
|
|
|||||
|
|
|
|
|
22 |
|
|
|
|
|
|
|
|
|
|
|
|
|
|
|
||||
|
|
|
|
22 |
|
|
|
|
|
|
|
|
|
|
|
|
|
|
|
|
|
|||
10 |
|
21 |
21 |
|
|
|
|
|
|
|
|
|
|
|
|
|
|
|
|
|
|
|
||
18 |
|
|
|
|
|
|
|
|
|
|
|
|
|
|
|
|
|
|
|
|
|
|||
|
|
|
|
|
|
|
|
|
|
|
|
|
|
|
|
|
|
|
|
|
|
|
|
|
- |
|
|
|
|
|
|
|
|
|
|
|
|
|
|
|
|
|
|
|
|
|
|
|
|
|
|
|
|
|
|
|
|
|
|
|
|
|
|
|
|
|
|
|
|
|
|
|
|
|
Legacy tax |
Tyumen |
Small |
Samotlor |
Depleted |
EPT Group 3 |
Low |
EPT Group 4 |
Low |
Extra-heavy |
EPT Group 1-2 |
Tyumen |
Azov and Baltic |
Bazhenov, |
system |
suite |
fields |
|
fields |
(West Siberia |
permeability |
(West Siberia |
permeability |
(highly viscous, |
(East Siberia |
suite (IRR < |
seas |
Abalak, |
|
|
|
|
|
brownfields) |
(<2mD), |
greenfields) |
(<2mD), |
200 mPa*s |
greenfields or |
16.3%) |
|
Khadum |
|
|
|
|
|
|
producing |
|
producing |
<viscosity < |
fields specified |
|
|
and |
|
|
|
|
|
|
horizon >10m |
|
horizon |
10,000 mPa*s) |
in the Note to |
|
|
Domanik |
|
|
|
|
|
|
|
|
<10m |
oil |
the Common |
|
|
suites |
|
|
|
|
|
|
|
|
|
|
Customs Tariff |
|
|
|
|
|
|
|
|
|
|
|
|
|
as of |
|
|
|
|
|
|
|
|
|
|
|
|
|
01.01.2018) |
|
|
|
East-Siberia |
Nenets, |
Black (<100m |
Black (>100m |
Kara, North |
Extra viscous |
tax holiday |
Yamal-Nenets |
depth), Pechora, |
depth), North |
Barents, East |
(viscosity > |
|
and |
White, South |
Okhotsk, South |
Arctic seas |
10,000 mPa*s) |
|
Yamal peninsula |
Okhotsk and |
Barents seas |
|
oil |
|
|
Caspian seas |
|
|
|
Source: Renaissance Capital estimates
Federal Law No. 305-FZ On amending article 3.1 of the Custom Law of the Russian Federation, dated 3 August 2018, among other things, has changed export duty exemption allowances for certain oil fields, shown in Figure 20. We believe this change is important as it may swing the balance in the oil companies’ decision of whether to move certain oil fields into the EPT regime from the legacy regime. In particular, we believe the oil companies will want to transfer those relatively new oil fields into EPT where the current applicable exemptions are close to expiry, and the EPT could produce a second wave of tax savings (Gazprom Neft’s Novoport field is the prime example, where we believe its export duty allowance will expire during 2019, prompting its move into EPT).
We have also previously assumed that many of Rosneft’s greenfields, namely Yurubcheno-Takhomskoye, Taas-Yuriakh, Tagul and Suzun, as well as jointly controlled entities – East Messoyakha and Kyumba – could be moved to EPT as they all face expiry of export duty exemptions. Figure 20 shows that the export duty exemptions have now been extended, making the EPT choice less obvious to us. In particular, we no longer assume that East Messoyakha, Kuyumba and Taas-Yuriakh will move under the EPT regime. In addition, if Rosneft’s request for export duty exemptions for the YurubchenoTakhomskoye and Tagul fields is granted, it may become more profitable for Rosneft to keep developing these two fields under the legacy tax regime as well. Incidentally, the law has also increased the expiry of the export duty break for LUKOIL’s Yuri Korchagina field from 2018 to 2022 (this field was never an EPT candidate, as its depletion rate already exceeds 5%).
16
vk.com/id446425943
Renaissance Capital
14 December 2018
Oil & Gas
Figure 20: Changes to export duty break allowances, tonne
|
|
Current law (until end-2018) |
New law (from 1 Jan 2019) |
||
Field |
Company |
Cumulative life-time |
Estimated expiry of |
Cumulative production |
Estimated expiry of |
|
|
production allowance |
the exemption |
from 1 Jan 2019 |
the exemption |
Novoportovskoye |
Gazprom Neft |
19,637,000 |
2019 |
5,766,000 |
2019 |
Vostochno-Messoyahskoye |
Rosneft/Gazprom Neft |
21,296,000 |
2021 |
32,080,000 |
2024 |
Kuyumba |
Rosneft/Gazprom Neft |
28,984,000 |
2024 |
76,433,000 |
2031 |
Srednebotuobinskoye (Taas-Yuriakh) |
Rosneft |
10,750,000 |
2019 |
32,742,000 |
2026 |
Korchagina |
LUKOIL |
8,814,000 |
2018 |
4,011,000 |
2022 |
Vostochno-Alinskoye |
Surgutneftegas |
2,369,000 |
na |
2,865,000 |
na |
Yuzhno-Talakanskoye |
Surgutneftegas |
1,627,000 |
na |
2,538,000 |
na |
Zapadno-Ayanskoye |
Irkutsk Oil Company |
4,308,000 |
* |
7,402,000 |
* |
Danilovskoye |
Irkutsk Oil Company |
12,378,000 |
* |
12,491,000 |
* |
Ichedinskoye |
Irkutsk Oil Company |
10,982,000 |
* |
10,469,000 |
* |
Markovskoye |
Irkutsk Oil Company |
851,000 |
* |
889,000 |
* |
Dulisminskoye |
Dulisma (operated by RusOil) |
11,952,000 |
* |
10,364,000 |
* |
Kolvinskoye |
Independent Oil Company (NNK) |
3,569,000 |
* |
18,524,000 |
* |
Krasnoleninskoye |
Ruspetro |
9,944,000 |
* |
30,606,000 |
* |
West Khosedayuskoye |
RusVietPetro |
2,177,000 |
* |
366,000 |
* |
* These companies are not covered by Renaissance Capital.
Source: Russian Government, Renaissance Capital research
Considering our new forecasts, we calculate that the introduction of the EPT regime will create an additional tax benefit of RUB125bn in 2022 (10% of the sector’s tax take, down from our previous estimate of RUB171bn in 2022, as we now expect fewer fields will be opted in), with a disproportionate positive benefit for Gazprom Neft (RUB35bn or 24%) and Rosneft (RUB82bn or 15%). As previously calculated, we believe most of this gain will come from East Siberian greenfields (groups 1 and 2), although we estimate an approximately RUB19bn benefit from West Siberian brownfields (group 3) as well.
Regulatory change 3: A more structured approach to the control of domestic gasoline and diesel prices in Russia
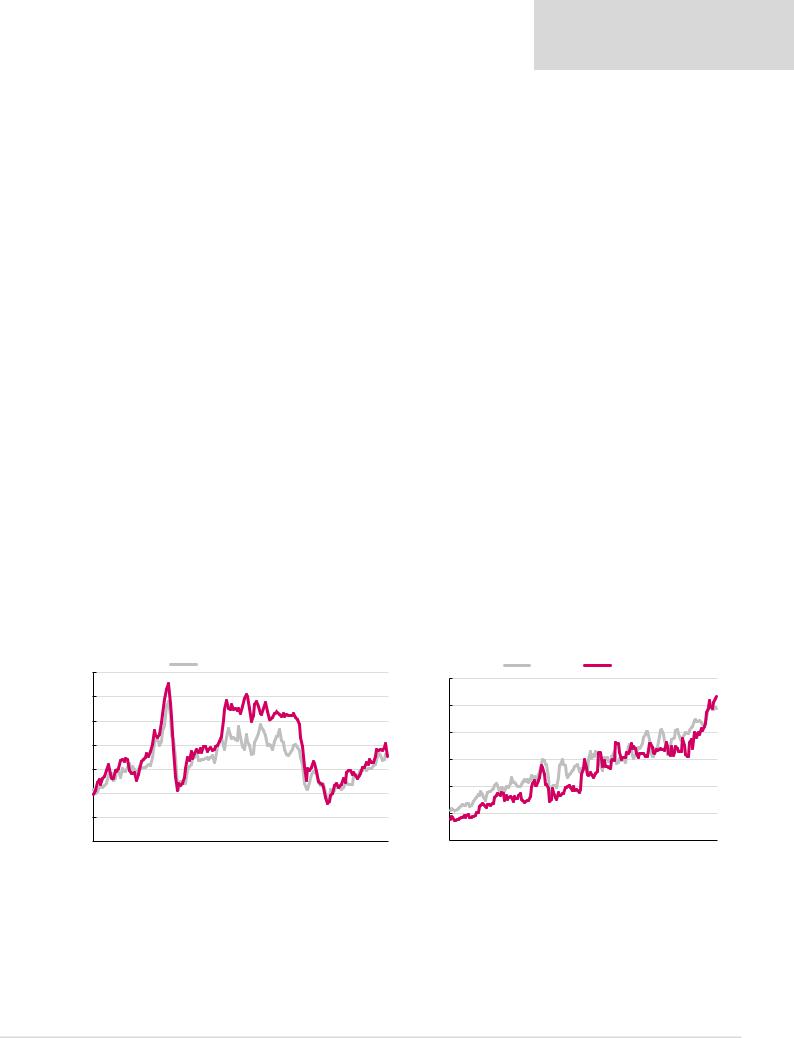
With no physical barriers to exports, the domestic oil product market is clearly very lucrative. As evidenced by Figure 21, domestic refined product prices have unquestionably mirrored dynamics in global crude and product markets when measured in dollars and netted of domestic excise tax and VAT. However, when measured in roubles and fully-taxed, wholesale gasoline and diesel prices have seen only one trend – upwards (Figure 22).
Figure 21: Domestic vs export product basket values, $/bl, net of VAT and excise |
Figure 22: Domestic gasoline and diesel prices ex-refinery gate fully taxed RUB/t |
|||
140 |
Domesic product basket |
|
Gasoline |
Diesel |
|
60,000 |
|
|
|
|
|
|
|
|
120 |
|
50,000 |
|
|
|
|
|
|
|
100 |
|
|
|
|
|
|
40,000 |
|
|
80 |
|
|
|
|
60 |
|
30,000 |
|
|
|
|
|
|
|
40 |
|
20,000 |
|
|
|
|
|
|
|
20 |
|
10,000 |
|
|
|
|
|
|
|
0 |
|
- |
|
|
Jan-05 Jul-06 Jan-08 Jul-09 Jan-11 Jul-12 Jan-14 Jul-15 Jan-17 Jul-18 |
Jan-03 Nov-04 Sep-06 |
Jul-08 May-10 Mar-12 Jan-14 Nov-15 Sep-17 |
||
|
Source: InfoTEK, SPIMEX, Renaissance Capital |
|
|
Source: InfoTEK |
Russia’s integrated oils face significant economic barriers (in the form of export duties and transportation costs) in displacing excess products (diesel and fuel oil, mainly) from the domestic market, although these continue to be compensated for, currently, by the reduced level of export duty vs crude. There is also, from time to time, significant political pressure to rein in product prices, and this has certainly featured significantly in recent times, explaining temporary price setbacks domestically.
17
vk.com/id446425943
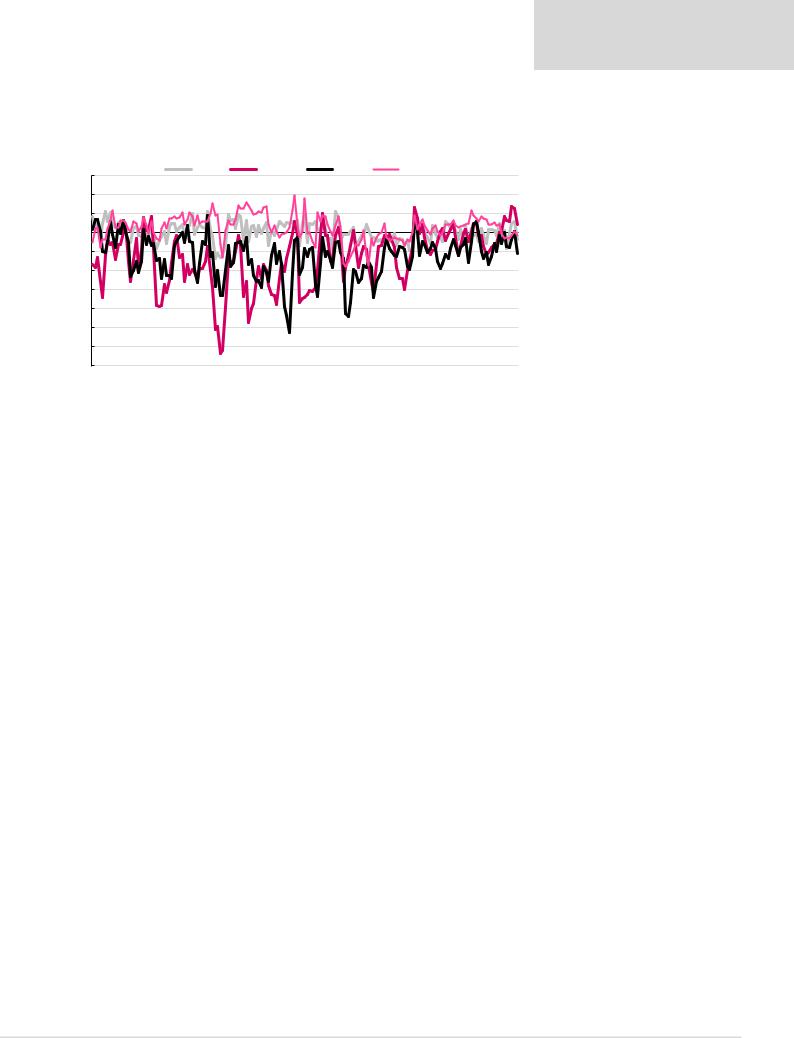
Figure 23 shows export margins for the three principal refined products compared with crude oil. These subtract from Mediterranean prices the high cost of displacing products and the export duties levied on the way out.
Figure 23: Crude and refined product export margins, $/bl
30 |
|
|
|
|
|
|
Crude |
|
|
Gasoline |
|
|
Diesel |
|
|
Fuel oil |
|
|
|
|
|
|
|
|
|
|
|
|
|
|
|
|
|
|
|
|
|
|
|
|
|
|
|
20 |
|
|
|
|
|
|
|
|
|
|
|
|
|
|
|
|
|
|
|
|
|
10 |
|
|
|
|
|
|
|
|
|
|
|
|
|
|
|
|
|
|
|
|
|
0 |
|
|
|
|
|
|
|
|
|
|
|
|
|
|
|
|
|
|
|
|
|
(10) |
|
|
|
|
|
|
|
|
|
|
|
|
|
|
|
|
|
|
|
|
|
(20) |
|
|
|
|
|
|
|
|
|
|
|
|
|
|
|
|
|
|
|
|
|
(30) |
|
|
|
|
|
|
|
|
|
|
|
|
|
|
|
|
|
|
|
|
|
(40) |
|
|
|
|
|
|
|
|
|
|
|
|
|
|
|
|
|
|
|
|
|
(50) |
|
|
|
|
|
|
|
|
|
|
|
|
|
|
|
|
|
|
|
|
|
(60) |
|
|
|
|
|
|
|
|
|
|
|
|
|
|
|
|
|
|
|
|
|
(70) |
|
|
|
|
|
|
|
|
|
|
|
|
|
|
|
|
|
|
|
|
|
Jan-05 |
Jul-05 |
Jan-06 |
Jul-06 |
Jan-07 |
Jul-07 |
Jan-08 |
Jul-08 Jan-09 |
Jul-09 |
Jan-10 |
Jul-10 Jan-11 Jul-11 |
Jan-12 |
Jul-12 |
Jan-13 Jul-13 |
Jan-14 |
Jul-14 |
Jan-15 Jul-15 Jan-16 |
Jul-16 |
Jan-17 |
Jul-17 |
Jan-18 |
Jul-18 |
Note: West Mediterranean quotes.
Netback calculated after cif-to-fob adjustment, export duty, and typical transportation costs from Perm to Novorossiysk for gasoline and diesel and from Nizhny Novgorod to St Petersburg for fuel oil.
Source: Bloomberg, InfoTEK, Renaissance Capital
These margins (with some exception for fuel oil) were mostly negative in 2016 and 2017, indicating that the domestic sales channel for light products was generally more profitable than the export channel, although arguably the premium has shrunk in recent years. The situation has changed from December 2017, when the export margin for gasoline turned positive in the midst of growing government concerns over domestic prices. The situation exacerbated during the course of the year, with October 2018 seeing positive export margins for all three key refining products as well as crude oil for the first time since February 2015. So far in 2018 YtD, the average discount for the domestic gasoline price over the export netback was $2.8/bl (vs an average premium of $2.7/bl in 2017). There is less pressure on the domestic diesel price, which is a less socially-sensitive product, with the average domestic premium of $5.9/bl in 2018 YtD declining marginally from $6.6/bl in 2017. Some oversupply in fuel oil continues, but this has become a less pressing issue with recent refinery upgrades. Low domestic demand and the generally reduced availability of the product (Russia is the world’s largest exporter of fuel oil, with its export volumes down by 15% in 2017 and another 10% in 10M18) helped to maintain a positive export margin of $6.3/bl in 2017, which declined to just $0.5/bl in 11M18.
From the beginning of 2011, the government began applying pressures on domestic product prices. 2011-2012 saw the value of the domestic product basket diverge significantly from the export basket value, though trends were then largely parallel until 2014 (as shown in Figure 21). Since that time, the reduction in international oil and product prices, combined with upgrades of Russian refining capacities and the associated start of the first tax manoeuvre, has helped the domestic product basket to again equalise with its export value.
Late 2017 and 2018 saw the Russian government’s obsession over petrol prices grow, first in the run-up to the April 2018 presidential elections, and later in the face of growing oil prices and higher domestic taxes, which saw wholesale gasoline and diesel prices increase by 14% and 31% YtD, respectively. The government has tried to encourage oil companies to comply with voluntary price restrictions, with deputy prime minister Kozak suggesting that “altruism” was required, but this is an approach that is not compatible with the free market concept. Traders were immediately accused of re-exporting oil products that could be bought cheaply domestically, leading to shortages being reported in certain
Renaissance Capital
14 December 2018
Oil & Gas
18

vk.com/id446425943
Russian regions; the oil companies themselves found other ways of increasing effective prices, such as through the reduction of previously offered discounts or even the introduction of special service charges. The government has threatened to respond with a prohibitive export duty on oil products, which is still a risk. However, we understand the government’s preferred approach is via a balancing coefficient in the negative oil excise formula, which will act to counter-balance oil price and exchange rate movements to keep domestic product prices within a desired range.
The agreement between the government and Russia’s vertically integrated oil companies on 7-12 November outlined the new indexation-based model for Russia’s domestic petrol prices, targeting a 1.7% hike to the target price level from 1 January 2019 to compensate for the increase in VAT to 20% (from 18%), followed by inflation-based indexation from 1 February 2019. As stated earlier, 60% (in 2019) and 50% (thereafter) of the difference between the actual export netback and the target price within a 10% range will be compensated by the budget through the dampening coefficient applied to the negative oil excise tax mechanism.
In addition, Federal Law No. 424-FZ On amending part two of the Tax Code of the Russian Federation and certain fiscal legislative acts, dated 27 November 2018, has created a new mechanism for the government to introduce prohibitive export duty rates on petroleum products in the event of domestic price shocks. We currently do not anticipate that this measure will be implemented, but it will act as a deterrent against unexpected domestic petrol price hikes by Russian oil producers. According to the new mechanism, the government will monitor domestic product prices on a rolling three-month basis. If price hikes exceed 15% over this period, the government will have the power to increase the marginal crude oil export duty up to 45% (if the Urals price is above $25/bl), from 30% currently, and simultaneously increase the marginal export duty on gasoline and diesel to 60%, from 30% currently, for a duration of up to six months. In such an event, the marginal export duty rate on gasoline and diesel will approach 90% of the initial marginal export duty rate on crude oil, resulting in lower crude oil and oil products export netbacks, thereby reducing the incentive to export.
To support independent retail fuel stations, the government has also introduced a binding condition for the vertically-integrated oil companies to sell a minimum share of 10% and 5% of their total gasoline and diesel production, respectively, on the domestic commodity exchange, or else risk losing their negative oil excise allowance.
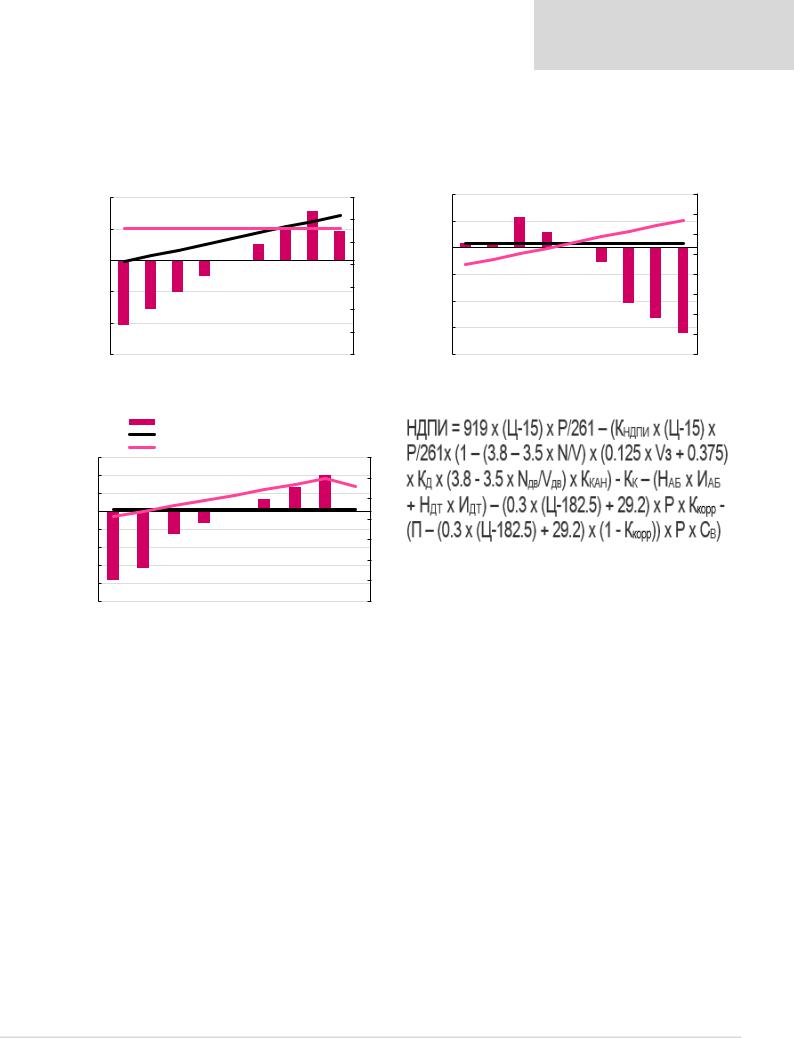
Figures 24-26 illustrate the effect of the government’s approach to price regulation through the use of the dampening mechanism and prohibitive export duties:
▪Figure 24 shows the sensitivity of an oil company’s EBITDA to changes in the domestic wholesale price (for example, as international oil prices fluctuate but the Russian government keeps the domestic indicative price unchanged). In such an event, the oil companies will have a normal downside risk, but a limited upside risk as the government should introduce a prohibitive export duty if the domestic wholesale price exceeds the indicative price by more than 10%.
▪Figure 25 shows the sensitivity of an oil company’s EBITDA to changes in the indicative price. Other things being equal, the government may want to raise the indicative price to increase its tax receipts (via a reduction in the negative excise tax it pays to the refiners). This would be an example of using retail price regulation for the government’s fiscal benefit. On the other hand, should the refining industry become unprofitable, the government may decide to lower the indicative price to support the industry through a lower tax take.
▪Finally, Figure 26 shows the sensitivity of an oil company’s EBITDA to changes in export netbacks. Assuming the oil companies keep domestic wholesale prices flat to please the government, they will receive compensatory payment via the dampening mechanism if export netbacks rise (although only up to a certain limit).
Renaissance Capital
14 December 2018
Oil & Gas
19
vk.com/id446425943
Renaissance Capital
14 December 2018
Oil & Gas
Should export netbacks fall, the oil companies’ profitability will fall as the tax take will increase at the expense of the customer (as in such an example the domestic price remains high, despite a decline in international netbacks).
Figure 24: Sensitivity of EBITDA to wholesale gasoline price |
Figure 25: Sensitivity of EBITDA to indicative price |
|
||||||||
|
|
Change in EBITDA, RUB/t |
|
Average wholesale price, RUB/t |
|
|
Change in EBITDA, RUB/t |
|
|
Average wholesale price, RUB/t |
|
|
|
|
|
|
|||||
|
|
Indicative price, RUB/t |
|
|
|
|
Indicative price, RUB/t |
|
||
|
|
|
|
|
|
|
||||
10,000 |
|
|
|
|
|
|
|
70,000 |
6,000 |
|
|
|
|
|
|
|
|
||
5,000 |
|
|
|
|
|
|
|
60,000 |
3,000 |
|
|
|
|
|
|
|
|
|
|
|
|
|
|
|
|
|
|
50,000 |
- |
|
|
|
|
|
|
|
|
|
|
- |
|
|
|
|
|
|
|
40,000 |
|
|
|
|
|
|
|
|
|
(3,000) |
|
|
|
|
|
|
|
|
|
|
|
(5,000) |
|
|
|
|
|
|
|
30,000 |
|
|
|
|
|
|
|
|
|
(6,000) |
|
|
|
|
|
|
|
|
|
20,000 |
|
|
|
|
|
|
|
|
|
|
|
(10,000) |
|
|
|
|
|
|
|
10,000 |
(9,000) |
|
|
|
|
|
|
|
|
||
|
|
|
|
|
|
|
|
|
|
(15,000) |
|
|
|
|
|
|
|
- |
(12,000) |
-20% |
-15% |
-10% |
-5% |
0% |
5% |
10% |
15% |
20% |
|
|
|
|
|
|
|
|
|
80,000 |
|
|
|
|
|
|
|
|
70,000 |
|
|
|
|
|
|
|
|
60,000 |
|
|
|
|
|
|
|
|
50,000 |
|
|
|
|
|
|
|
|
40,000 |
|
|
|
|
|
|
|
|
30,000 |
|
|
|
|
|
|
|
|
20,000 |
|
|
|
|
|
|
|
|
10,000 |
|
|
|
|
|
|
|
|
- |
-20% |
-15% |
-10% |
-5% |
0% |
5% |
10% |
15% |
20% |
Source: Renaissance Capital estimates |
Source: Renaissance Capital estimates |
Figure 26: Sensitivity of EBITDA to a change in export netback |
|
Figure 27: MET formula from 1 January 2019 |
|
||||||
|
|
Change in EBITDA, $/t |
|
|
|
|
|
||
|
|
Average ex-gate price (net of VAT, excise), $/t |
|
|
|||||
|
|
Gasoline netback price, /t |
|
|
|
|
|
||
60 |
|
|
|
|
|
|
|
700 |
|
40 |
|
|
|
|
|
|
|
600 |
|
|
|
|
|
|
|
|
|
|
|
20 |
|
|
|
|
|
|
|
500 |
|
|
|
|
|
|
|
|
|
|
|
- |
|
|
|
|
|
|
|
400 |
|
|
|
|
|
|
|
|
|
|
|
(20) |
|
|
|
|
|
|
|
|
|
(40) |
|
|
|
|
|
|
|
300 |
|
|
|
|
|
|
|
|
|
|
|
(60) |
|
|
|
|
|
|
|
200 |
Source: Russian government |
|
|
|
|
|
|
|
|
|
|
(80) |
|
|
|
|
|
|
|
100 |
|
|
|
|
|
|
|
|
|
|
|
(100) |
|
|
|
|
|
|
|
0 |
|
-20% |
-15% |
-10% |
-5% |
0% |
5% |
10% |
15% |
20% |
|
|
|
|
|
|
|
Source: Renaissance Capital estimates |
|
||
It is not a surprise to us that following the increasing regulatory complexity of the Russian downstream sector, the pace of the refinery modernisation programme has slowed significantly. We estimate that the companies under our coverage will have spent $4.7bn on downstream capex in 2018, down 7% YoY, and that this will decline by a further 9% in 2019. Among the major refiners, only Tatneft and Surgutneftegas have finished substantial projects in 2018 and thus have seen an improvement in their Nelson Complexity Index (NCI); while Rosneft’s complexity is still below that of the peer group. It stands to reason, therefore, that Rosneft also has the most ambitious modernisation programme left to complete, although we believe the completion of the tax manoeuvre has reduced the company’s appetite for downstream investments. We therefore believe upgrade activity in the sector will be limited only to the completion of already existing projects – with the exception of LUKOIL, where construction of a new delayed coker at its Nizhny Novgorod refinery was recently approved.
Rosneft has the most extensive refining modernisation program in Russia, which includes the construction of nine hydrotreatment units, one catalytic cracking, one reforming, five hydrocracking, two alkylation and three coking units at its refineries, followed by Tatneft’s modernisation of TANEKO, which is actually a construction of the refinery from scratch. We note that most of the other future refining modernisation projects have shifted their focus from the construction of treatment to conversion capacities, as well as renovation of existing units.
20
vk.com/id446425943
Renaissance Capital
14 December 2018
Oil & Gas
Gazprom Neft is continuing with its Phase-II modernisation programme, which includes the launch of the “Euro+” units at its Moscow refinery, replacing the outdated units with the new ones, in 2019 and the construction of conversion units at both the Moscow and Omsk refineries in 2020-2022, while LUKOIL is planning to launch its delayed coker unit at Norsi in 2021. As Surgutneftegas and Slavneft (not listed) completed their major upgrade projects in 2017-2018 and TAIF (not listed) is expecting to launch its Heavy Residue Conversion Complex in 2019, they have not announced any new projects in the downstream segment.
Tatneft is continuing with the modernisation of the TANECO refinery. The company plans to launch the reforming unit, which will allow it to commence production of Euro-5 gasolines from its gasoline production line, in 2019, as well as to finish mechanical completion of the new AVCDU-6 and vacuum block of the visbreaker unit. Subsequent additions to secondary capacity include the heavy gasoil (HGO) hydrotreatment and pilot hydroconversion units in 2019 and a catalytic cracker in 2020. Post 2020, Tatneft is planning to construct an aromatics production complex, a middle distillate unit and a naphtha hydrotreating unit, alkylation, hydrogen and MTBE units, a VGO hydrocracker and a full-scale hydroconversion unit. Following the modernisation, the company expects TANECO to almost double its current capacity to 15.3mn tpa, while maintaining the current quality of its refining parameters, with the targeted light product yield at 89% and the conversion rate at 99%. We summarise the ongoing modernisation projects in Figure 28.
Figure 28: Russian refineries – major upgrade projects
Company |
Recent activities (2013-2018) |
Further modernisation plans |
|
Rosneft |
|
|
|
Angarsk |
Constructed an isomerisation unit in 2010. Renovated the catalytic reformer |
Construction of gasoline (0.5mn tpa) and gasoil (4mn tpa) hydrotreatment and |
|
unit in 2011, launched an MTBE unit (0.128mn tpa) in 2015. |
alkylation (0.13mn tpa) units. |
||
|
Syzran |
Renovated the catalytic reformer unit (0.6mn tpa) and constructed an |
|
isomerisation unit in 2011. |
||
|
Construction of catalytic cracking (1.1mn tpa), hydrotreatment (2.5mn tpa), MTBE (0.04mn tpa) and alkylation (0.158mn tpa) units.
|
Isomerisation unit (0.28mn tpa) was launched in 2014. The 1.15mn tpa |
|
Kuibyshev |
catalytic cracking unit and MTBE facilities (0.04mn tpa) were finished in |
Hydrotreating and alkylation units are planned for construction. |
|
2016. Reconstruction of the catalytic reforming unit. |
|
Komsomolsk |
Renovation of the catalytic reformer unit in 2011-2012 and launch of the |
|
delayed coking unit in 2011. |
||
|
New hydrocracker (2mn tpa) and gasoil hydrotreatment (1.6mn tpa) units.
Novo- |
Launched reforming (1.2mn tpa) and isomerisation capacities (0.28mn tpa) in |
Construction of a hydrocracking unit (2mn tpa) and gasoil hydrotreatment unit |
|
(2.75mn tpa). Reconstruction of the delayed coking unit to increase capacity up to |
|||
Kuibyshev |
2015. Reconstruction of the isomerisation unit. |
||
1.5mnt pa. A new atmospheric-vacuum distillation unit (2mn tpa) is planned. |
|||
|
|
Achinsk |
Reconstruction works on the gasification unit to repair the damage from |
|
technological explosion. Renovation of the hydrotreating unit in 2011. |
||
|
New delayed coking (3mn tpa) and hydrocracking-hydrotreating (3.6mn tpa) units, as well as construction of the vacuum block.
Tuapse |
Replaced the distillation capacities with a new unit in 2013, including a |
Construction of flexi-coking (2.8mn tpa), hydrocracking (4mn tpa), hydrotreating |
|
naphtha hydrotreating section. |
(4.23mn tpa), reforming (1.5mn tpa) and isomerisation (0.8mn tpa) units in 2017-2020. |
||
|
Ryazan |
Isomerisation unit of 0.8mn tpa built in 2014. Reconstruction of the |
|
hydrotreatment unit (2mn tpa). Vacuum distillation block installed in 2015. |
||
|
Construction of hydrocracker (2.2mn tpa) in 2023. MTBE unit is scheduled. Studying the feasibility of constructing a new atmospheric-vacuum distillation unit (5mn tpa).
|
Reconstruction of visbreaking unit after a fire. Reconstruction of the 2.2mn |
Construction of hydroconversion unit in 2024. Expansion of main vacuum and |
|
Saratov |
tpa gasoil hydrotreatment units in two phases. Isomerisation unit (0.3mn tpa) |
visbreaking capacities as well as reconstruction of the bitumen unit are scheduled |
|
|
launched in 2013. The primary distillation capacity renovated and increased. |
up to 2023. |
|
Nizhevartovsk |
na |
na |
|
LUKOIL |
|
|
|
|
Expansion of the total vacuum distillation capacity. Construction of the |
Construction of a isomerisation unit (0.44mn tpa) scheduled for 2020. Delayed |
|
Norsi |
second catalytic cracker (2mn tpa), gasoline hydrotreater (1.1mn tpa) and |
coking unit (2.1mn tpa) is scheduled for 2021. New gasoline production units is |
|
|
alkylation unit (0.3mn tpa) in 2015. |
planned. |
|
|
Renovation of the diesel hydrotreating unit (1.8mn tpa). The delayed coking |
|
|
Perm |
unit capacity expanded up to 1mn tpa. Construction of the heavy residuals |
Modernisation of AV distillation units. Modernisation of the refinery’s control |
|
refining plant was finished in 2015, including the delayed coking unit of 2.1mnsystems. |
|||
|
|||
|
tpa and hydrotreatment unit of 1.5mn tpa. |
|
|
|
The refining capacity was expanded, with the introduction of the new 6mn tpa |
|
|
Volgograd |
distillation unit, up to 15.7mn tpa. In 2016, the VGO conversion plant was |
na |
|
|
constructed, including the hydrocracking unit of 3.5mn tpa. |
|
|
Ukhta |
Reconstruction of the hydrotreatment (2mn tpa) was completed. |
na |
|
SurgutNG |
|
|
|
|
Construction of the hydrotreating unit (2mn tpa) in 2012-2013 and the Deep |
|
|
|
Refining Complex. Reconstruction of the hydrotreatment capacities in 2015- |
|
|
Kirishi |
2016. Launch in 2018 of the LK-2B high-octane gasoline production complex, |
na |
|
|
including isomerisation (1.1mn tpa) and reforming (1.2mn tpa) units and |
|
|
|
hydrotreatment block (2.3mn tpa). |
|
|
Source: Company data, Renaissance Capital
21

vk.com/id446425943
Renaissance Capital
14 December 2018
Oil & Gas
Figure 28: Russian refineries – major upgrade projects (continued)
Company |
Recent activities (2013-2018) |
Further modernisation plans |
Bashneft |
|
|
Ufaneftekhim
Ufa
Novo-Ufa
Upgrade of the hydrocracking unit (capacity increased by 0.6mn tpa).
Construction of a hydrotreating unit of 1.3mn tpa in 2014.
Construction of alkylation (0.448mn tpa) and hydrogen production (0.153mn tpa) units.
Construction of a hydro-aromatisation unit and new sulphur capacities. Reconstruction of distillation and renovation of hydrocracker units. Reconstruction of the aromatics complex.
Construction of the delayed coking unit (2mn tpa) and new sulphur capacities. Reconstruction of the distillation units.
Reconstruction of the distillation units. The expansion of the hydrocracker unit was cancelled.
Gazprom Neft
|
|
Replace part of the primary distillation capacity with 8.4mn tpa of crude and 1.2mn |
|
Omsk |
Reconstruction of the primary distillation capacities and catalytic cracking |
tpa condensate in 2019. Construction of the delayed coker (2mn tpa) unit and Deep |
|
units. Hydrogen production unit launched in 2018. |
Oil Refining Complex including hydrocracker (2mn tpa), as well as substitution of |
||
|
|||
|
|
the diesel hydrotreatment unit (2.5mn tpa) in 2020. |
Construction of additional isomerisation (0.65mn tpa) and gasoline Moscow hydrotreatment (1.2mn tpa) units. Reconstruction of the gasoil
hydrotreatment unit (2mn tpa).
Construction of "Euro+" refining complex including 6mn tpa of AV-distillation, 1mn tpa of catalytic reforming and 2mn tpa of diesel hydrotreating capacity to replace outdated capacities. Reconstruction of the catalytic cracker unit up to total capacity of 2.4mn tpa. Reconstruction of the primary distillation capacities. Construction of the Deep Oil Refining Complex in 2022.
Slavneft
|
Construction of a diesel hydrotreating unit (1.6mn tpa), modernisation of the |
|
|
YaroslavNOS |
alkylation unit. Reconstruction of the catalytic cracking and MTBE units. |
Construction of the Deep Refining Complex, including a delayed coker unit in 2024. |
|
|
Installation of the Group-III quality base oils production unit of 0.1mn tpa. |
|
|
TAIF |
|
|
|
Nizhnekamsk |
Reconstruction of the hydrotreating unit. |
Mechanical completion of the Heavy Residue Conversion Complex (3.7mn tpa), |
|
including hydrocracking section, in 2018 and commercial launch in 2019. |
|||
|
|
Tatneft
Construction of the delayed coking unit (2mn tpa), hydrocracker (2.9mn tpa), hydrogen (0.1mn tpa) and high-index oils (0.25mn tpa) units. Isomerisation
TANEKO (0.42mn tpa) and naphtha hydrotreating (1.1mn tpa) units launched in January 2018, followed by diesel (1.6mn tpa) and kerosene (0.5mn tpa) HDTs in July 2018. Upgrade of the primary distillation capacities in 2013.
Expansion of the primary distillation capacity by 6mn tpa. Construction of catalytic reforming unit (0.714mn tpa) and addition of the vacuum block to the visbreaking unit in 2018, vacuum gasoil hydrotreater (0.85mn tpa) in 2019, catalytic cracker (1.1mn tpa) in 2020, aromatics production line (0.714mn tpa), middle distillates HDT (3.7mn tpa), alkylation, hydrogen and MTBE units in 2021-2022. A new hydrocracking unit is scheduled for 2026 (1.2mn tpa). A test hydroconversion unit is scheduled for a pilot run (0.1mnt pa) in 2019, to be constructed at full scale (2mnt pa) in 2026.
NNK
Upgrade of the primary distillation unit up to 5mn tpa of annual capacity.
Khabarovsk Construction of the visbreaking unit (0.75mn tpa), hydrocracker (0.5mn tpa) and Expansion of the primary distillation capacity by 1mn tpa. gasoil hydrotreater (1.2mn tpa). Reconstruction of catalytic reformer unit in 2013.
Source: Company data, Renaissance Capital
Who’s the fairest of them all?
The changes discussed above make Russia’s oil industry regulation increasingly complex. While we see a sound mathematical logic behind the calculation of various new coefficients, kickers, balancing and counter-balancing mechanisms, we believe the end result brings overcomplexity that will reduce regulatory transparency and compliance (the MET formula now includes 30 parameters, Figure 27, not to mention 19 different tax exemptions) and reduce competition as the government continues to attempt to ‘link the unlinkable’. In the case of the tax manoeuvre, the new laws are written in such a way that the profitability of the upstream sector is now affected by the downstream margin. A new investor developing an oil field in West Siberia may find its MET rate go up because Russian refiners are demanding compensation for keeping retail petrol prices low. Domestic retail price controls are now effectively in place, with any deviation from target levels either severely punished by the government (if prices are too high) or used to prop up tax revenue for the budget (if prices are too low). This approach mirrors the 2013 decision to link gas transportation tariffs to gas MET rates (i.e. combining what should be separate fiscal and regulatory decisions in one law), which has brought nothing but limbo and stalemate to the now all-but-forgotten reform of the Russian gas sector. Market reality will bring new challenges, and we can expect the formulas will continue to evolve. Will we see 30 parameters becoming 40 or 60? The oil companies, the government, the tax inspectorate and consultants will hire more people to navigate through these complexities, and a whole new breed of bureaucrats will likely emerge to keep the new system going until – we think – it is inevitably simplified. Deputy prime minister Kozak has already said that the government will take stock of existing tax exemptions in 2019.
22
vk.com/id446425943
Renaissance Capital
14 December 2018
Oil & Gas
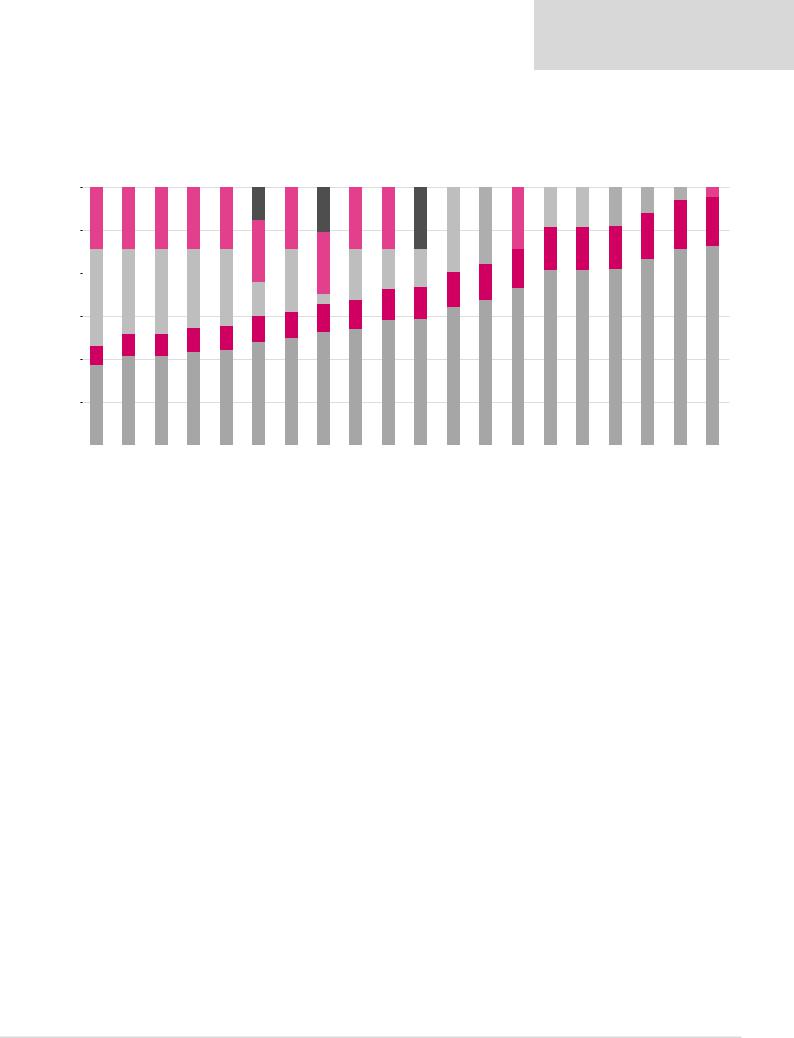
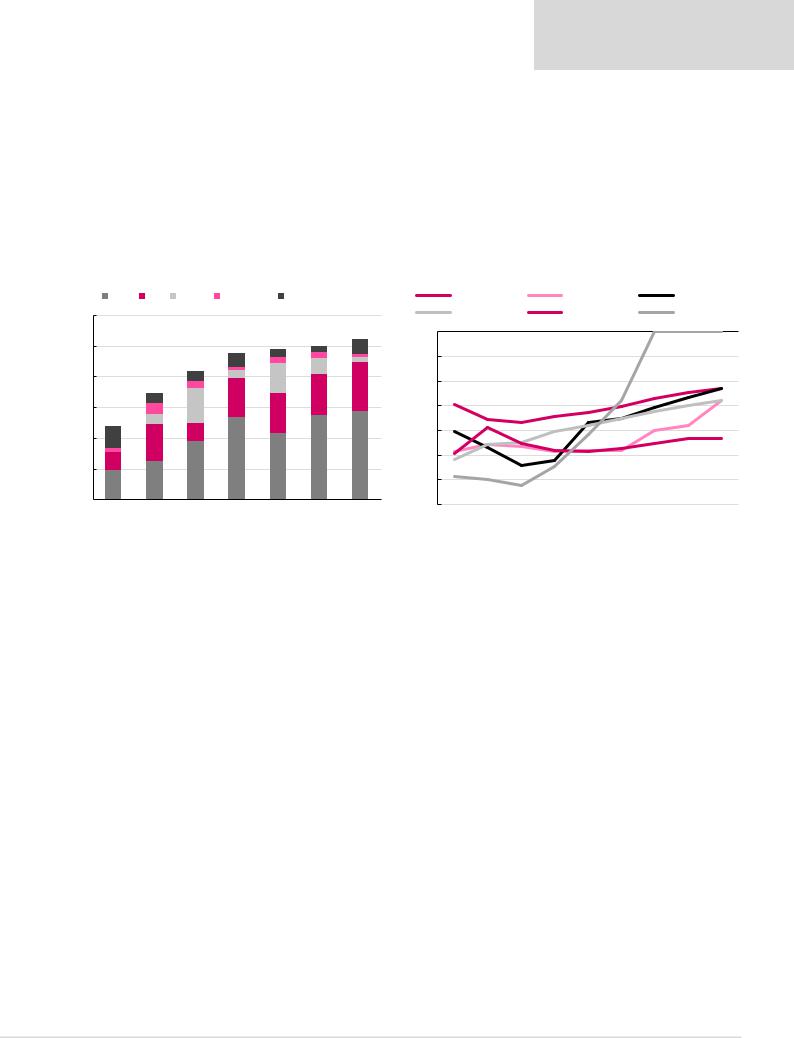
The ability of Russian oil companies to benefit from tax exemptions is a major factor determining their relative profitability, although forecasting the tax take has become increasingly more difficult. Our analysis in Figure 29 shows that NOVATEK remains the lowest overall tax payer in the sector (measured in terms of the total effective tax rate, and helped by both the amount of tax breaks and lower taxation of gas and natural gas condensate vs oil), followed by Gazprom and LUKOIL. Looking at just the oil sector, we estimate Gazprom Neft was the biggest beneficiary of tax savings in 2018 (due to the export duty breaks on its Prirazlomnoye and Novoport fields), followed by LUKOIL (helped by its ever-growing Caspian output) and Tatneft (supported by tax breaks on its growing output of high viscous oil), Figure 30. In 2019-2020, we expect LUKOIL may take over the number one spot in terms of tax benefits.
Figure 29: Russian oil and gas stocks – total tax take, 2019E |
Figure 30: Discount to statutory MET and export duty rates due to tax exemptions |
|
MET |
ED |
Excise |
Other taxes |
Current income tax |
Rosneft |
|
LUKOIL |
|
|
Gazprom Neft |
|||||
60% |
|
|
|
|
|
|
|
Surgutneftegas |
Tatneft |
|
|
NOVATEK |
||||
|
|
|
|
|
|
|
|
|
|
|
|
|
|
|
|
|
|
|
|
|
|
|
|
|
0% |
|
|
|
|
|
|
|
|
50% |
|
|
|
|
3% |
2% |
5% |
-5% |
|
|
|
|
|
|
|
|
|
|
|
|
4% |
2% |
1% |
|
|
|
|
|
|
|
|
||
|
|
|
|
2% |
5% |
1% |
|
|
|
|
|
|
|
|
|
|
|
|
|
|
1% |
|
|
|
|
|
|
|
|
|
|
|
|
40% |
|
|
3% |
3% |
10% |
|
-10% |
|
|
|
|
|
|
|
|
|
|
|
|
16% |
|
|
|
|
|
|
|
|
|||||
|
|
|
2% |
|
|
13% |
|
|
|
|
|
|
|
|
|
|
|
|
3% |
|
13% |
|
|
|
|
|
|
|
|
|
|
|
|
30% |
|
12% |
|
|
|
-15% |
|
|
|
|
|
|
|
|
||
|
4% |
|
13% |
|
|
|
|
|
|
|
|
|
||||
|
|
3% |
|
|
|
|
|
|
|
|
|
|
|
|
||
|
|
|
|
|
|
|
|
|
|
|
|
|
|
|
|
|
20% |
7% |
|
6% |
|
|
|
|
-20% |
|
|
|
|
|
|
|
|
|
|
|
|
|
|
|
|
|
|
|
|
|
|
|||
12% |
|
|
|
|
|
|
|
|
|
|
|
|
|
|
||
|
1 |
|
|
|
|
|
|
|
|
|
|
|
|
|
|
|
|
|
|
|
|
|
|
|
|
|
|
|
|
|
|
|
|
|
0% |
|
|
27% |
|
28% |
29% |
-25% |
|
|
|
|
|
|
|
|
|
6% |
|
|
|
|
|
|
|
|
|
|
|
||||
10% |
|
19% |
|
22% |
|
|
|
|
|
|
|
|
|
|
||
|
12% |
|
|
-30% |
|
|
|
|
|
|
|
|
||||
|
10% |
|
|
|
|
|
|
|
|
|
|
|
|
|
||
|
|
|
|
|
|
|
|
|
|
|
|
|
|
|
|
|
0% |
|
|
|
|
|
|
|
-35% |
|
|
|
|
|
|
|
|
|
NOVATEK |
Gazprom |
LUKOIL |
Tatneft |
Gazprom Neft Rosneft Surgutneftegas |
|
|
|
|
|
|
|
|
|||
|
2016 |
2017 |
2018E |
2019E |
2020E |
2021E |
2022E |
2023E |
2024E |
|||||||
|
|
|
|
|
|
|
|
|||||||||
Note: Tax take is calculated as Tax / (Sales – Purchases) |
|
|
|
|
|
|
|
|
|
|
|
|
||||
|
|
|
|
Source: Company data, Renaissance Capital estimates |
|
|
|
|
Source: Company data, Renaissance Capital estimates |
|||||||
23