

vk.com/id446425943
Gazprom
Gazprom Neft
We believe Gazprom Neft will be one of the beneficiaries of the 2019 tax changes in the Russian oil sector, mainly because of the conversion of its core Novoport field taxation into the EPT regime. Benefiting from above-average production growth (we estimate total hydrocarbon production, including associates, will increase by 3.8% in 2019) and tight cost control, Gazprom Neft has delivered stronger-than-expected FCF, with our FCF outlook remaining positive despite its elevated capex programme. We believe the company’s dividend payout ratio could increase from 35% (for 9M18), with our 50% expectation for 2020 reflecting a yield of 7.1%. We maintain our HOLD rating with a 6% higher TP of RUB380.
Strong production growth and fiscal support
We estimate Gazprom Neft will increase its total hydrocarbon output (including associates) by 3.8% in 2019, with a 4.7% increase in liquids production driven by Novoport, Prirazlomnoye and Kuyumba fields. We believe this growth will be supported by the company’s positive exposure to 2019 tax changes in the Russian oil sector, mainly related to the conversion of its core Novoport field taxation into the EPT regime, although we also estimate that Gazprom Neft will be one of the beneficiaries of the oil tax manoeuvre. Strong production and fiscal support should allow Gazprom Neft to maintain positive FCF to equity despite an extended capex cycle, we estimate.
Highest level of exposure to anti-Russian sanctions
Among the domestic oil & gas producers, Gazprom Neft has the highest level of exposure to anti-Russian sanctions. This has not affected the company’s ability to fund itself, but its more complex technologically intensive exploration and development projects – often in partnership with foreign oil companies – have been suspended, limiting future production and reserve upside.
Dividend upside
We believe the company’s dividend payout ratio could increase from 35% (for 9M18), with our 50% expectation for 2020 reflecting a yield of 7.1%.
Company update
HOLD (maintained)
TP: RUB380 (previously RUB360)
Oil & Gas Russia
Report date: |
14 December 2018 |
|
Current price, RUB |
|
366.7 |
Upside/downside, % |
|
3.6 |
MktCap, $mn |
|
26,167.7 |
Average daily volume, RUBmn |
149.7 |
|
Free float, RUBmn |
|
66,589.7 |
Bloomberg |
|
SIBN RX |
|
|
|
Summary valuation and financials, RUBbn (unless otherwise stated)
|
|
2017 |
2018E |
2019E |
2020E |
|
Revenue |
1,858 |
2,376 |
2,391 |
2,442 |
||
EBITDA |
444 |
642 |
489 |
507 |
||
Net income |
253 |
379 |
243 |
246 |
||
Net debt |
602 |
524 |
592 |
641 |
||
EPS, RUB |
53.7 |
80.3 |
51.5 |
52.2 |
||
DPS, RUB |
15.0 |
32.1 |
25.7 |
26.1 |
||
EV/Sales, x |
1.2 |
0.9 |
0.9 |
0.9 |
||
EV/EBITDA, x |
5.1 |
3.5 |
4.6 |
4.4 |
||
P/E, x |
6.8 |
4.6 |
7.1 |
7.0 |
||
Net debt/EBITDA, x |
1.4 |
0.8 |
1.2 |
1.3 |
||
Dividend yield, % |
4.1 |
8.8 |
7.0 |
7.1 |
||
FCF yield, % |
4.5 |
11.7 |
4.4 |
3.9 |
||
RoIC, % |
5.6 |
7.1 |
4.5 |
4.4 |
||
Source: Company data, Renaissance Capital estimates |
||||||
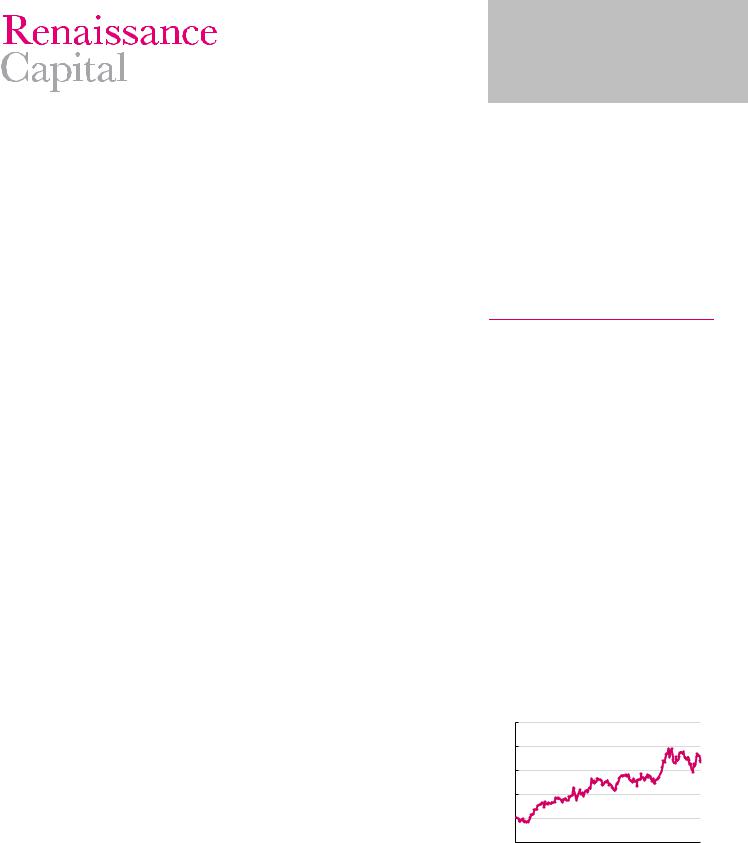
Figure 69: Price performance – 52 weeks |
|
|||||
RUB |
|
|
SIBN RX |
|
|
|
|
|
|
|
|||
450 |
|
|
|
|
|
|
|
|
|
|
|
|
400 |
|
|
|
|
|
|
|
|
|
|
|
|
350 |
|
|
|
|
|
|
|
|
|
|
|
|
300 |
|
|
|
|
|
|
|
|
|
|
|
|
250 |
|
|
|
|
|
|
|
|
|
|
|
|
200 |
Jan-18 |
|
Mar-18 |
|
May-18 |
Jun-18 |
Jul-18 |
|
|
|
|
|
Dec-17 |
Feb-18 |
Apr-18 |
Aug-18 |
Sep-18 |
Oct-18 |
Nov-18 |
Dec-18 |
Source: Bloomberg
vk.com/id446425943
Renaissance Capital
14 December 2018
Gazprom Neft
Figure 70: Gazprom Neft liquids production growth rate vs Russian average
15.0% |
|
Russia |
Gazprom Neft |
|
|
||
|
|
|
|
|
|
|
|
10.0% |
|
|
|
|
|
|
|
5.0% |
|
|
|
|
|
|
|
0.0% |
|
|
|
|
|
|
|
-5.0% |
|
|
|
|
|
|
|
-10.0% |
|
|
|
|
|
|
|
Jan-14 |
Sep-14 |
May-15 |
Jan-16 |
Sep-16 |
May-17 |
Jan-18 |
Sep-18 |
Figure 71: Gazprom Neft total tax breaks (MET + export duty)
 Total tax break (lhs), RUBbn Total % tax break (rhs)
Average % tax break for Russia (rhs)
300 |
|
|
|
|
35% |
250 |
|
|
|
|
30% |
|
|
|
|
|
|
200 |
|
|
|
|
25% |
|
|
|
|
|
|
|
|
|
|
|
20% |
150 |
|
|
|
|
|
|
|
|
|
|
15% |
100 |
|
|
|
|
10% |
|
|
|
|
|
|
50 |
|
|
|
|
5% |
|
|
|
|
|
|
- |
|
|
|
|
0% |
2010 |
2012 |
2014 |
2016 |
2018E |
2020E |
Source: CDU TEK, Renaissance Capital |
Source: Company data, Renaissance Capital estimates |
Figure 72: Sanctions imposed on Russian oil & gas companies
|
US |
|
EU |
Canada |
||
|
Financial |
Sectoral Financial |
Sectoral |
Financial |
Sectoral |
|
Rosneft |
|
|
|
|
|
|
Gazprom |
|
|
|
|
|
|
|
|
|||||
Gazprom Neft |
|
|
|
|
|
|
LUKOIL |
|
|
|
|
|
|
|
|
|
||||
Surgutneftegas |
|
|
|
|
|
|
NOVATEK |
|
|
|
|
|
|
|
|
|||||
|
|
|
|
|
|
|
Tatneft |
|
|
|
|
|
|
Bashneft* |
|
|
|
|
|
|
|
|
|
|
|
|
|
Transneft |
|
|
|
|
|
|
* Bashneft is majority owned by Rosneft
Source: Renaissance Capital
Figure 73: Gazprom Neft – sources and uses of funds, $bn
|
CFFO |
|
Divestments |
|
|
||
|
|
||
|
Capex and investments |
|
Interest |
|
|
||
|
|
||
|
Dividends |
|
FCF to equity |
|
|
15 |
|
|
|
|
|
|
|
|
|
10 |
|
|
|
|
|
|
|
|
|
5 |
|
|
|
|
|
|
|
|
|
- |
|
|
|
|
|
|
|
|
|
(5) |
|
|
|
|
|
|
|
|
|
(10) |
|
|
|
|
|
|
|
|
|
2012 |
2013 |
2014 |
2015 |
2016 |
2017 |
2018E |
2019E |
2020E |
2021E |
Source: Company data, Renaissance Capital estimates
Figure 74: Gazprom Neft – FCF bridge 2018E, $bn |
|
|
|
|
Figure 75: Gazprom Neft – FCF bridge 2019E, $bn |
|
|
|
|
||||||||||||
10 |
|
|
|
|
|
|
|
|
|
|
10 |
|
|
|
|
|
|
|
|
|
|
|
|
|
|
|
|
|
|
|
|
8 |
|
|
|
|
|
|
|
|
|
|
|
8 |
|
|
|
|
|
|
|
|
|
|
|
|
|
|
|
|
|
|
|
|
|
|
|
|
|
|
|
|
|
|
|
|
|
|
|
|
|
|
|
|
|
||
|
|
|
|
|
|
|
|
|
|
|
|
|
|
|
|
|
|
|
|
||
|
|
|
|
|
|
|
|
|
|
6 |
|
|
|
|
|
|
|
|
|
|
|
|
|
|
|
|
|
|
|
|
|
|
|
|
|
|
|
|
|
|
|
||
6 |
|
|
|
|
|
|
|
|
|
|
|
|
|
|
|
|
|
|
|
|
|
|
|
|
|
|
|
|
|
|
|
|
|
|
|
|
|
|
|
|
|
||
|
|
|
|
|
|
|
|
|
|
|
|
|
|
|
|
|
|
|
|
||
|
|
|
|
|
|
|
|
|
|
4 |
|
|
|
|
|
|
|
|
|
|
|
|
|
|
|
|
|
|
|
|
|
|
|
|
|
|
|
|
|
|
|
||
4 |
|
|
|
|
|
|
|
|
|
|
|
|
|
|
|
|
|
|
|
|
|
|
|
|
|
|
|
|
|
|
|
|
|
|
|
|
|
|
|
|
|
||
|
|
|
|
|
|
|
|
|
|
2 |
|
|
|
|
|
|
|
|
|
|
|
|
|
|
|
|
|
|
|
|
|
|
|
|
|
|
|
|
|
|
|
||
2 |
|
|
|
|
|
|
|
|
|
|
|
|
|
|
|
|
|
|
|
|
|
|
|
|
|
|
|
|
|
|
|
- |
|
|
|
|
|
|
|
|
|
|
|
|
|
|
|
|
|
|
|
|
|
|
|
|
|
|
|
|
|
|
|
||
- |
|
|
|
|
|
|
|
|
|
|
|
|
|
|
|
|
|
|
|
|
|
|
|
|
|
|
|
|
|
|
|
(2) |
|
|
|
|
|
|
|
|
|
|
|
|
|
|
|
|
|
|
|
|
|
|
|
|
|
|
|
|
|
|
|
||
CFFO 2017 |
WC |
Other |
CFFO 2018 |
|
Capex |
FCF 2018 |
Interest |
Dividends 2018 |
|
|
|
|
|
|
|
|
|
||||
|
CFFO 2018 |
WC |
Other |
CFFO 2019 |
|
Capex |
FCF 2019 |
Interest |
Dividends 2019 |
||||||||||||
|
|
|
|
||||||||||||||||||
|
|
|
|
|
Source: Company data, Renaissance Capital estimates |
|
|
|
|
|
Source: Company data, Renaissance Capital estimates |
||||||||||
41

vk.com/id446425943
Renaissance Capital
14 December 2018
Gazprom Neft
Figure 76: Gazprom Neft – operating and financial summary
Operating statistics |
2013 |
2014 |
2015 |
2016 |
2017 |
2018E |
2019E |
2020E |
Crude oil production, mnt |
51 |
52 |
56 |
60 |
62 |
64 |
67 |
68 |
Gas production, bcm |
14.6 |
17.7 |
29.9 |
32.8 |
34.0 |
24.6 |
24.9 |
24.8 |
Total hydrocarbon production, mn boe |
455 |
484 |
582 |
630 |
656 |
610 |
633 |
639 |
Refining throughput, mnt |
43 |
43 |
43 |
42 |
40 |
42 |
42 |
42 |
Income statement, RUBbn |
2013 |
2014 |
2015 |
2016 |
2017 |
2018E |
2019E |
2020E |
Gross revenue |
1,268 |
1,408 |
1,468 |
1,546 |
1,858 |
2,376 |
2,391 |
2,442 |
Operating expenses |
(1,045) |
(1,187) |
(1,262) |
(1,307) |
(1,555) |
(1,923) |
(2,110) |
(2,154) |
EBITDA |
299 |
307 |
320 |
368 |
444 |
642 |
489 |
507 |
EBITDA margin |
24% |
22% |
22% |
24% |
24% |
27% |
20% |
21% |
EBIT |
222 |
221 |
206 |
238 |
303 |
453 |
281 |
288 |
EBIT margin |
18% |
16% |
14% |
15% |
16% |
19% |
12% |
12% |
Financial items |
4 |
(75) |
(61) |
21 |
23 |
37 |
43 |
41 |
Profit before tax |
226 |
146 |
145 |
260 |
325 |
490 |
324 |
329 |
Net income |
178 |
122 |
110 |
200 |
253 |
379 |
243 |
246 |
Average number of shares outstanding, mn |
4,718 |
4,718 |
4,718 |
4,718 |
4,718 |
4,718 |
4,718 |
4,718 |
EPS, RUB per share |
37.71 |
25.88 |
23.24 |
42.43 |
53.68 |
80.34 |
51.49 |
52.23 |
DPS, RUB per share |
9.38 |
6.47 |
6.47 |
10.68 |
15.00 |
32.14 |
25.74 |
26.11 |
Payout ratio, % |
24.9 |
25.0 |
27.8 |
25.2 |
27.9 |
40.0 |
50.0 |
50.0 |
|
|
|
|
|
|
|
|
|
Growth rates, % |
|
|
|
|
|
|
|
|
Total hydrocarbon production |
5.7 |
6.4 |
20.3 |
8.2 |
4.1 |
(7.0) |
3.8 |
0.9 |
Revenue |
(15.2) |
11.1 |
4.2 |
5.3 |
20.2 |
27.9 |
0.6 |
2.1 |
EPS |
1.6 |
(31.4) |
(10.2) |
82.5 |
26.5 |
49.7 |
(35.9) |
1.4 |
DPS |
0.9 |
(31.0) |
(0.0) |
65.1 |
40.4 |
114.2 |
(19.9) |
1.4 |
|
|
|
|
|
|
|
|
|
Balance sheet, RUBbn |
2013 |
2014 |
2015 |
2016 |
2017 |
2018E |
2019E |
2020E |
Current assets |
433 |
471 |
511 |
396 |
423 |
600 |
537 |
494 |
Non-current assets |
1,131 |
1,627 |
1,975 |
2,152 |
2,507 |
2,782 |
2,920 |
3,049 |
Total assets |
1,564 |
2,098 |
2,485 |
2,549 |
2,930 |
3,383 |
3,457 |
3,542 |
Current liabilities |
208 |
251 |
349 |
289 |
479 |
469 |
487 |
484 |
Long-term liabilities |
358 |
717 |
888 |
815 |
792 |
841 |
841 |
841 |
Minorities |
45 |
64 |
91 |
84 |
106 |
131 |
147 |
164 |
Equity |
953 |
1,066 |
1,157 |
1,360 |
1,553 |
1,942 |
1,982 |
2,055 |
Total equity and liabilities |
1,564 |
2,098 |
2,485 |
2,549 |
2,930 |
3,383 |
3,457 |
3,542 |
|
|
|
|
|
|
|
|
|
Cash-flow statement, RUBbn |
2013 |
2014 |
2015 |
2016 |
2017 |
2018E |
2019E |
2020E |
Net income |
226 |
146 |
145 |
260 |
325 |
490 |
324 |
329 |
DD&A |
77 |
86 |
114 |
130 |
141 |
189 |
208 |
219 |
Other |
(34) |
59 |
7 |
(83) |
(97) |
(139) |
(124) |
(123) |
Changes in working capital |
8 |
(6) |
18 |
15 |
53 |
(13) |
13 |
(9) |
Cash flow from operations |
277 |
284 |
285 |
321 |
422 |
527 |
421 |
415 |
Cash flow used for investments |
(256) |
(365) |
(315) |
(324) |
(313) |
(303) |
(337) |
(343) |
Cash flow used for/from financing |
(13) |
11 |
82 |
(68) |
(51) |
(148) |
(152) |
(121) |
Effect of exchange rate changes |
4 |
32 |
8 |
(10) |
(1) |
7 |
- |
- |
Cash flow for the year |
12 |
(38) |
61 |
(81) |
57 |
82 |
(68) |
(49) |
|
|
|
|
|
|
|
|
|
Key data |
2013 |
2014 |
2015 |
2016 |
2017 |
2018E |
2019E |
2020E |
Net debt/(cash), RUBbn |
167 |
431 |
639 |
601 |
602 |
524 |
592 |
641 |
Net debt/equity, % |
17.5 |
40.5 |
55.2 |
44.2 |
38.7 |
27.0 |
29.8 |
31.2 |
RoE, % |
19 |
11 |
9 |
15 |
16 |
20 |
12 |
12 |
RoIC, % |
7 |
4 |
3 |
5 |
6 |
7 |
4 |
4 |
RoACE, % |
17 |
9 |
8 |
11 |
13 |
16 |
10 |
10 |
Source: Company data, Renaissance Capital estimates
42
vk.com/id446425943
Tatneft
Tatneft’s recently announced 2030 Strategy promises accelerated production growth and delays full commissioning of the TANECO refinery compared with our previous expectations. A 60% stated increase in the company’s 2019 capex will pressure its FCF and dividend payouts next year, we estimate, with our estimated sustainable dividend payout ratio of 50% resulting in 2019 dividend yields of 5.5% for commons (HOLD) and 7.8% for prefs (BUY). We increase our TP by 1% to RUB750 (from RUB740).
Accelerated production growth
We estimate Tatneft’s 2018-2021 CAGR in crude production at 3.6% (vs just 2.5% in the past three years), driven by improved recovery from its core assets in Tatarstan, as well as gains in the production of highly viscous crude. Tatneft remains an outlier among Russian oil companies, with exceptionally low organic decline rates (3% in 2017 vs a Russian average of 14%, driven by the peculiarities of its super-giant Romashkinskoye field). This means it has the lowest capex requirements in the sector, supporting our strong dividend outlook.
TANECO continues to improve, although slower than previously expected
The launch of gasoline production at the TANECO refinery should improve the company’s downstream margins in 2019 as well as increase throughput by 16% YoY. With 11 more units remaining to be commissioned, TANECO should reach full capacity in 2029, according to the recently released 2030 Strategy, four years later than previously expected.
We estimate a sustainable payout ratio of 50% at $60/bl Brent
In our view, Tatneft has demonstrated an exemplary improvement in dividend payouts, with payout ratios of 75% in 2017 and 9M18, as well as two interim dividends declared during 2018. We believe that the strength of the company’s underlying business model should enable it to maintain a high dividend payout ratio into the future, although the stated increase in capex plans provides for a sustainable payout ratio of 50% (under $60/bl real Brent oil price forecast), we estimate, with additional upside coming from stronger commodity prices. This estimate translates into 2019 dividend yields of 5.5% and 7.8% for Tatneft’s commons and prefs, we estimate.
Company updateRen issance Capital HOLD/BUY 8 December 2017
(comm/pref; maintained)Gazprom Neft TP: RUB750
(comm/pref; previously RUB740)
Oil & Gas Russia
Report date: |
14 December 2018 |
|
Current price, RUB |
|
760.0 / 540.3 |
Upside/downside, % |
|
-1.3 / 39.0 |
MktCap, $mn |
|
25,373.2 |
Average daily volume, RUBmn |
1,235.6 |
|
Free float, RUBmn |
|
1,139,840.7 |
Bloomberg |
|
TATN RX / TATNP RX |
|
|
|
Summary valuation and financials, RUBbn (unless otherwise stated)
|
|
|
2017 |
2018E |
2019E |
2020E |
|
Revenue |
773 |
1,021 |
972 |
946 |
|||
EBITDA |
187 |
325 |
282 |
271 |
|||
Net income |
123 |
237 |
194 |
180 |
|||
Net debt |
4 |
(81) |
(6) |
0 |
|||
EPS, RUB |
54.7 |
105.4 |
86.2 |
80.0 |
|||
DPS, RUB |
39.9 |
71.8 |
41.9 |
38.9 |
|||
EV/Sales, x |
2.1 |
1.6 |
1.7 |
1.7 |
|||
EV/EBITDA, x |
8.8 |
5.1 |
5.9 |
6.1 |
|||
P/E, x |
14.1 |
7.3 |
8.9 |
9.6 |
|||
Net debt/EBITDA, x |
0.0 |
-0.3 |
0.0 |
0.0 |
|||
Div yield (ord), % |
5.3 |
9.4 |
5.5 |
5.1 |
|||
Div yield (pref), % |
7.4 |
13.3 |
7.8 |
7.2 |
|||
FCF yield, % |
6.1 |
10.3 |
5.3 |
5.3 |
|||
RoIC, % |
29.3 |
21.3 |
17.8 |
16.0 |
|||
|
|
Source: Company data, Renaissance Capital estimates |
|||||
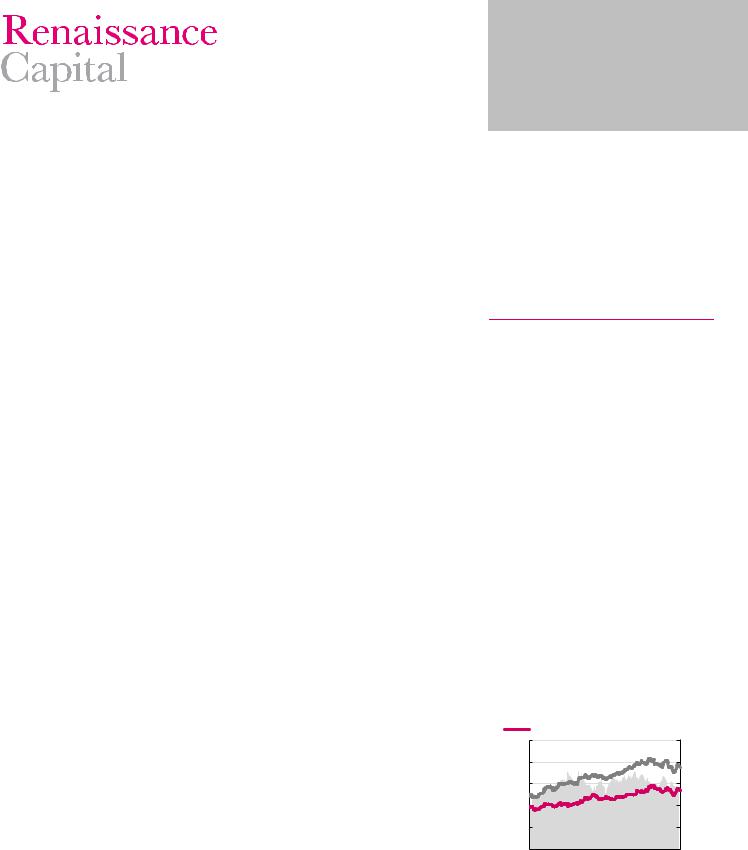
Figure 77: Price performance – 52 weeks, RUB |
|
||||||
|
|
Pref discount (rhs) |
|
|
TATN RX Equity |
||
|
|
|
|
||||
TATNP RX Equity
1,000 |
|
|
|
|
|
|
|
|
|
|
|
50% |
800 |
|
|
|
|
|
|
|
|
|
|
|
40% |
600 |
|
|
|
|
|
|
|
|
|
|
|
30% |
400 |
|
|
|
|
|
|
|
|
|
|
|
20% |
200 |
|
|
|
|
|
|
|
|
|
|
|
10% |
0 |
Jan-18 |
Feb-18 |
Mar-18 |
Apr-18 |
May-18 |
Jun-18 |
Jul-18 |
|
|
Oct-18 |
|
0% |
Dec-17 |
Aug-18 |
Sep-18 |
Nov-18 |
Dec-18 |
Source: Bloomberg
vk.com/id446425943 |
|
|
|
|
|
|
|
|
|
|
|
|
|
|
|
|
|
|
|
||||
|
|
|
|
|
|
|
|
|
|
|
|
|
|
|
|
|
|
|
Renaissance Capital |
||||
|
|
|
|
|
|
|
|
|
|
|
|
|
|
|
|
|
|
|
14 December 2018 |
||||
|
|
|
|
|
|
|
|
|
|
|
|
|
|
|
|
|
|
|
|
|
|
Tatneft |
|
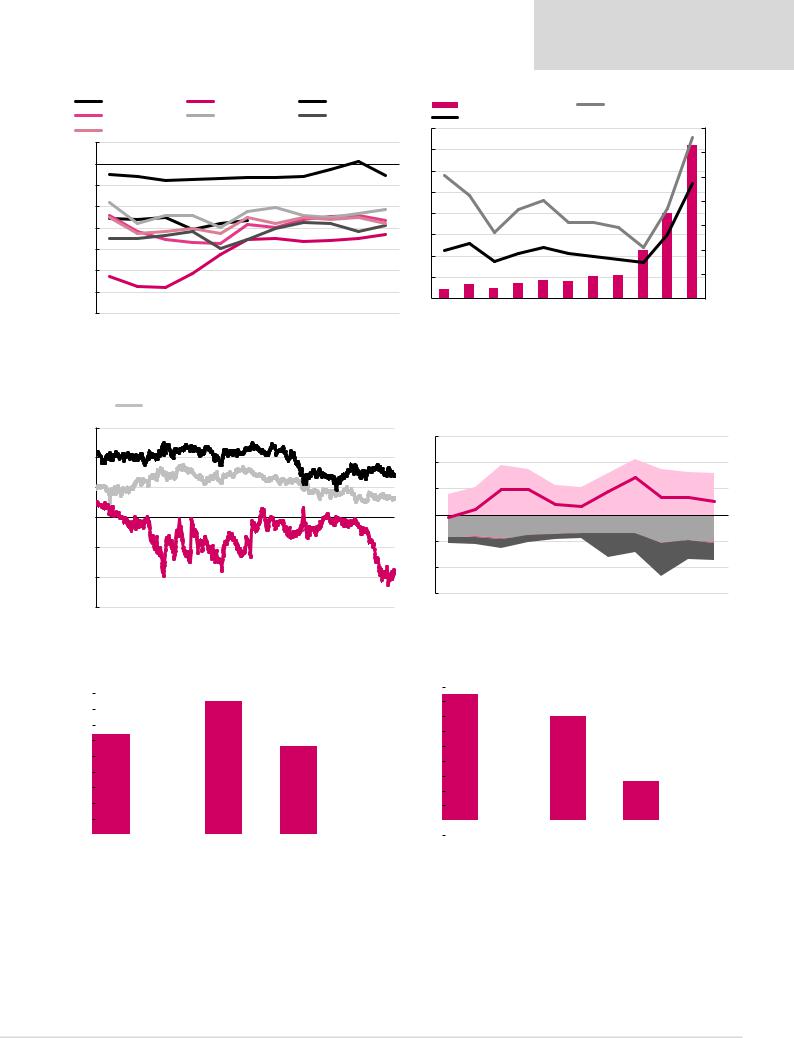
Figure 78: Organic decline rates by company |
|
|
|
|
Figure 79: Tatneft dividend dynamics |
|
|
|
|
|
|
|
|||||||||||
Tatneft |
|
|
Gazprom Neft |
|
TNK-BP |
|
|
Dividend (lhs), RUB/share |
|
|
Preferred dividend yield, rhs |
||||||||||||
Surgutneftegaz |
|
LUKOIL |
|
|
Rosneft |
|
|
Ordinary dividend yield, rhs |
|
|
|
|
|
|
|||||||||
Russia, average |
|
|
|
|
|
|
|
80 |
|
|
|
|
|
|
|
|
|
|
71.8 |
14% |
|||
5% |
|
|
|
|
|
|
|
|
|
|
|
|
|
|
|
|
|
|
|
|
|
||
|
|
|
|
|
|
|
|
|
70 |
|
|
|
|
|
|
|
|
|
|
|
12% |
||
|
|
|
|
|
|
|
|
|
|
|
|
|
|
|
|
|
|
|
|
|
|||
|
|
|
|
|
|
|
|
|
|
|
|
|
|
|
|
|
|
|
|
|
|
||
0% |
|
|
|
|
|
|
|
|
|
60 |
|
|
|
|
|
|
|
|
|
|
|
|
|
|
|
|
|
|
|
|
|
|
|
|
|
|
|
|
|
|
|
|
|
|
10% |
||
-5% |
|
|
|
|
|
|
|
|
|
|
|
|
|
|
|
|
|
|
|
|
|
||
|
|
|
|
|
|
|
|
|
50 |
|
|
|
|
|
|
|
|
|
|
|
|
||
|
|
|
|
|
|
|
|
|
|
|
|
|
|
|
|
|
|
|
39.9 |
|
8% |
||
-10% |
|
|
|
|
|
|
|
|
|
|
|
|
|
|
|
|
|
|
|
|
|||
|
|
|
|
|
|
|
|
|
40 |
|
|
|
|
|
|
|
|
|
|
|
|
||
|
|
|
|
|
|
|
|
|
|
|
|
|
|
|
|
|
|
|
|
|
|
||
-15% |
|
|
|
|
|
|
|
|
|
30 |
|
|
|
|
|
|
|
|
|
|
|
6% |
|
|
|
|
|
|
|
|
|
|
|
|
|
|
|
|
|
|
|
|
|
|
|||
|
|
|
|
|
|
|
|
|
|
|
|
|
|
|
|
|
|
22.8 |
|
|
|
||
|
|
|
|
|
|
|
|
|
|
|
|
|
|
|
|
|
|
|
|
|
|
||
-20% |
|
|
|
|
|
|
|
|
|
20 |
|
|
|
|
|
|
|
|
|
|
|
4% |
|
|
|
|
|
|
|
|
|
|
|
|
|
|
|
|
|
10.6 |
11.0 |
|
|
|
|
||
-25% |
|
|
|
|
|
|
|
|
|
|
|
6.6 |
|
7.1 |
8.6 |
8.2 |
|
|
|
2% |
|||
|
|
|
|
|
|
|
|
|
10 |
4.4 |
5.0 |
|
|
|
|
|
|||||||
|
|
|
|
|
|
|
|
|
|
|
|
|
|
|
|
|
|||||||
-30% |
|
|
|
|
|
|
|
|
|
0 |
|
|
|
|
|
|
|
|
|
|
|
0% |
|
2007 |
2008 |
2009 |
2010 |
2011 |
2012 |
2013 |
2014 |
2015 |
2016 |
2008 |
2009 |
2010 |
2011 |
2012 |
2013 |
2014 |
2015 |
2016 |
2017 |
2018E |
|||
2017 |
|
||||||||||||||||||||||
-35% |
|
|
|
|
|
|
|
|
|
|
|
|
|
|
|
|
|
|
|
|
|
|
|
Source: Company data, CDU TEK, Interfax, Renaissance Capital estimates |
Source: Company data, Bloomberg, Renaissance Capital estimates |
Figure 80: Preferred shares discount/(premium) to common
Sberbank |
|
Surgutneftegas |
|
Tatneft |
|
|
60%
40% |
|
|
|
|
20% |
|
|
|
|
0% |
|
|
|
|
-20% |
|
|
|
|
-40% |
|
|
|
|
-60% |
|
|
|
|
2013 |
2014 |
2015 |
2016 |
2017 |
Source: Bloomberg, Renaissance Capital
Figure 81: Tatneft – sources and uses of funds, $bn |
|
|||
|
|
CFFO |
|
Divestments |
|
|
|
||
|
|
|
||
|
|
Capex and investments |
|
Interest |
|
|
|
||
|
|
|
||
|
|
Dividends |
|
FCF to equity |
|
|
|
||
6 |
|
|
|
|
|
|
|
|
|
|
4 |
|
|
|
|
|
|
|
|
|
|
2 |
|
|
|
|
|
|
|
|
|
|
- |
|
|
|
|
|
|
|
|
|
|
(2) |
|
|
|
|
|
|
|
|
|
|
(4) |
|
|
|
|
|
|
|
|
|
|
(6) |
|
|
|
|
|
|
|
|
|
|
2011 |
2012 |
2013 |
2014 |
2015 |
2016 |
2017 |
2018E |
2019E |
2020E |
2021E |
Source: Company data, Renaissance Capital estimates
Figure 82: Tatneft – FCF bridge 2018E, $bn |
|
|
|
|
|
|
Figure 83: Tatneft – FCF bridge 2019E, $bn |
|
|
|
|
||||||||||
4.5 |
|
|
|
|
|
|
|
|
|
|
4.5 |
|
|
|
|
|
|
|
|
|
|
|
|
|
|
|
|
|
|
|
|
|
|
|
|
|
|
|
|
|
|
||
|
|
|
|
|
|
|
|
|
|
4.0 |
|
|
|
|
|
|
|
|
|
|
|
4.0 |
|
|
|
|
|
|
|
|
|
|
|
|
|
|
|
|
|
|
|
|
|
|
|
|
|
|
|
|
|
|
|
3.5 |
|
|
|
|
|
|
|
|
|
|
|
3.5 |
|
|
|
|
|
|
|
|
|
|
|
|
|
|
|
|
|
|
|
|
|
|
|
|
|
|
|
|
|
|
|
3.0 |
|
|
|
|
|
|
|
|
|
|
|
|
|
|
|
|
|
|
|
|
|
|
|
|
|
|
|
|
|
|
|
||
3.0 |
|
|
|
|
|
|
|
|
|
|
|
|
|
|
|
|
|
|
|
|
|
|
|
|
|
|
|
|
|
|
|
2.5 |
|
|
|
|
|
|
|
|
|
|
|
2.5 |
|
|
|
|
|
|
|
|
|
|
|
|
|
|
|
|
|
|
|
|
|
|
|
|
|
|
|
|
|
|
|
2.0 |
|
|
|
|
|
|
|
|
|
|
|
|
|
|
|
|
|
|
|
|
|
|
|
|
|
|
|
|
|
|
|
||
2.0 |
|
|
|
|
|
|
|
|
|
|
|
|
|
|
|
|
|
|
|
|
|
|
|
|
|
|
|
|
|
|
|
1.5 |
|
|
|
|
|
|
|
|
|
|
|
|
|
|
|
|
|
|
|
|
|
|
|
|
|
|
|
|
|
|
|
||
1.5 |
|
|
|
|
|
|
|
|
|
|
|
|
|
|
|
|
|
|
|
|
|
|
|
|
|
|
|
|
|
|
|
1.0 |
|
|
|
|
|
|
|
|
|
|
|
|
|
|
|
|
|
|
|
|
|
|
|
|
|
|
|
|
|
|
|
||
|
|
|
|
|
|
|
|
|
|
|
|
|
|
|
|
|
|
|
|
||
|
|
|
|
|
|
|
|
|
|
|
|
|
|
|
|
|
|
|
|
|
|
1.0 |
|
|
|
|
|
|
|
|
|
|
0.5 |
|
|
|
|
|
|
|
|
|
|
|
|
|
|
|
|
|
|
|
|
|
|
|
|
|
|
|
|
|
|||
|
|
|
|
|
|
|
|
|
|
|
|
|
|
|
|
|
|
|
|
||
0.5 |
|
|
|
|
|
|
|
|
|
|
- |
|
|
|
|
|
|
|
|
|
|
- |
|
|
|
|
|
|
|
|
|
|
(0.5) |
|
|
|
|
|
|
|
|
|
|
CFFO 2017 |
WC |
Other |
CFFO 2018 |
|
Capex |
FCF 2018 |
Interest |
Dividends 2018 |
|
|
|
|
|
|
|
|
|
||||
|
CFFO 2018 |
WC |
Other |
CFFO 2019 |
|
Capex |
FCF 2019 |
Interest |
Dividends 2019 |
||||||||||||
|
|
|
|
||||||||||||||||||
|
|
|
|
|
Source: Company data, Renaissance Capital estimates |
|
|
|
|
|
Source: Company data, Renaissance Capital estimates |
||||||||||
44

vk.com/id446425943
Renaissance Capital
14 December 2018
Tatneft
Figure 84: Tatneft – operating and financial summary
Operating statistics |
2013 |
2014 |
2015 |
2016 |
2017 |
2018E |
2019E |
2020E |
Crude oil production, mnt |
26 |
27 |
27 |
29 |
29 |
29 |
30 |
32 |
Gas production, bcm |
0.9 |
0.9 |
1.0 |
1.0 |
0.9 |
0.9 |
0.9 |
0.9 |
Total hydrocarbon production, mn boe |
198 |
199 |
205 |
215 |
217 |
220 |
226 |
238 |
Refining throughput, mnt |
8 |
9 |
9 |
9 |
8 |
9 |
11 |
11 |
|
|
|
|
|
|
|
|
|
Income statement, RUBbn |
2013 |
2014 |
2015 |
2016 |
2017 |
2018E |
2019E |
2020E |
Gross revenue |
647 |
646 |
657 |
665 |
773 |
1,021 |
972 |
946 |
Operating expenses |
(542) |
(540) |
(527) |
(521) |
(610) |
(727) |
(729) |
(715) |
EBITDA |
124 |
128 |
156 |
166 |
187 |
325 |
282 |
271 |
EBITDA margin |
19% |
20% |
24% |
25% |
24% |
32% |
29% |
29% |
EBIT |
104 |
107 |
131 |
144 |
163 |
294 |
243 |
231 |
EBIT margin |
16% |
16% |
20% |
22% |
21% |
29% |
25% |
24% |
Financial items |
(3) |
17 |
7 |
(3) |
1 |
10 |
4 |
(2) |
Profit before tax |
101 |
124 |
138 |
141 |
164 |
303 |
247 |
229 |
Net income |
71 |
92 |
99 |
107 |
123 |
237 |
194 |
180 |
Average number of shares outstanding, mn |
2,326 |
2,326 |
2,326 |
2,261 |
2,251 |
2,251 |
2,251 |
2,251 |
EPS, RUB per share |
30.4 |
39.6 |
42.7 |
47.5 |
54.7 |
105.4 |
86.2 |
80.0 |
DPS, RUB per share |
8.2 |
10.6 |
11.0 |
22.8 |
39.9 |
71.8 |
41.9 |
38.9 |
Payout ratio, % |
30.0 |
30.0 |
30.0 |
50.0 |
75.5 |
70.0 |
50.0 |
50.0 |
|
|
|
|
|
|
|
|
|
Growth rates, % |
|
|
|
|
|
|
|
|
Total hydrocarbon production |
0.4 |
0.4 |
2.7 |
5.2 |
0.7 |
1.4 |
2.7 |
5.2 |
Revenue |
3.2 |
(0.0) |
1.7 |
1.2 |
16.2 |
32.1 |
(4.8) |
(2.7) |
EPS |
70.3 |
30.2 |
7.7 |
11.3 |
15.2 |
92.7 |
(18.3) |
(7.2) |
DPS |
(4.3) |
28.6 |
3.6 |
108.1 |
75.1 |
79.8 |
(41.6) |
(7.2) |
|
|
|
|
|
|
|
|
|
Balance sheet, RUBbn |
2013 |
2014 |
2015 |
2016 |
2017 |
2018E |
2019E |
2020E |
Current assets |
152 |
181 |
179 |
332 |
285 |
348 |
319 |
341 |
Non-current assets |
522 |
552 |
619 |
762 |
822 |
902 |
1,029 |
1,140 |
Total assets |
674 |
733 |
799 |
1,095 |
1,107 |
1,250 |
1,348 |
1,481 |
Current liabilities |
83 |
68 |
69 |
286 |
306 |
292 |
342 |
372 |
Long-term liabilities |
87 |
82 |
72 |
99 |
82 |
90 |
90 |
90 |
Minorities |
23 |
26 |
29 |
5 |
7 |
5 |
5 |
5 |
Equity |
481 |
556 |
628 |
704 |
712 |
863 |
911 |
1,014 |
Total equity and liabilities |
674 |
733 |
799 |
1,095 |
1,107 |
1,250 |
1,348 |
1,481 |
|
|
|
|
|
|
|
|
|
Cash-flow statement, RUBbn |
2013 |
2014 |
2015 |
2016 |
2017 |
2018E |
2019E |
2020E |
Net income |
71 |
92 |
99 |
107 |
123 |
237 |
194 |
180 |
DD&A |
19 |
21 |
25 |
22 |
25 |
31 |
39 |
41 |
Other |
18 |
23 |
24 |
(0) |
49 |
11 |
1 |
1 |
Changes in working capital |
10 |
0 |
(8) |
12 |
(7) |
(12) |
4 |
2 |
Cash flow from operations |
118 |
136 |
141 |
141 |
190 |
268 |
238 |
224 |
Cash flow used for investments |
(58) |
(72) |
(120) |
(47) |
(112) |
(91) |
(147) |
(132) |
Cash flow used for/from financing |
(44) |
(54) |
(39) |
(40) |
(112) |
(122) |
(117) |
(68) |
Effect of exchange rate changes |
- |
- |
- |
- |
(0) |
1 |
- |
- |
Cash flow for the year |
16 |
10 |
(18) |
54 |
(34) |
55 |
(26) |
24 |
|
|
|
|
|
|
|
|
|
Key data |
2013 |
2014 |
2015 |
2016 |
2017 |
2018E |
2019E |
2020E |
Net debt/(cash), RUBbn |
19 |
(14) |
(7) |
(23) |
4 |
(81) |
(6) |
0 |
Net debt/equity, % |
3.9 |
(2.6) |
(1.1) |
(3.3) |
0.6 |
(9.4) |
(0.6) |
0.0 |
RoE, % |
14.7 |
16.6 |
15.8 |
15.3 |
17.3 |
27.5 |
21.3 |
17.7 |
RoIC, % |
14.3 |
17.8 |
17.6 |
17.1 |
29.3 |
21.3 |
17.8 |
16.0 |
RoACE, % |
15.9 |
14.9 |
13.7 |
14.3 |
27.0 |
19.8 |
17.1 |
15.6 |
Source: Company data, Renaissance Capital estimates
45