


vk.com/id446425943
Company profiles
Renaissance Capital
8 December 2017
Oil & Gas
Company profiles
30
vk.com/id446425943
Rosneft
We maintain our positive outlook for Rosneft, driven by its superior growth potential (we forecast additional production capacity of 690kboe/d by end-2019), strong FCF outlook and improving dividend prospects. We believe Rosneft will be one of the beneficiaries of 2019 tax changes in the Russian oil sector, particularly via new EPT regime, as well as benefiting from above-average logistical co-efficients applied to the calculation of negative oil excise tax. We maintain our BUY rating and TP of RUB550/share.
Tax-advantaged organic growth
We forecast Rosneft’s total hydrocarbon production capacity will increase by 690kboe/d in 2019, driven by the commissioning of four new oil fields by YE18 (Tagulskoye, Russkoye, Kuyumbinskoye and Taas-Yuriakh Phase 2) and a launch of Rospan during 2019, as well as the ramp-up of existing production. The company’s pre-OPEC+ guidance for liquids output of 241mnt in 2019 reflects a potential to increase its crude production by 3.3% next year, although we believe the actual growth will be constrained to 0.6% following the recent OPEC+ deal. The launch of the Rospan project will increase Rosneft’s gas production capacity by 29%, we estimate. We estimate that the positive mix effect from the ramp-up of the new taxadvantaged production will increase Rosneft’s annual tax savings by $0.3bn in 2019 and $0.5bn by 2020, excluding JVs (which will see an increase of annual costs savings by another $0.3bn in 2019 and $0.4bn by 2020). We estimate that Rosneft’s RoIC bottomed out in 2017 at 7% and is set to improve towards 12% by 2019, driven by tax-advantaged organic growth.
Low leverage improves financial flexibility, strong FCF outlook
Rosneft’s net debt (including prepayments) declined to $68bn as of end-3Q18, a reduction of 9% QoQ and 18% YoY, reflecting an adjusted net debt/adjusted EBITDA ratio of just 2.2x, down from 3.4x as of end-2017. 3Q18 saw FCF to equity of $6.2bn, and we forecast FCF to equity of $1.7bn in 4Q18 and $8.9bn in 2019 using our $65/bl Brent oil price forecast for next year, which reflects a 2019 FCF yield of 13.1%.
Headline net income understates true earnings power
Rosneft’s reported accounting earnings during 2015-2019 are depressed by noncash FX-related matters, which we estimate will affect 2019 net income and dividends by 26% (as Rosneft’s dividends are based on a 50% payout of reported net income). As this effect disappears in 2020 we forecast a significantly improved reported net income, leading to a 2020 dividend of RUB46.2/share, a yield of 10.9%.
Company update
BUY (maintained)
TP: RUB550 (maintained)
Oil & Gas
Russia
Report date: |
14 December 2018 |
|
Current price, RUB |
|
425.6 |
Upside/downside, % |
|
29.2 |
MktCap, $mn |
|
67,878.4 |
Average daily volume, RUBmn |
1,897.3 |
|
Free float, RUBmn |
|
484,820.1 |
Bloomberg |
|
ROSN RX |
|
|
|
Summary valuation and financials, RUBbn (unless otherwise stated)
|
|
2017 |
2018E |
2019E |
2020E |
|
Revenue |
6,014 |
8,265 |
8,171 |
8,203 |
||
EBITDA |
1,209 |
1,994 |
2,144 |
2,264 |
||
|
|
|
|
|
||
Net income |
222 |
632 |
771 |
980 |
||
Net debt |
4,734 |
4,507 |
4,334 |
4,248 |
||
|
|
|
|
|
||
EPS, RUB |
21.0 |
59.6 |
72.8 |
92.4 |
||
DPS, RUB |
10.5 |
29.8 |
36.4 |
46.2 |
||
EV/Sales, x |
1.5 |
1.1 |
1.1 |
1.1 |
||
EV/EBITDA, x |
7.6 |
4.6 |
4.3 |
4.0 |
||
P/E, x |
20.3 |
7.1 |
5.8 |
4.6 |
||
Net debt/EBITDA, x |
3.9 |
2.3 |
2.0 |
1.9 |
||
Dividend yield, % |
2 |
|
7 |
9 |
11 |
|
FCF yield, % |
-1 |
15 |
13 |
12 |
||
RoIC, % |
7.2 |
11.9 |
12.6 |
11.9 |
||
Source: Company data, Renaissance Capital estimates |
||||||
Figure 45: Price performance – 52 weeks |
|
|||||
RUB |
|
|
ROSN RX |
|
|
|
|
|
|
|
|||
600 |
|
|
|
|
|
|
|
|
|
|
|
|
500 |
|
|
|
|
|
|
|
|
|
|
|
|
400 |
|
|
|
|
|
|
|
|
|
|
|
|
300 |
|
|
|
|
|
|
|
|
|
|
|
|
200 |
Jan-18 |
Feb-18 |
Mar-18 |
Apr-18 |
May-18 |
Jun-18 |
Jul-18 |
|
|
Oct-18 |
|
|
Dec-17 |
Aug-18 |
Sep-18 |
Nov-18 |
Dec-18 |
Source: Bloomberg
vk.com/id446425943
Renaissance Capital
14 December 2018
Rosneft
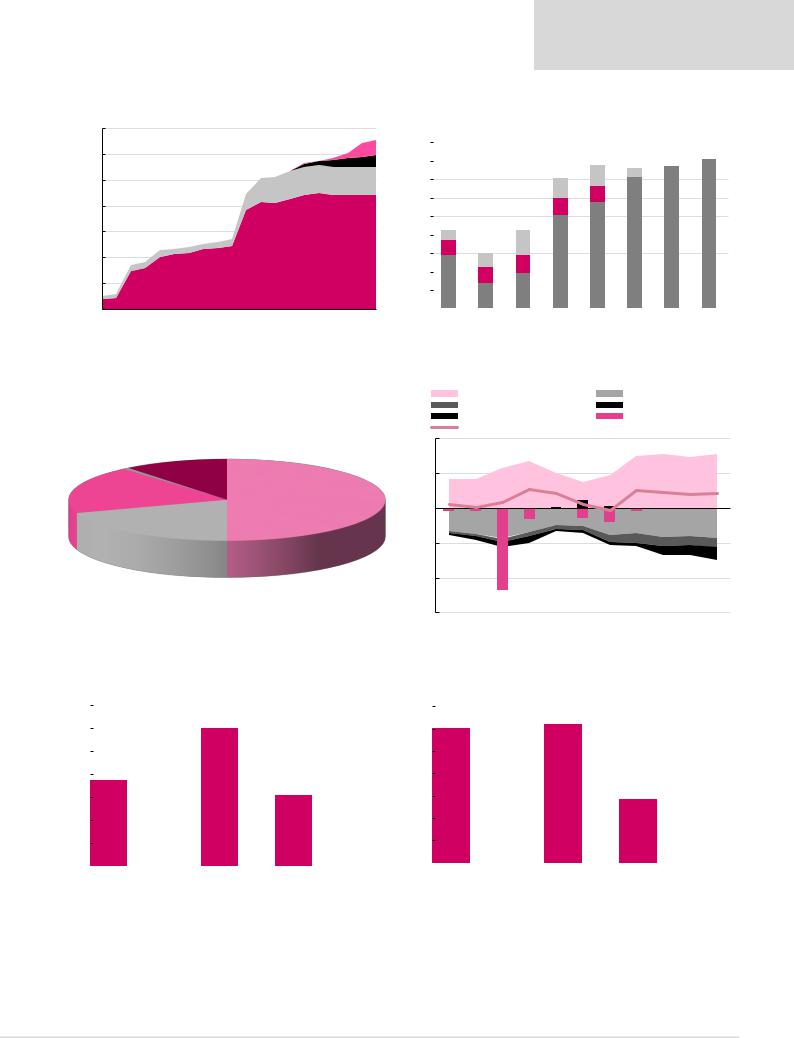
Figure 46: Rosneft – production outlook, kboe/d |
Figure 47: Rosneft net income – reported vs underlying, $bn |
|
Pre-2017 oil producing assets |
|
Pre-2017 gas producing assets |
|
|
||
|
|
||
|
Oil greenfields |
|
Gas greenfields |
|
|
||
|
|
7,000 |
|
|
|
|
|
|
|
6,000 |
|
|
|
|
|
|
|
5,000 |
|
|
|
|
|
|
|
4,000 |
|
|
|
|
|
|
|
3,000 |
|
|
|
|
|
|
|
2,000 |
|
|
|
|
|
|
|
1,000 |
|
|
|
|
|
|
|
- |
|
|
|
|
|
|
|
2003 |
2005 |
2007 |
2009 |
2011 |
2013 |
2015 |
2017E 2019E 2021E |
|
|
Reported net income |
|
|
|
Impact of hedge accounting |
||||||
|
|
|
|
|||||||||
|
|
|
|
|||||||||
18 |
|
FX impact from prepayments |
|
|
|
|
|
|
||||
|
|
|
|
|
|
|
||||||
|
|
|
|
|
|
|
||||||
|
|
|
|
|
|
|
|
|
|
|
||
|
|
|
|
|
|
|
|
|
|
|||
16 |
|
|
|
|
|
|
|
|
|
|
|
|
|
|
|
|
2 |
|
15 |
16- |
|||||
14 |
|
|
|
|
|
1 |
||||||
|
|
|
|
|
|
|||||||
12 |
|
|
|
|
2 |
2 |
14 |
|
|
|||
|
|
|
|
2 |
|
|
|
|||||
10 |
|
|
|
|
12 |
|
|
|
||||
|
|
|
|
10 |
|
|
|
|||||
8 |
|
|
|
|
|
|
|
|
|
|
||
|
1 |
|
3 |
|
|
|
|
|
|
|
||
|
|
|
|
|
|
|
|
|
|
|||
6 |
|
2 |
2 |
2 |
|
|
|
|
|
|
|
|
4 |
|
6 |
|
|
|
|
|
|
|
|||
|
|
2 |
4 |
|
|
|
|
|
|
|
||
|
|
|
|
|
|
|
|
|
|
|||
2 |
|
|
|
|
|
|
|
|
|
|
||
|
|
3 |
|
|
|
|
|
|
|
|
||
|
|
|
|
|
|
|
|
|
|
|
||
- |
|
|
|
|
|
|
|
|
|
|
|
|
2015 |
2016 |
2017 |
2018E |
2019E |
2020E |
2021E |
2022E |
|||||
|
|
|||||||||||
Source: Company data, Renaissance Capital estimates |
Source: Company data, Renaissance Capital estimates |
Figure 48: Rosneft current shareholding structure |
|
Figure 49: Rosneft – sources and uses of funds, $bn |
|||||||
|
|
|
|
CFFO |
|
|
|
|
Capex and investments |
|
|
|
|
Interest |
|
|
|
|
Dividends |
|
|
|
|
Divestments |
|
|
|
Acquisitions |
|
|
|
|
|
FCF to equity |
|
|
|
|
|
Glencore |
|
|
40 |
|
|
|
|
|
|
|
|
|
|
|
|
|
|
|
|
0.6% |
|
|
|
|
|
|
|
|
|
Qatar |
Other |
|
20 |
|
|
|
|
|
|
Investment |
10.8% |
|
|
|
|
|
|
|
|
Authority |
|
Rosneftegaz |
|
|
|
|
|
|
|
18.9% |
|
50.0% |
- |
|
|
|
|
|
|
|
BP |
|
|
|
|
|
|
|
|
|
19.7% |
|
|
|
|
|
|
|
|
|
|
|
(20) |
|
|
|
|
|
|
|
|
|
(40) |
|
|
|
|
|
|
|
|
|
(60) |
|
|
|
|
|
|
|
|
|
2011 |
2012 |
2013 |
2014 |
2015 |
2016 |
2017 2018E 2019E 2020E 2021E |
|
|
Source: Company data |
|
|
|
|
|
Source: Company data, Renaissance Capital estimates |
|
|
|
|
|
|
|
|
|
||
Figure 50: Rosneft – FCF bridge 2018E, $bn |
|
Figure 51: Rosneft – FCF bridge 2019E, $bn |
|
||||||
35 |
|
|
|
|
|
|
|
|
|
35 |
|
|
|
|
|
|
|
|
|
|
30 |
|
|
|
|
|
|
|
|
|
30 |
|
|
|
|
|
|
|
|
|
|
|
|
|
|
|
|
|
|
|
|
|
|
|
|
|
|
|
|
|
||
|
|
|
|
|
|
|
|
|
|
|
|
|
|
|
|
|
|
|
||
25 |
|
|
|
|
|
|
|
|
|
25 |
|
|
|
|
|
|
|
|
|
|
|
|
|
|
|
|
|
|
|
|
|
|
|
|
|
|
|
|
|
||
20 |
|
|
|
|
|
|
|
|
|
20 |
|
|
|
|
|
|
|
|
|
|
|
|
|
|
|
|
|
|
|
|
|
|
|
|
|
|
|
|
|
||
15 |
|
|
|
|
|
|
|
|
|
15 |
|
|
|
|
|
|
|
|
|
|
10 |
|
|
|
|
|
|
|
|
|
10 |
|
|
|
|
|
|
|
|
|
|
|
|
|
|
|
|
|
|
|
|
|
|
|
|
|
|
|
|
|
||
5 |
|
|
|
|
|
|
|
|
|
5 |
|
|
|
|
|
|
|
|
|
|
|
|
|
|
|
|
|
|
|
|
|
|
|
|
|
|
|
|
|
||
- |
|
|
|
|
|
|
|
|
|
- |
|
|
|
|
|
|
|
|
|
|
|
|
|
|
|
|
|
|
|
CFFO 2018 |
WC |
Other |
CFFO 2019 |
|
Capex |
FCF 2019 |
Interest |
Dividends 2019 |
|||
CFFO 2017 |
WC |
Other |
CFFO 2018 |
Capex |
FCF 2018 |
Interest |
Dividends 2018 |
|
||||||||||||
|
|
|||||||||||||||||||
|
|
|
||||||||||||||||||
|
|
|
|
|
Source: Company data, Renaissance Capital estimates |
|
|
|
|
|
Source: Company data, Renaissance Capital estimates |
|||||||||
32

vk.com/id446425943
Renaissance Capital
14 December 2018
Rosneft
Figure 52: Rosneft – operating and financial summary
Operating statistics |
2013 |
2014 |
2015 |
2016 |
2017 |
2018E |
2019E |
2020E |
Crude oil production, mnt |
191 |
208 |
205 |
213 |
227 |
233 |
234 |
237 |
Gas production, bcm |
38.2 |
56.7 |
62.5 |
67.1 |
68.4 |
67.6 |
72.0 |
80.0 |
Total hydrocarbon production, mn boe |
1,619 |
1,849 |
1,867 |
1,948 |
2,060 |
2,096 |
2,133 |
2,202 |
Refining throughput, mnt |
87 |
97 |
95 |
98 |
109 |
113 |
113 |
113 |
|
|
|
|
|
|
|
|
|
Income statement, RUBbn (unless otherwise stated) |
2013 |
2014 |
2015 |
2016 |
2017 |
2018E |
2019E |
2020E |
Gross revenue |
4,694 |
5,503 |
5,150 |
4,988 |
6,014 |
8,265 |
8,171 |
8,203 |
Operating expenses |
(4,139) |
(4,910) |
(4,442) |
(4,326) |
(5,391) |
(6,910) |
(6,705) |
(6,669) |
EBITDA |
947 |
1,057 |
1,158 |
1,144 |
1,209 |
1,994 |
2,144 |
2,264 |
EBITDA margin |
20% |
19% |
22% |
23% |
20% |
24% |
26% |
28% |
EBIT |
555 |
593 |
708 |
662 |
623 |
1,355 |
1,466 |
1,534 |
EBIT margin |
12% |
11% |
14% |
13% |
10% |
16% |
18% |
19% |
Financial items |
81 |
(115) |
(248) |
(345) |
(229) |
(397) |
(325) |
(133) |
Profit before tax |
636 |
478 |
460 |
317 |
394 |
959 |
1,141 |
1,401 |
Net income |
549 |
348 |
355 |
181 |
222 |
632 |
771 |
980 |
Average number of shares outstanding, mn |
9,416 |
10,598 |
10,598 |
10,598 |
10,598 |
10,598 |
10,598 |
10,598 |
EPS, $ per share |
58.34 |
32.84 |
33.48 |
17.08 |
20.98 |
59.63 |
72.78 |
92.42 |
DPS, RUB per share |
12.85 |
8.21 |
11.75 |
5.98 |
10.48 |
29.82 |
36.39 |
46.21 |
Payout ratio, % |
22.0 |
25.0 |
35.1 |
35.0 |
50.0 |
50.0 |
50.0 |
50.0 |
|
|
|
|
|
|
|
|
|
Growth rates, % |
|
|
|
|
|
|
|
|
Total hydrocarbon production |
64.0 |
14.2 |
1.0 |
4.3 |
5.7 |
1.8 |
1.8 |
3.2 |
Revenue |
54.0 |
17.2 |
(6.4) |
(3.1) |
20.6 |
37.4 |
(1.1) |
0.4 |
EPS |
57.0 |
(53.3) |
(36.1) |
(53.4) |
41.1 |
165.4 |
14.4 |
22.7 |
DPS |
59.7 |
(36.1) |
43.1 |
(49.1) |
75.3 |
184.5 |
22.0 |
27.0 |
|
|
|
|
|
|
|
|
|
Balance sheet, RUBbn |
2013 |
2014 |
2015 |
2016 |
2017 |
2018E |
2019E |
2020E |
Current assets |
1,455 |
2,131 |
2,404 |
2,300 |
2,292 |
2,383 |
2,541 |
2,675 |
Non-current assets |
6,083 |
6,605 |
7,234 |
8,727 |
9,935 |
10,233 |
10,599 |
10,924 |
Total assets |
7,538 |
8,736 |
9,638 |
11,027 |
12,227 |
12,616 |
13,140 |
13,599 |
Current liabilities |
1,415 |
2,031 |
1,817 |
2,773 |
3,836 |
3,126 |
3,040 |
3,034 |
Long-term liabilities |
2,958 |
3,824 |
4,829 |
4,530 |
4,208 |
5,048 |
5,238 |
5,316 |
Minorities |
39 |
9 |
43 |
417 |
564 |
683 |
824 |
966 |
Equity |
3,126 |
2,872 |
2,949 |
3,307 |
3,619 |
3,758 |
4,037 |
4,283 |
Total equity and liabilities |
7,538 |
8,736 |
9,638 |
11,027 |
12,227 |
12,616 |
13,140 |
13,599 |
|
|
|
|
|
|
|
|
|
Cash-flow statement, RUBbn |
2013 |
2014 |
2015 |
2016 |
2017 |
2018E |
2019E |
2020E |
Net income |
549 |
348 |
355 |
181 |
222 |
632 |
771 |
980 |
DD&A |
392 |
464 |
450 |
482 |
586 |
639 |
678 |
729 |
Other |
368 |
743 |
1,180 |
40 |
(289) |
384 |
231 |
(52) |
Changes in working capital |
(100) |
(21) |
192 |
(91) |
(182) |
(193) |
(16) |
(36) |
Cash flow from operations |
1,209 |
1,534 |
2,177 |
612 |
337 |
1,462 |
1,664 |
1,622 |
Cash flow used for investments |
(2,220) |
(979) |
(813) |
(973) |
(1,162) |
(1,055) |
(1,157) |
(1,171) |
Cash flow used for/from financing |
965 |
(774) |
(1,091) |
692 |
381 |
(567) |
(279) |
(346) |
Effect of exchange rate changes |
15 |
68 |
52 |
(120) |
(24) |
- |
- |
- |
Cash flow for the year |
(31) |
(151) |
325 |
211 |
(468) |
(161) |
228 |
105 |
|
|
|
|
|
|
|
|
|
Key data |
2013 |
2014 |
2015 |
2016 |
2017 |
2018E |
2019E |
2020E |
Net debt/(cash), RUBbn |
2,322 |
3,433 |
4,874 |
4,327 |
4,734 |
4,507 |
4,334 |
4,248 |
Net debt/equity, % |
74.3 |
119.5 |
165.3 |
130.8 |
130.8 |
119.9 |
107.4 |
99.2 |
Days receivables |
32 |
37 |
26 |
35 |
51 |
37 |
35 |
35 |
Days payables |
43 |
37 |
39 |
49 |
66 |
63 |
60 |
60 |
RoE, % |
18.1 |
17.7 |
14.3 |
5.0 |
6.1 |
17.6 |
19.5 |
23.2 |
RoIC, % |
9.2 |
7.5 |
8.8 |
7.7 |
7.2 |
11.9 |
12.6 |
11.9 |
RoACE, % |
13.8 |
7.9 |
8.8 |
5.5 |
5.8 |
11.9 |
13.1 |
14.0 |
Source: Company data, Renaissance Capital estimates
33