


vk.com/id446425943
Gazprom
Our BUY rating on Gazprom reflects what we view as a disconnect between the company’s share price performance and a visible improvement in both its main profit-generating business (European gas sales) and the value of its subsidiaries and associates. We estimate Gazprom trades at a 64% discount to our SoTP valuation and our 5%-higher RUB230 TP implies 45% upside potential over the next 12 months. Our continuing positive outlook on the Russian oil sector makes Gazprom, in our view, a cheaper and more liquid way to own Gazprom Neft, which we consider one of the fastest-growing Russian oil producers and one of the main beneficiaries of recent tax reforms. Additional upside potential comes from a likely higher dividend for 2018.
External factors have improved significantly
The European gas price outlook has improved significantly vs 12 months ago, driven by stronger consumption, declining indigenous production and lower LNG imports, which also helps Gazprom’s volumes. Gazprom’s share in the domestic market has also stopped declining, given delayed gas production growth by Rosneft, Gazprom’s main domestic rival. In addition, the value of Gazprom’s subsidiaries and associates have grown substantially over the past 12 months, with Gazprom’s stakes in listed
Gazprom Neft and NOVATEK now accounting for 33% of its EV (and 53% of market cap), on our estimates.
An attractive entry-point to own Gazprom Neft
Given the 30% underperformance of Gazprom vs Gazprom Neft in the past 12 months, we calculate Gazprom’s 96% stake in Gazprom Neft is now worth $25bn and accounts for 44% of Gazprom’s current market cap. Given our continuing positive outlook on the Russian oil sector, we think Gazprom represents a cheaper and more liquid way to own Gazprom Neft, which we consider the fastest-growing Russian oil producer and one of the main beneficiaries of recent tax reforms.
Dividend upside
Gazprom management recently proposed to unfreeze 2018 dividends. Previously, the company had guided for its dividend to remain flat at RUB8.04/share until 2020. A flat RUB8.04/share dividend (a yield of 5.1%) would represent a payout ratio of just
14%, as we expect Gazprom’s profits to rise by 92% in 2018 on higher gas sales. A hypothetical 25% dividend payout ratio would produce a double-digit dividend of RUB15.5/share, a yield of 9.8%. This would double to 19.5% if a 50% dividend payout ratio were used.
Company update
BUY (maintained)
TP: RUB230 (previously RUB220)
Oil & Gas Russia
Report date: |
14 December 2018 |
|
Current price, RUB |
|
158.6 |
Upside/downside, % |
|
45.0 |
MktCap, $mn |
|
56,510.9 |
Average daily volume, RUBmn |
4,644.2 |
|
Free float, RUBmn |
|
1,064,436.7 |
Bloomberg |
|
GAZP RX |
|
|
|
Summary valuation and financials, RUBbn (unless otherwise stated)
|
2017 |
2018E |
2019E |
2020E |
|
Revenue |
6,546 |
8,107 |
8,095 |
8,337 |
|
EBITDA |
1,484 |
2,517 |
2,051 |
2,153 |
|
Net income |
714 |
|
1,369 |
1,150 |
1,165 |
Net debt |
2,034 |
2,324 |
2,740 |
3,115 |
|
EPS, RUB |
32.3 |
61.9 |
52.0 |
52.7 |
|
DPS, RUB |
8.0 |
|
10.4 |
13.0 |
13.2 |
EV/Sales, x |
0.9 |
|
0.7 |
0.8 |
0.7 |
EV/EBITDA, x |
4.1 |
|
2.4 |
3.0 |
2.8 |
P/E, x |
5.3 |
|
2.7 |
3.3 |
3.2 |
Net debt/EBITDA, x |
1.4 |
|
0.9 |
1.3 |
1.4 |
Dividend yield, % |
5.1 |
|
6.6 |
8.2 |
8.3 |
FCF yield, % |
-6 |
|
-9 |
-6 |
-3 |
RoIC, % |
5.6 |
|
10.4 |
7.0 |
7.0 |
Source: Company data, Renaissance Capital estimates |
|||||
Figure 85: Price performance – 52 weeks |
|
||||
RUB |
|
GAZP RX |
|
|
|
|
|
|
|||
200 |
|
|
|
|
|
|
|
|
|
|
|
|
180 |
|
|
|
|
|
|
|
|
|
|
|
|
160 |
|
|
|
|
|
|
|
|
|
|
|
|
140 |
|
|
|
|
|
|
|
|
|
|
|
|
120 |
Jan-18 |
|
Mar-18 |
|
May-18 |
Jun-18 |
Jul-18 |
|
|
|
|
|
Dec-17 |
Feb-18 |
Apr-18 |
Aug-18 |
Sep-18 |
Oct-18 |
Nov-18 |
Dec-18 |
Source: Bloomberg
vk.com/id446425943
Renaissance Capital
14 December 2018
Gazprom
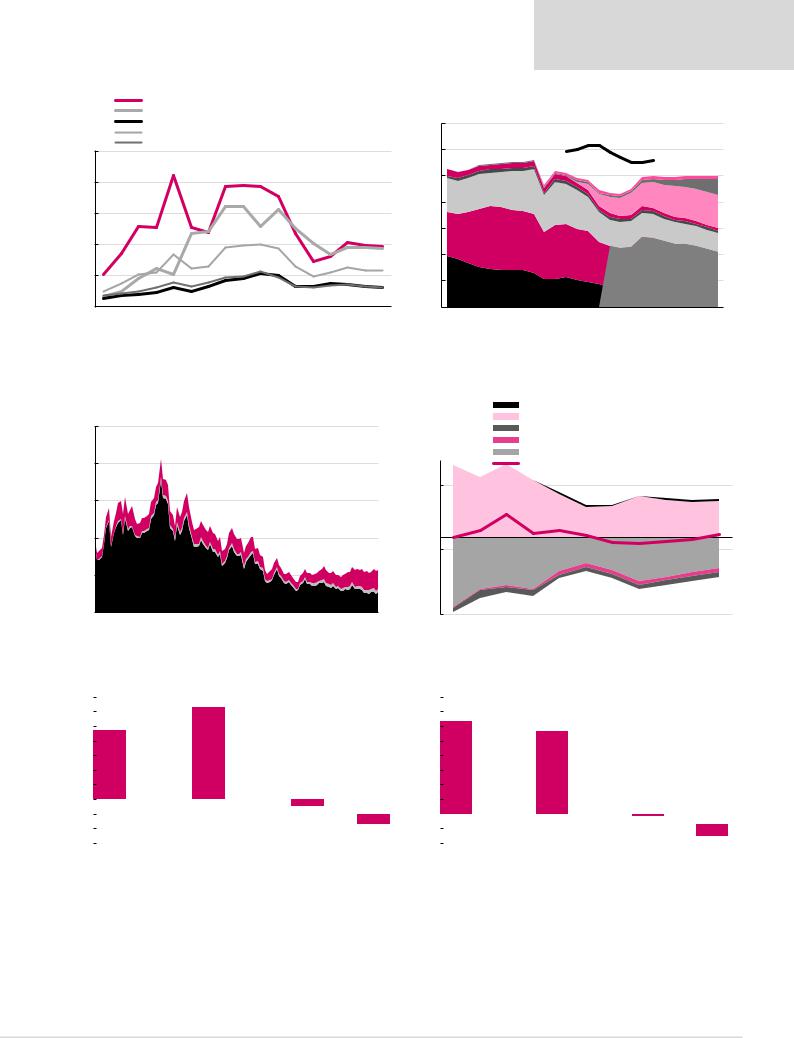
Figure 86: Gazprom netbacks, $/mcm |
Figure 87: Gazprom gas production balance, bcm pa |
|
Gazprom's netback from sales to Europe |
|
|
|
|
|
|
|
|
|
|
|
|
|
||||
|
Gazprom's netback from sales to FSU |
|
|
|
|
|
|
|
|
|
|
|
|
|
||||
|
Gazprom's netback from domestic sales |
|
|
|
700 |
|
|
|
|
|
|
|
|
|
||||
|
Gazprom's weighted average netback to the wellhead |
|
|
|
|
|
|
|
Reported maximum |
|
||||||||
|
NOVATEK's ex-field selling price |
|
|
|
|
|
|
|
|
|
|
|||||||
250 |
|
|
|
600 |
|
|
|
|
|
production capacity |
|
|||||||
|
|
|
|
|
|
|
|
|
|
|
|
|
|
|||||
200 |
|
|
|
|
|
|
|
|
500 |
|
|
|
|
|
|
|
|
|
|
|
|
|
|
|
|
|
|
|
|
|
|
|
|
|
|
|
|
|
|
|
|
|
|
|
|
|
|
|
|
|
|
|
|
|
East Siberia |
|
|
|
|
|
|
|
|
|
|
400 |
|
|
|
|
|
|
|
|
|
150 |
|
|
|
|
|
|
|
|
|
|
|
|
|
|
|
|
Yamal |
|
|
|
|
|
|
|
|
|
|
300 |
|
|
|
|
|
|
|
|
|
100 |
|
|
|
|
|
|
|
|
|
Gazprom dobycha Yamburg |
|
|
Other Nadym-Pur-Taz |
|||||
|
|
|
|
|
|
|
|
200 |
|
|
|
|
|
|
||||
|
|
|
|
|
|
|
|
|
|
|
|
|
|
|
|
|
|
|
50 |
|
|
|
|
|
|
|
|
100 |
|
|
|
|
|
Main legacy fields in West Siberia |
|||
|
|
|
|
|
|
|
|
|
Gazprom dobycha Urengoi |
|
(Gazprom stopped reporting |
|||||||
|
|
|
|
|
|
|
|
|
|
|
||||||||
|
|
|
|
|
|
|
|
|
|
|
|
|
|
|
|
breakdown from 2015) |
||
- |
|
|
|
|
|
|
|
|
- |
|
|
|
|
|
|
|
|
|
2004 |
2006 |
2008 |
2010 |
2012 |
2014 |
2016 |
2018E |
2020E |
|
2000 |
2003 |
2006 |
2009 |
2012 |
2015 |
2018E |
2021E |
2024E |
Source: Renaissance Capital estimates |
Source: Company data, Renaissance Capital estimates |
Figure 88: Gazprom’s stakes in Gazprom Neft and NOVATEK account for over 50% of its current market capitalisation, $bn
Figure 89: We expect Gazprom’s FCF will fall below zero during 2017-2019 as capex mounts, $bn
|
Gazprom rump |
|
10% in NOVATEK |
|
96% in Gazprom Neft |
|
|
|
|||
|
|
|
250 |
|
|
|
|
|
|
|
|
|
|
200 |
|
|
|
|
|
|
|
|
|
|
|
|
|
|
|
|
|
|
|
|
40 |
150 |
|
|
|
|
|
|
|
|
|
|
100 |
|
|
|
|
|
|
|
|
|
|
|
|
|
|
|
|
|
|
|
|
(10) |
50 |
|
|
|
|
|
|
|
|
|
|
- |
|
|
|
|
|
|
|
|
|
(60) |
2008 |
2009 |
2010 |
2011 |
2012 |
2013 |
2014 |
2015 |
2016 |
2017 |
2018 |
|
|
|
Divestments and dividends received |
|||
|
|
|
CFFO |
|
|
|
|
|
|
Dividends |
|
|
|
|
|
|
Interest |
|
|
|
|
|
|
Capex and investments |
|||
|
|
|
FCF to equity |
|
|
|
2011 |
2012 |
2013 |
2014 |
2015 |
2016 |
2017 2018E 2019E 2020E 2021E |
Source: Thomson Reuters Datastream Source: Company data, Renaissance Capital estimates
Figure 90: Gazprom – FCF bridge 2018E, $bn |
|
|
|
|
|
Figure 91: Gazprom – FCF bridge 2019E, $bn |
|
|
|
|
|
|||||||||||
35 |
|
|
|
|
|
|
|
|
|
|
40 |
|
|
|
|
|
|
|
|
|
|
|
|
|
|
|
|
|
|
|
|
|
|
|
|
|
|
|
|
|
|
|
|||
30 |
|
|
|
|
|
|
|
|
|
|
35 |
|
|
|
|
|
|
|
|
|
|
|
|
|
|
|
|
|
|
|
|
|
|
|
|
|
|
|
|
|
|
|
|||
|
|
|
|
|
|
|
|
|
|
|
|
|
|
|
|
|
|
|
|
|||
25 |
|
|
|
|
|
|
|
|
|
|
30 |
|
|
|
|
|
|
|
|
|
|
|
|
|
|
|
|
|
|
|
|
|
|
|
|
|
|
|
|
|
|
|
|||
|
|
|
|
|
|
|
|
|
|
|
|
|
|
|
|
|
|
|
|
|||
20 |
|
|
|
|
|
|
|
|
|
|
25 |
|
|
|
|
|
|
|
|
|
|
|
|
|
|
|
|
|
|
|
|
|
|
|
|
|
|
|
|
|
|
|
|||
15 |
|
|
|
|
|
|
|
|
|
|
20 |
|
|
|
|
|
|
|
|
|
|
|
|
|
|
|
|
|
|
|
|
|
|
|
|
|
|
|
|
|
|
|
|||
10 |
|
|
|
|
|
|
|
|
|
|
15 |
|
|
|
|
|
|
|
|
|
|
|
|
|
|
|
|
|
|
|
|
|
|
|
|
|
|
|
|
|
|
|
|||
5 |
|
|
|
|
|
|
|
|
|
|
10 |
|
|
|
|
|
|
|
|
|
|
|
|
|
|
|
|
|
|
|
|
|
|
|
|
|
|
|
|
|
|
|
|||
- |
|
|
|
|
|
|
|
|
|
|
5 |
|
|
|
|
|
|
|
|
|
|
|
|
|
|
|
|
|
|
|
|
|
|
|
|
|
|
|
|
|
|
|
|||
(5) |
|
|
|
|
|
|
|
|
|
|
- |
|
|
|
|
|
|
|
|
|
|
|
|
|
|
|
|
|
|
|
|
|
|
|
|
|
|
|
|
|
|
|
|||
(10) |
|
|
|
|
|
|
|
|
|
|
(5) |
|
|
|
|
|
|
|
|
|
|
|
|
|
|
|
|
|
|
|
|
|
|
|
|
|
|
|
|
|
|
|
|||
|
|
|
|
|
|
|
|
|
|
|
|
|
|
|
|
|
|
|
|
|||
(15) |
|
|
|
|
|
|
|
|
|
|
(10) |
|
|
|
|
|
|
|
|
|
|
|
CFFO 2017 |
WC |
Other |
CFFO 2018 |
Dividends received |
Capex |
FCF 2018 |
Interest |
Dividends 2018 |
CFFO 2018 |
WC |
Other |
CFFO 2019 |
Dividends received |
Capex |
FCF 2019 |
Interest |
Dividends 2019 |
|||||
|
|
|||||||||||||||||||||
|
|
|
|
|
Source: Company data, Renaissance Capital estimates |
|
|
|
|
|
Source: Company data, Renaissance Capital estimates |
|||||||||||
47

vk.com/id446425943
Renaissance Capital
14 December 2018
Gazprom
Figure 92: Gazprom – operating and financial summary
Operating statistics |
2013 |
2014 |
2015 |
2016 |
2017 |
2018E |
2019E |
2020E |
Liquids production, mnt |
15 |
15 |
14 |
14 |
16 |
16 |
16 |
17 |
Gas production, bcm |
474 |
434 |
424 |
422 |
450 |
493 |
497 |
494 |
Total hydrocarbon production, mn boe |
2,898 |
2,660 |
2,601 |
2,583 |
2,765 |
3,016 |
3,040 |
3,030 |
|
|
|
|
|
|
|
|
|
Income statement, RUBbn |
2013 |
2014 |
2015 |
2016 |
2017 |
2018E |
2019E |
2020E |
Gross revenue |
5,250 |
5,590 |
6,073 |
6,111 |
6,546 |
8,107 |
8,095 |
8,337 |
Operating expenses |
(3,663) |
(4,279) |
(4,845) |
(5,385) |
(5,676) |
(6,277) |
(6,758) |
(6,909) |
EBITDA |
2,006 |
1,783 |
1,744 |
1,297 |
1,484 |
2,517 |
2,051 |
2,153 |
EBITDA margin |
38% |
32% |
29% |
21% |
23% |
31% |
25% |
26% |
EBIT |
1,587 |
1,310 |
1,228 |
726 |
871 |
1,830 |
1,337 |
1,427 |
EBIT margin |
30% |
23% |
20% |
12% |
13% |
23% |
17% |
17% |
Financial items |
(90) |
(1,004) |
(303) |
560 |
147 |
51 |
189 |
118 |
Profit before tax |
1,497 |
307 |
925 |
1,285 |
1,018 |
1,881 |
1,526 |
1,545 |
Net income |
1,151 |
159 |
787 |
952 |
714 |
1,369 |
1,150 |
1,165 |
Average number of shares outstanding, mn |
22,900 |
23,000 |
22,948 |
22,600 |
22,100 |
22,101 |
22,101 |
22,101 |
EPS, RUB per share |
50.2 |
6.9 |
34.3 |
42.1 |
32.3 |
61.9 |
52.0 |
52.7 |
DPS, RUB per share |
7.2 |
7.2 |
7.9 |
8.0 |
8.0 |
10.4 |
13.0 |
13.2 |
Payout ratio, % |
14.3 |
104.1 |
23.0 |
19.1 |
24.9 |
16.8 |
25.0 |
25.0 |
|
|
|
|
|
|
|
|
|
Growth rates, % |
|
|
|
|
|
|
|
|
Total hydrocarbon production |
(1.3) |
(8.2) |
(2.2) |
(0.7) |
7.0 |
9.1 |
0.8 |
(0.3) |
Revenue |
10.1 |
6.5 |
8.6 |
0.6 |
7.1 |
23.8 |
(0.1) |
3.0 |
EPS |
(2.5) |
(86.2) |
396.1 |
22.8 |
(23.2) |
91.6 |
(16.0) |
1.3 |
DPS |
20.2 |
- |
9.6 |
1.9 |
0.0 |
29.4 |
25.1 |
1.3 |
|
|
|
|
|
|
|
|
|
Balance sheet, RUBbn |
2013 |
2014 |
2015 |
2016 |
2017 |
2018E |
2019E |
2020E |
Current assets |
2,863 |
3,461 |
3,994 |
3,234 |
3,469 |
3,410 |
3,163 |
3,021 |
Non-current assets |
10,574 |
11,716 |
13,058 |
13,685 |
14,770 |
16,380 |
17,754 |
18,927 |
Total assets |
13,436 |
15,177 |
17,052 |
16,919 |
18,239 |
19,790 |
20,918 |
21,948 |
Current liabilities |
1,391 |
1,856 |
2,125 |
1,922 |
2,590 |
2,596 |
2,701 |
2,734 |
Long-term liabilities |
2,410 |
3,202 |
4,013 |
3,555 |
3,634 |
3,731 |
3,931 |
4,131 |
Minorities |
315 |
303 |
325 |
347 |
386 |
453 |
523 |
595 |
Equity |
9,320 |
9,817 |
10,590 |
11,095 |
11,629 |
13,011 |
13,762 |
14,489 |
Total equity and liabilities |
13,436 |
15,177 |
17,052 |
16,919 |
18,239 |
19,790 |
20,918 |
21,948 |
|
|
|
|
|
|
|
|
|
Cash-flow statement, RUBbn |
2013 |
2014 |
2015 |
2016 |
2017 |
2018E |
2019E |
2020E |
Net income |
1,151 |
159 |
787 |
952 |
714 |
1,369 |
1,150 |
1,165 |
DD&A |
419 |
472 |
515 |
572 |
613 |
687 |
714 |
726 |
Other |
512 |
1,005 |
573 |
(136) |
(284) |
115 |
(118) |
(47) |
Changes in working capital |
(284) |
70 |
156 |
184 |
143 |
(288) |
136 |
0 |
Cash flow from operations |
1,799 |
1,707 |
2,031 |
1,571 |
1,187 |
1,881 |
1,882 |
1,844 |
Cash flow used for investments |
(1,205) |
(1,546) |
(1,664) |
(1,446) |
(1,368) |
(2,103) |
(2,009) |
(1,843) |
Cash flow used for/from financing |
(117) |
(70) |
(138) |
(460) |
150 |
(230) |
(89) |
(177) |
Effect of exchange rate changes |
18 |
- |
92 |
(127) |
3 |
60 |
- |
- |
Cash flow for the year |
494 |
91 |
321 |
(462) |
(28) |
(392) |
(216) |
(176) |
|
|
|
|
|
|
|
|
|
Key data |
2013 |
2014 |
2015 |
2016 |
2017 |
2018E |
2019E |
2020E |
Net debt/(cash), RUBbn |
1,088 |
1,638 |
2,069 |
1,732 |
2,034 |
2,324 |
2,740 |
3,115 |
Net debt/equity, % |
11.7 |
16.7 |
19.5 |
15.6 |
17.5 |
17.9 |
19.9 |
21.5 |
Days receivables |
72 |
72 |
67 |
65 |
63 |
51 |
50 |
50 |
Days payables |
109 |
109 |
98 |
81 |
89 |
80 |
80 |
80 |
RoE, % |
12.3 |
1.6 |
7.4 |
8.6 |
6.1 |
10.5 |
8.4 |
8.0 |
RoIC, % |
12.7 |
9.7 |
8.6 |
5.2 |
5.6 |
10.4 |
7.0 |
7.0 |
RoACE, % |
11.2 |
1.5 |
6.4 |
7.4 |
5.5 |
9.2 |
7.4 |
7.9 |
Source: Company data, Renaissance Capital estimates
48
vk.com/id446425943
NOVATEK 


NOVATEK
Our fundamentally positive outlook for NOVATEK contrasts with its rich valuation and long-lead catalysts. The company’s refocusing towards longer-dated LNG projects means that its catalysts have become more long-term in nature, with future share price performance likely to reflect a de-risking of Arctic LNG-2 and other similar LNG projects as they pass their development milestones. Key in this respect is the FID on Arctic LNG-2 (2019), as well as the entry of additional shareholders into the project, which could allow for an early monetisation of value for NOVATEK. We remain enthusiastic about NOVATEK’s longterm growth prospects but see better immediate value elsewhere in the sector. We slightly increase our TP to RUB1,080 (from RUB1,070) and maintain our HOLD rating.
The future is bright, the future is liquid
We estimate NOVATEK will increase its total hydrocarbon production by 5.2% in 2019, helped by the ramp-up of the second and third trains of the Yamal LNG project (50.1% owned by NOVATEK). We believe the company can become a pre-eminent LNG producer globally, supported by abundant gas reserves, existing and future partnerships, developing technologies and government help. We calculate LNG will represent 27% of NOVATEK’s total hydrocarbon output in 2025. We see near-term milestones in the de-risking of the company’s next set of LNG projects, notably Arctic
LNG-2, with the entry of additional shareholders into the project possible during 2019, we think.
The lowest tax burden in the Russian oil & gas sector
NOVATEK stands out as having the lowest tax bill among the larger oil & gas companies in Russia, benefiting from low statutory MET rates on natural gas and gas condensate, as well as utilising other available exemptions. This ensures aboveaverage profitability and cash flows. While we estimate this makes NOVATEK potentially vulnerable to our view of a fiscal end-game scenario, we do not expect any substantial tax changes to affect the company’s profitability in the near term.
Premium valuation and low dividend yield
NOVATEK enjoys premium valuations, trading at a 2019E EV/EBITDA multiple of 12.3x, based on Bloomberg consensus estimates. We calculate its current dividend yield is just 1.4%, substantially below the sector average of 7.8%. Excluding our estimated values of the company’s stakes in various JVs and LNG projects, we calculate the underlying ‘core’ EV/EBITDA multiple at 9.5x, still a 107% premium to the sector average, which we attribute to the company’s better growth prospects and more favourable tax treatment.
Company update
HOLD (maintained)
TP: RUB1,080 (previously RUB1,070)
Oil & Gas Russia
Report date: |
14 December 2018 |
|
Current price, RUB |
|
1,100.6 |
Upside/downside, % |
|
-1.9 |
MktCap, $mn |
|
50,290.8 |
Average daily volume, RUBmn |
1,070.2 |
|
Free float, RUBmn |
|
674,966.2 |
Bloomberg |
|
NVTK RX |
|
|
|
Summary valuation and financials, RUBbn (unless otherwise stated)
|
|
2017 |
2018E |
2019E |
2020E |
|
Revenue |
583 |
817 |
836 |
824 |
||
EBITDA |
198 |
253 |
225 |
247 |
||
Net income |
156 |
156 |
224 |
256 |
||
Net debt |
97 |
|
99 |
94 |
(35) |
|
EPS, RUB |
51.8 |
51.7 |
74.4 |
84.7 |
||
DPS, RUB |
15.0 |
15.7 |
16.5 |
17.3 |
||
EV/Sales, x |
5.8 |
4.2 |
4.1 |
4.2 |
||
EV/EBITDA, x |
17.2 |
13.5 |
15.2 |
13.8 |
||
P/E, x |
21.2 |
21.3 |
14.8 |
13.0 |
||
Net debt/EBITDA, x |
0.5 |
0.4 |
0.4 |
-0.1 |
||
Dividend yield, % |
1.4 |
1.4 |
1.5 |
1.6 |
||
FCF yield, % |
4 |
|
4 |
2 |
5 |
|
RoIC, % |
32.9 |
37.5 |
26.8 |
29.4 |
||
Source: Company data, Renaissance Capital estimates |
||||||
Figure 93: Price performance – 52 weeks |
|
|||||
RUB |
|
|
NVTK RX |
|
|
|
|
|
|
|
|||
1,400 |
|
|
|
|
|
|
|
|
|
|
|
|
1,200 |
|
|
|
|
|
|
|
|
|
|
|
|
1,000 |
|
|
|
|
|
|
|
|
|
|
|
|
800 |
|
|
|
|
|
|
|
|
|
|
|
|
600 |
|
|
|
|
|
|
|
|
|
|
|
|
400 |
Jan-18 |
|
Mar-18 |
|
May-18 |
Jun-18 |
Jul-18 |
|
|
|
|
|
Dec-17 |
Feb-18 |
Apr-18 |
Aug-18 |
Sep-18 |
Oct-18 |
Nov-18 |
Dec-18 |
Source: Bloomberg
vk.com/id446425943 |
|
|
|
|
|
|
|
|
|
|
|
|
|
|
|
|
||||
|
|
|
|
|
|
|
|
|
|
|
|
|
|
|
|
|
Renaissance Capital |
|||
|
|
|
|
|
|
|
|
|
|
|
|
|
|
|
|
|
|
14 December 2018 |
||
|
|
|
|
|
|
|
|
|
|
|
|
|
|
|
|
|
|
|
NOVATEK |
|
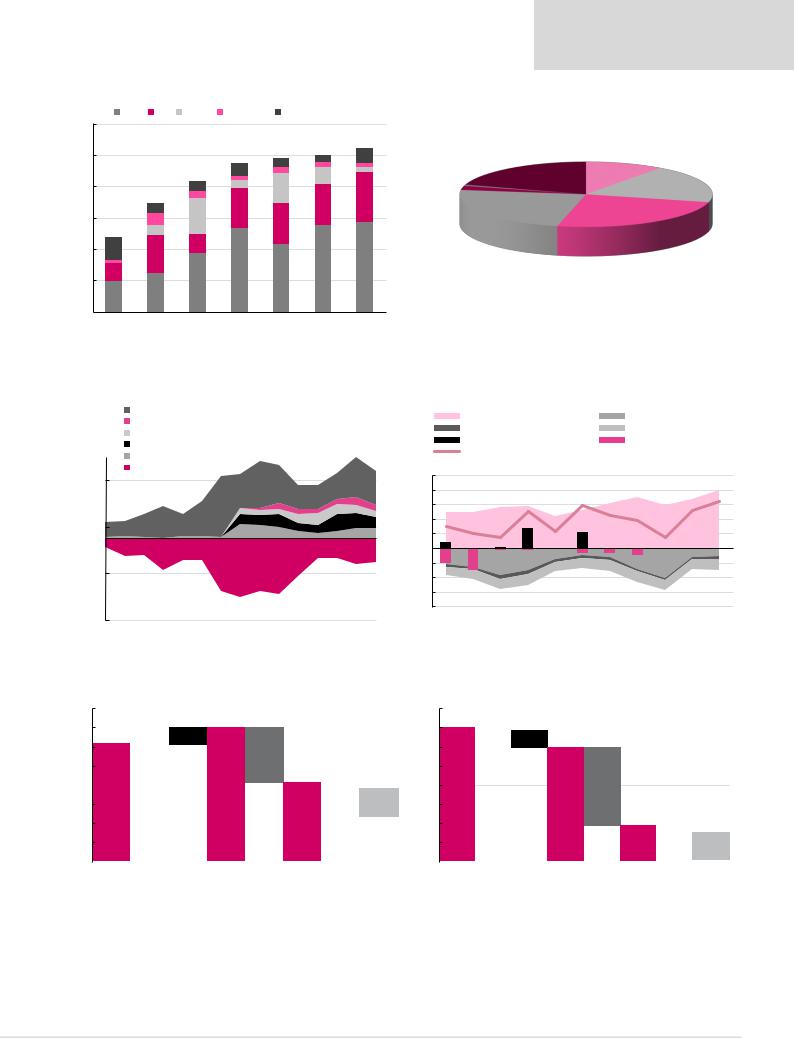
Figure 94: NOVATEK – tax take vs the rest of the sector, 2019 |
|
Figure 95: NOVATEK current shareholding structure |
|
|
|
|
||||||||||||||
|
MET |
ED |
Excise |
Other taxes |
Current income tax |
|
|
|
|
|
|
|
|
|
|
|
|
|||
60% |
|
|
|
|
|
|
|
|
|
|
|
|
|
|
|
|
|
|
|
|
|
|
|
|
|
|
|
|
|
|
Treasury |
|
|
|
|
Gazprom |
|
|
|||
50% |
|
|
|
|
|
|
|
2% |
5% |
|
|
|
|
|
10% |
|
|
|
||
|
|
|
|
|
|
3% |
1% |
|
|
|
|
|
|
|
|
|
||||
|
|
|
|
|
|
4% |
2% |
1% |
|
|
|
Free float |
|
|
|
|
|
|||
|
|
|
|
|
|
2% |
5% |
1% |
|
|
|
|
|
|
Total |
|
|
|||
|
|
|
|
|
|
1% |
|
|
|
|
|
|
20% |
|
|
|
|
|
||
40% |
|
|
|
3% |
|
3% |
10% |
|
|
Other |
|
|
|
|
|
|
19% |
|
|
|
|
|
|
|
|
|
16% |
|
|
|
|
|
|
|
|
|
|||||
|
|
|
|
2% |
|
|
|
13% |
management |
|
Timchenko |
|
Mikhelson |
|
|
|
||||
|
|
|
3% |
|
13% |
|
|
and affilated |
|
|
|
|
|
|||||||
30% |
|
|
12% |
|
|
|
|
23% |
|
25% |
|
|
|
|
||||||
|
|
4% |
|
|
13% |
|
|
parties |
|
|
|
|
|
|
|
|||||
|
|
|
3% |
|
|
|
|
|
|
|
|
|
|
|
|
|
|
|
||
|
|
|
|
|
|
|
|
|
2% |
|
|
|
|
|
|
|
|
|
|
|
|
|
|
|
6% |
|
|
|
|
|
|
|
|
|
|
|
|
|
|
|
|
20% |
7% |
|
|
|
|
|
|
|
|
|
|
|
|
|
|
|
|
|
|
|
|
12% |
|
|
|
|
|
|
|
|
|
|
|
|
|
|
|
|
|
||
|
1 |
|
|
|
|
|
|
|
|
|
|
|
|
|
|
|
|
|
|
|
|
|
|
|
|
|
|
|
|
|
|
|
|
|
|
|
|
|
|
|
|
|
0% |
|
|
|
27% |
|
28% |
29% |
|
|
|
|
|
|
|
|
|
|
|
|
|
6% |
|
|
|
22% |
|
|
|
|
|
|
|
|
|
|
|
||||
10% |
|
|
19% |
|
|
|
|
|
|
|
|
|
|
|
|
|
|
|
||
|
|
|
|
|
|
|
|
|
|
|
|
|
|
|
|
|
|
|||
|
10% |
|
12% |
|
|
|
|
|
|
|
|
|
|
|
|
|
|
|
|
|
|
|
|
|
|
|
|
|
|
|
|
|
|
|
|
|
|
|
|
|
|
0% |
|
|
|
|
|
|
|
|
|
|
|
|
|
|
|
|
|
|
|
|
|
NOVATEK |
|
Gazprom |
LUKOIL |
Tatneft Gazprom Neft |
Rosneft Surgutneftegas |
|
|
|
|
|
|
|
|
|
|
|
|||
Note: Tax take is calculated as Tax / (Sales – Purchases), |
|
|
|
|
|
|
|
|
|
|
|
|
|
|
|
|||||
|
|
|
|
|
|
Source: Company data, Renaissance Capital estimates |
|
|
|
|
|
|
|
|
Source: Company data |
|||||
Figure 96: Balancing tax advantages against lost gas export opportunities, $mn |
Figure 97: NOVATEK – sources and uses of funds, $bn |
|
|
|
||||||||||||||||
|
|
Total EBIT |
|
|
|
|
|
|
|
CFFO |
|
|
|
|
|
Capex and investments |
||||
|
|
Condensate - products export duty difference at Ust-Luga |
|
|
|
|
|
|
|
|||||||||||
|
|
|
|
Interest |
|
|
|
|
|
Dividends |
|
|
||||||||
|
Transport tariff lower than economically justifiable |
|
|
|
|
|
|
|
|
|
|
|||||||||
|
|
|
|
Divestments |
|
|
|
|
Acquisitions |
|
|
|||||||||
|
|
Gas MET difference |
|
|
|
|
|
|
|
|
|
|
|
|
||||||
|
|
|
|
|
|
|
|
FCF to equity |
|
|
|
|
|
|
|
|
||||
|
|
Condensate - crude MET difference |
|
|
|
|
|
|
|
|
|
|
|
|
||||||
|
|
|
|
|
|
|
|
|
|
|
|
|
|
|
|
|||||
|
|
Lost export opportunities due to Gazprom's monopoly |
|
5 |
|
|
|
|
|
|
|
|
|
|
||||||
2,500 |
|
|
|
|
|
|
|
|
|
|
|
|
|
|
|
|
|
|
|
|
|
|
|
|
|
|
|
|
|
4 |
|
|
|
|
|
|
|
|
|
|
|
|
|
|
|
|
|
|
|
|
|
|
|
|
|
|
|
|
|
|
|
|
|
|
|
|
|
|
|
|
|
|
3 |
|
|
|
|
|
|
|
|
|
|
500 |
|
|
|
|
|
|
|
|
|
2 |
|
|
|
|
|
|
|
|
|
|
|
|
|
|
|
|
|
|
|
1 |
|
|
|
|
|
|
|
|
|
|
|
|
|
|
|
|
|
|
|
|
|
|
|
|
|
|
|
|
|
|
|
|
|
|
|
|
|
|
|
|
|
|
- |
|
|
|
|
|
|
|
|
|
|
|
|
|
|
|
|
|
|
|
|
(1) |
|
|
|
|
|
|
|
|
|
|
(1,500) |
|
|
|
|
|
|
|
|
(2) |
|
|
|
|
|
|
|
|
|
|
|
|
|
|
|
|
|
|
|
|
|
|
|
|
|
|
|
|
|
|
|
|
|
|
|
|
|
|
|
|
|
|
(3) |
|
|
|
|
|
|
|
|
|
|
|
2005 |
2007 |
2009 |
2011 |
2013 |
2015 |
2017 |
2019E |
(4) |
2012 |
2013 |
2014 |
2015 |
2016 |
2017E |
2018E |
2019E |
2020E |
2021E |
|
|
2011 |
|||||||||||||||||||
(3,500) |
|
|
|
|
|
|
|
|
|
|
|
|
|
|
|
|
|
|
|
|
|
|
|
|
|
|
Source: Company data, Renaissance Capital estimates |
|
|
|
|
|
Source: Company data, Renaissance Capital estimates |
||||||||
Figure 98: NOVATEK – FCF bridge 2018E, $bn |
Figure 99: NOVATEK – FCF bridge 2019E, $bn |
|||||||||||
4.0 |
|
|
|
|
|
4.0 |
|
|
|
|
|
|
|
|
|
|
|
|
|
|
|
|
|
||
3.5 |
|
|
|
|
|
3.5 |
|
|
|
|
|
|
|
|
|
|
|
|
|
|
|
|
|
||
3.0 |
|
|
|
|
|
3.0 |
|
|
|
|
|
|
|
|
|
|
|
||||||||
|
|
|
|
|
|
|
|
|
|
|||
2.5 |
|
|
|
|
|
2.5 |
|
|
|
|
|
|
|
|
|
|
|
|
|
|
|
|
|||
2.0
 2.0
2.0
1.5 |
|
|
|
|
|
|
|
|
|
|
1.5 |
|
|
|
|
|
|
|
|
|
|
|
|
|
|
|
|
|
|
|
|
|
|
|
|
|
|
|
|
|
|
||||
1.0 |
|
|
|
|
|
|
|
|
|
|
1.0 |
|
|
|
|
|
|
|
|
|
|
|
|
|
|
|
|
|
|
|
|
|
|
|
|
|
|
|
|
|
|
||||
0.5 |
|
|
|
|
|
|
|
|
|
|
0.5 |
|
|
|
|
|
|
|
|
|
|
|
|
|
|
|
|
|
|
|
|
|
|
|
|
|
|
|
|
|
|
||||
- |
|
|
|
|
|
|
|
|
|
|
- |
|
|
|
|
|
|
|
|
|
|
|
|
CFFO 2017 |
WC |
Other |
CFFO 2018 |
Capex |
FCF 2018 |
Interest |
Dividends 2018 |
|
CFFO 2018 |
WC |
Other |
CFFO 2019 |
|
Capex |
FCF 2019 |
Interest |
Dividends 2019 |
||||
|
|
|
|
|
||||||||||||||||||
|
|
|
|
|
|
Source: Company data, Renaissance Capital estimates |
|
|
|
|
|
|
Source: Company data, Renaissance Capital estimates |
|||||||||
50
vk.com/id446425943
Renaissance Capital
14 December 2018
NOVATEK
Figure 100: NOVATEK – operating and financial summary
Operating statistics |
2013 |
2014 |
2015 |
2016 |
2017 |
2018E |
2019E |
2020E |
Liquids production, mnt |
5 |
6 |
9 |
12 |
12 |
12 |
12 |
12 |
Gas production, bcm |
61 |
62 |
68 |
66 |
63 |
69 |
73 |
66 |
Total hydrocarbon production, mn boe |
395 |
410 |
464 |
480 |
459 |
490 |
515 |
480 |
Refining throughput, mnt |
1 |
5 |
7 |
7 |
7 |
7 |
7 |
7 |
|
|
|
|
|
|
|
|
|
Income statement, RUBbn |
2013 |
2014 |
2015 |
2016 |
2017 |
2018E |
2019E |
2020E |
Gross revenue |
298 |
358 |
475 |
537 |
583 |
817 |
836 |
824 |
Operating expenses |
(193) |
(237) |
(335) |
(385) |
(420) |
(598) |
(644) |
(615) |
EBITDA |
119 |
138 |
160 |
187 |
198 |
253 |
225 |
247 |
EBITDA margin |
40% |
39% |
34% |
35% |
34% |
31% |
27% |
30% |
EBIT |
105 |
121 |
140 |
152 |
163 |
218 |
192 |
209 |
EBIT margin |
35% |
34% |
30% |
28% |
28% |
27% |
23% |
25% |
Financial items |
19 |
(82) |
(68) |
134 |
22 |
(8) |
65 |
83 |
Profit before tax |
137 |
53 |
93 |
308 |
201 |
225 |
272 |
307 |
Net income |
110 |
37 |
74 |
258 |
156 |
156 |
224 |
256 |
Average number of shares outstanding, m |
3,030 |
3,022 |
3,020 |
3,019 |
3,016 |
3,016 |
3,016 |
3,016 |
EPS, RUB per share |
36.3 |
12.3 |
24.6 |
85.4 |
51.8 |
51.7 |
74.4 |
84.7 |
DPS, RUB per share |
7.9 |
10.3 |
13.5 |
13.9 |
15.0 |
15.7 |
16.5 |
17.3 |
Payout ratio, % |
21.7 |
83.5 |
54.8 |
16.3 |
28.8 |
30.4 |
22.2 |
20.4 |
|
|
|
|
|
|
|
|
|
Growth rates, % |
|
|
|
|
|
|
|
|
Total hydrocarbon production |
3.4 |
0.7 |
(6.2) |
1.4 |
(4.3) |
6.6 |
5.2 |
(6.9) |
Revenue |
41.3 |
20.0 |
32.9 |
13.1 |
8.5 |
40.0 |
2.4 |
(1.5) |
EPS |
58.6 |
(66.0) |
99.6 |
246.7 |
(39.3) |
(0.4) |
44.0 |
13.8 |
DPS |
15.0 |
30.5 |
31.1 |
3.0 |
7.6 |
5.0 |
5.1 |
4.8 |
|
|
|
|
|
|
|
|
|
Balance sheet, RUBbn |
2013 |
2014 |
2015 |
2016 |
2017 |
2018E |
2019E |
2020E |
Current assets |
82 |
127 |
128 |
133 |
153 |
167 |
174 |
301 |
Non-current assets |
516 |
573 |
752 |
831 |
891 |
964 |
1,066 |
1,068 |
Total assets |
598 |
699 |
880 |
964 |
1,044 |
1,132 |
1,240 |
1,369 |
Current liabilities |
60 |
81 |
170 |
109 |
84 |
78 |
75 |
78 |
Long-term liabilities |
165 |
231 |
282 |
197 |
185 |
215 |
215 |
215 |
Minorities |
3 |
2 |
2 |
9 |
18 |
38 |
48 |
58 |
Equity |
370 |
385 |
426 |
648 |
758 |
802 |
903 |
1,018 |
Total equity and liabilities |
598 |
699 |
880 |
964 |
1,044 |
1,132 |
1,240 |
1,369 |
|
|
|
|
|
|
|
|
|
Cash-flow statement, RUBbn |
2013 |
2014 |
2015 |
2016 |
2017 |
2018E |
2019E |
2020E |
Net income |
110 |
37 |
74 |
258 |
156 |
156 |
224 |
256 |
DD&A |
14 |
17 |
20 |
35 |
35 |
34 |
33 |
38 |
Other |
(19) |
53 |
44 |
(133) |
(16) |
31 |
(54) |
(69) |
Changes in working capital |
(16) |
3 |
(5) |
15 |
5 |
(2) |
(4) |
6 |
Cash flow from operations |
89 |
110 |
133 |
174 |
180 |
219 |
199 |
231 |
Cash flow used for investments |
(100) |
(47) |
(159) |
12 |
(58) |
(156) |
(139) |
(43) |
Cash flow used for/from financing |
(7) |
(36) |
13 |
(157) |
(104) |
(66) |
(55) |
(58) |
Effect of exchange rate changes |
1 |
14 |
1 |
(10) |
(1) |
3 |
- |
- |
Cash flow for the year |
(18) |
41 |
(12) |
19 |
18 |
0 |
5 |
130 |
|
|
|
|
|
|
|
|
|
Key data |
2013 |
2014 |
2015 |
2016 |
2017 |
2018E |
2019E |
2020E |
Net debt/(cash), RUBbn |
158 |
204 |
330 |
168 |
97 |
99 |
94 |
(35) |
Net debt/equity, % |
42.6 |
53.1 |
77.3 |
26.0 |
12.8 |
12.3 |
10.4 |
(3.5) |
Days receivables |
84 |
80 |
64 |
51 |
48 |
40 |
40 |
39 |
Days payables |
937 |
975 |
1,258 |
734 |
861 |
851 |
841 |
831 |
RoE, % |
29.7 |
9.7 |
17.5 |
39.8 |
20.6 |
19.4 |
24.9 |
25.1 |
RoIC, % |
28.9 |
27.9 |
29.4 |
32.1 |
32.9 |
37.5 |
26.8 |
29.4 |
RoACE, % |
23.7 |
7.1 |
11.5 |
33.0 |
19.0 |
18.5 |
22.7 |
23.1 |
Source: Company data, Renaissance Capital estimates
51