

vk.com/id446425943
LUKOIL
We regard LUKOIL as a core holding in the Russian oil & gas sector. Our positive outlook is supported by LUKOIL’s history of consistently superior corporate governance standards, an attractive position in the company’s operating cycle, and a strong focus on shareholder value-creation. In addition, we believe LUKOIL will benefit from Russia’s forthcoming oil tax manoeuvre because of its focus on tax-advantaged hydrocarbon output and its attractively located high-quality refining assets in
Russia. We estimate LUKOIL’s buyback programme will accelerate into 2019 and amount to at least $2bn (compared with $655mn spent YtD in 2018), which, when combined with regular dividends, could increase total cash distribution to shareholders to $5bn, a combined yield of 8.4% in 2019. We maintain our BUY rating with a 5% higher TP of RUB5,860.
A major beneficiary of existing tax breaks
We estimate LUKOIL’s production and export tax bill will be 23% below statutory levels in 2018, one of the highest levels of exemption in Russia. We estimate further gains in 2019 with the ramp-up of production from the Filanovskogo, Yaregskoye and Imilorskoye fields, with the positive margin trend continuing into 2019.
Highest refining profitability in Russia
Our analysis shows that LUKOIL operates some of the most advanced refineries in Russia, with an average NCI of 6.6 vs 5.8 for the sector. Following completion of its refineries upgrade programme, LUKOIL now benefits from high downstream margins in the sector, which is also a major reason for its above-average sensitivity to the oil price.
Attractive FCF and dividend outlook
Moderate capex plans bode well for the company’s FCF to equity (we forecast $4.7bn in 2019) and dividend prospects, with the 2019 dividend yield at 5.1%, on our estimates. LUKOIL has committed to spend 50% of all excess FCF generated (should the actual oil price exceed the $50/bl assumption) to share buybacks, with the intention of cancelling all acquired shares. While our model indicates the amount of excess FCF will exceed $3bn in 2018 and $1bn in 2019, LUKOIL has spent just $655mn on share buybacks YtD. We believe the pace of the buyback should accelerate if LUKOIL were to comply with its commitments. A $2bn buyback during 2019 along with a $3bn dividend payment adds up to a total $5bn cash distribution to shareholders, a combined yield of 8.4%.
Company update
BUY (maintained)
TP: RUB5,860 (previously RUB5,600)
Oil & Gas Russia
Report date: |
14 December 2018 |
|
Current price, RUB |
|
5,267.0 |
Upside/downside, % |
|
11.3 |
MktCap, $mn |
|
67,426.0 |
Average daily volume, RUBmn |
4,655.1 |
|
Free float, RUBmn |
|
2,195,157.2 |
Bloomberg |
|
LKOH RX |
|
|
|
Summary valuation and financials, RUBbn (unless otherwise stated)
|
2017 |
2018E |
2019E |
2020E |
|
Revenue |
5,937 |
8,083 |
7,874 |
7,520 |
|
EBITDA |
832 |
|
1,057 |
993 |
1,011 |
Net income |
419 |
|
561 |
453 |
459 |
Net debt |
286 |
|
57 |
(98) |
(239) |
EPS, RUB |
590 |
|
780 |
604 |
611 |
DPS, RUB |
215 |
|
245 |
270 |
285 |
EV/Sales, x |
0.7 |
|
0.5 |
0.5 |
0.5 |
EV/EBITDA, x |
4.8 |
|
3.8 |
4.0 |
4.0 |
P/E, x |
9.4 |
|
7.0 |
8.7 |
8.6 |
Net debt/EBITDA, x |
0.3 |
|
0.1 |
(0.1) |
(0.2) |
Dividend yield |
4.1 |
|
4.7 |
5.1 |
5.4 |
FCF yield, % |
5.3 |
|
9.4 |
7.9 |
8.0 |
RoIC, % |
10.0 |
12.4 |
10.0 |
9.8 |
|
Source: Company data, Renaissance Capital estimates |
|||||
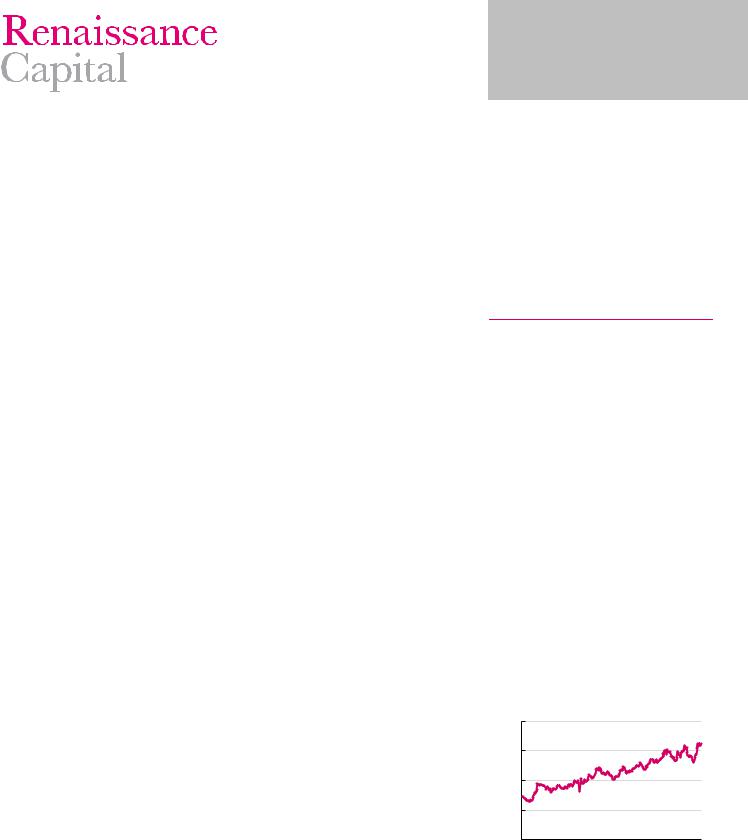
Figure 53: Price performance – 52 weeks, RUB |
|||||
RUB |
|
LKOH RX |
|
|
|
|
|
|
|||
6,000 |
|
|
|
|
|
|
|
|
|
|
|
|
5,000 |
|
|
|
|
|
|
|
|
|
|
|
|
4,000 |
|
|
|
|
|
|
|
|
|
|
|
|
3,000 |
|
|
|
|
|
|
|
|
|
|
|
|
2,000 |
Jan-18 |
Feb-18 |
Mar-18 |
Apr-18 |
May-18 |
Jun-18 |
Jul-18 |
|
|
Oct-18 |
|
|
Dec-17 |
Aug-18 |
Sep-18 |
Nov-18 |
Dec-18 |
Source: Bloomberg
vk.com/id446425943
Renaissance Capital
14 December 2018
LUKOIL
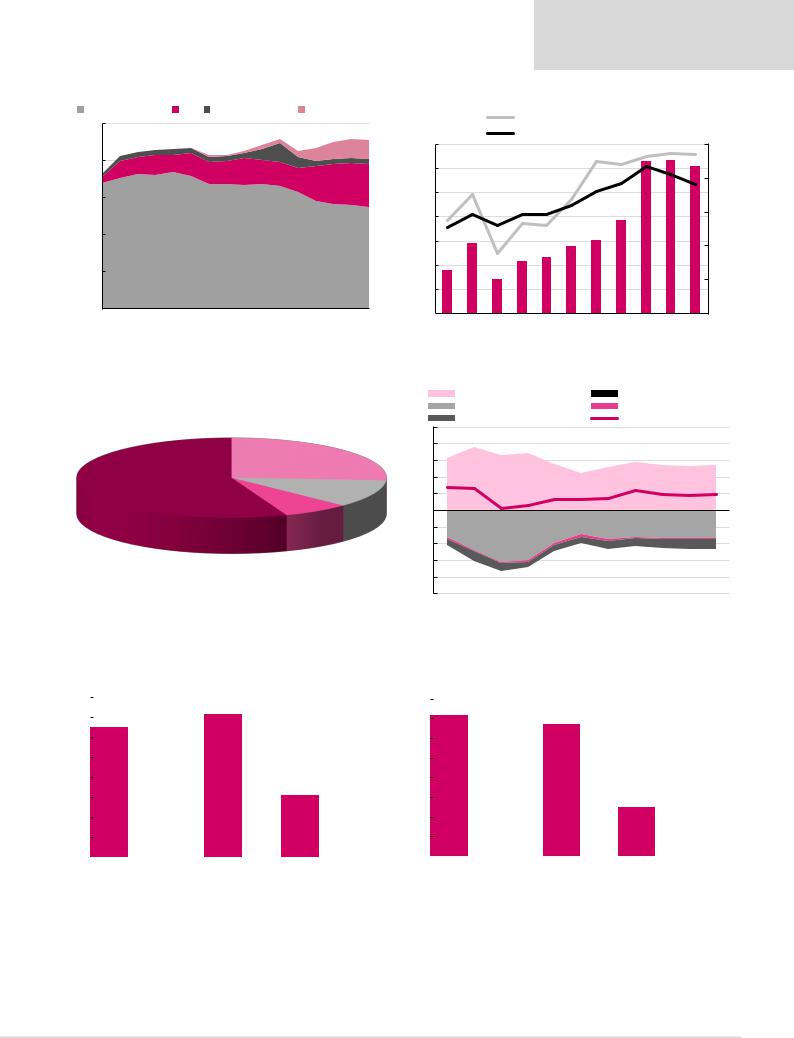
Figure 54: LUKOIL – production outlook, kboe/d
Brownfields - Russia |
Gas |
Crude - international |
Greenfields - Russia |
|||||
2,500 |
|
|
|
|
|
|
|
|
2,000 |
|
|
|
|
|
|
|
|
1,500 |
|
|
|
|
|
|
|
|
1,000 |
|
|
|
|
|
|
|
|
500 |
|
|
|
|
|
|
|
|
- |
|
|
|
|
|
|
|
|
2005 |
2007 |
2009 |
2011 |
2013 |
2015 |
2017 |
2019E |
|
Figure 55: LUKOIL tax break dynamics
 Total tax break (lhs), RUBbn Total % tax break (rhs)
Average % tax break for Russia (rhs)
350 |
|
|
|
|
25% |
300 |
|
|
|
|
20% |
|
|
|
|
|
|
250 |
|
|
|
|
|
200 |
|
|
|
|
15% |
|
|
|
|
|
|
150 |
|
|
|
|
10% |
|
|
|
|
|
|
100 |
|
|
|
|
|
50 |
|
|
|
|
5% |
|
|
|
|
|
|
- |
|
|
|
|
0% |
2010 |
2012 |
2014 |
2016 |
2018E |
2020E |
Source: Company data, Renaissance Capital estimates |
Source: Company data, Renaissance Capital estimates |
Figure 56: LUKOIL current shareholding structure |
Figure 57: LUKOIL – sources and uses of funds, $bn |
|
|
|
|
||||||
|
|
CFFO |
|
|
|
|
|
Divestments |
|
|
|
|
|
Capex and investments |
|
|
|
Interest |
|
|
|
||
|
25 |
Dividends |
|
|
|
|
FCF to equity |
|
|
||
|
|
|
|
|
|
|
|
|
|
|
|
|
20 |
|
|
|
|
|
|
|
|
|
|
V. Alekperov |
15 |
|
|
|
|
|
|
|
|
|
|
26% |
|
|
|
|
|
|
|
|
|
|
|
|
|
|
|
|
|
|
|
|
|
|
|
L. Fedun |
10 |
|
|
|
|
|
|
|
|
|
|
11% |
5 |
|
|
|
|
|
|
|
|
|
|
|
|
|
|
|
|
|
|
|
|
|
|
Free-float |
- |
|
|
|
|
|
|
|
|
|
|
(5) |
|
|
|
|
|
|
|
|
|
|
|
56% |
|
|
|
|
|
|
|
|
|
|
|
|
|
|
|
|
|
|
|
|
|
|
|
Other |
(10) |
|
|
|
|
|
|
|
|
|
|
(15) |
|
|
|
|
|
|
|
|
|
|
|
management |
|
|
|
|
|
|
|
|
|
|
|
|
|
|
|
|
|
|
|
|
|
|
|
7% |
(20) |
|
|
|
|
|
|
|
|
|
|
|
(25) |
|
|
|
|
|
|
|
|
|
|
|
2011 |
2012 |
2013 |
2014 |
2015 |
2016 |
2017 |
2018E |
2019E |
2020E |
2021E |
Source: Company data Source: Company data, Renaissance Capital estimates
Figure 58: LUKOIL – FCF bridge 2018E, $bn |
|
|
|
|
Figure 59: LUKOIL – FCF bridge 2019E, $bn |
|
|
|
|
||||||||||||
16 |
|
|
|
|
|
|
|
|
|
|
16 |
|
|
|
|
|
|
|
|
|
|
14 |
|
|
|
|
|
|
|
|
|
|
14 |
|
|
|
|
|
|
|
|
|
|
|
|
|
|
|
|
|
|
|
|
|
|
|
|
|
|
|
|
|
|
||
12 |
|
|
|
|
|
|
|
|
|
|
12 |
|
|
|
|
|
|
|
|
|
|
|
|
|
|
|
|
|
|
|
|
|
|
|
|
|
|
|
|
|
|
||
10 |
|
|
|
|
|
|
|
|
|
|
10 |
|
|
|
|
|
|
|
|
|
|
|
|
|
|
|
|
|
|
|
|
|
|
|
|
|
|
|
|
|
|
||
8 |
|
|
|
|
|
|
|
|
|
|
8 |
|
|
|
|
|
|
|
|
|
|
|
|
|
|
|
|
|
|
|
|
|
|
|
|
|
|
|
|
|
|
||
6 |
|
|
|
|
|
|
|
|
|
|
6 |
|
|
|
|
|
|
|
|
|
|
4 |
|
|
|
|
|
|
|
|
|
|
4 |
|
|
|
|
|
|
|
|
|
|
|
|
|
|
|
|
|
|
|
|
|
|
|
|
|
|
|
|
|
|
||
2 |
|
|
|
|
|
|
|
|
|
|
2 |
|
|
|
|
|
|
|
|
|
|
|
|
|
|
|
|
|
|
|
|
|
|
|
|
|
|
|
|
|
|
||
|
|
|
|
|
|
|
|
|
|
|
|
|
|
|
|
|
|
|
|
||
- |
|
|
|
|
|
|
|
|
|
|
- |
|
|
|
|
|
|
|
|
|
|
|
|
|
|
|
|
|
|
|
|
CFFO 2018 |
WC |
Other |
CFFO 2019 |
|
Capex |
FCF 2019 |
Interest |
Dividends 2019 |
|||
CFFO 2017 |
WC |
Other |
CFFO 2018 |
|
Capex |
FCF 2018 |
Interest |
Dividends 2018 |
|
||||||||||||
|
|
|
|
||||||||||||||||||
|
|
|
|
|
Source: Company data, Renaissance Capital estimates |
|
|
|
|
|
Source: Company data, Renaissance Capital estimates |
||||||||||
35

vk.com/id446425943
Renaissance Capital
14 December 2018
LUKOIL
Figure 60: LUKOIL – operating and financial summary
Operating statistics |
2013 |
2014 |
2015 |
2016 |
2017 |
2018E |
2019E |
2020E |
Crude oil production, mnt |
91 |
97 |
101 |
92 |
87 |
87 |
87 |
87 |
Gas production, bcm |
20.0 |
20.0 |
20.3 |
20.3 |
28.9 |
33.6 |
35.6 |
35.7 |
Total hydrocarbon production, mn boe |
781 |
827 |
854 |
791 |
808 |
833 |
845 |
843 |
Refining throughput, mnt |
63 |
64 |
62 |
63 |
72 |
71 |
72 |
72 |
|
|
|
|
|
|
|
|
|
Income statement, RUBbn (unless otherwise stated) |
2013 |
2014 |
2015 |
2016 |
2017 |
2018E |
2019E |
2020E |
Gross revenue |
4,507 |
5,505 |
5,749 |
5,227 |
5,937 |
8,083 |
7,874 |
7,520 |
Operating expenses |
(4,181) |
(5,093) |
(5,283) |
(4,808) |
(5,430) |
(7,415) |
(7,320) |
(6,968) |
EBITDA |
531 |
705 |
817 |
731 |
832 |
1,057 |
993 |
1,011 |
EBITDA margin |
12% |
13% |
14% |
14% |
14% |
13% |
13% |
13% |
EBIT |
327 |
412 |
466 |
419 |
507 |
668 |
554 |
552 |
EBIT margin |
7% |
7% |
8% |
8% |
9% |
8% |
7% |
7% |
Financial items |
7 |
73 |
(77) |
(147) |
18 |
31 |
12 |
21 |
Profit before tax |
333 |
485 |
389 |
273 |
524 |
699 |
566 |
573 |
Net income |
250 |
396 |
291 |
207 |
419 |
561 |
453 |
459 |
Average number of shares outstanding, mn |
755 |
755 |
723 |
713 |
710 |
719 |
750 |
750 |
EPS, RUB per share |
331 |
524 |
0.4 |
290 |
590 |
780 |
604 |
611 |
DPS, RUB per share |
110 |
154 |
177 |
195 |
215 |
245 |
270 |
285 |
Payout ratio, % |
37.5 |
862.0 |
32.9 |
51.0 |
29.1 |
25.2 |
35.8 |
37.3 |
|
|
|
|
|
|
|
|
|
Growth rates, % |
|
|
|
(7.4) |
2.1 |
3.1 |
1.5 |
(0.3) |
Total hydrocarbon production |
1.0 |
6.0 |
3.3 |
(9.1) |
13.6 |
36.2 |
(2.6) |
(4.5) |
Revenue |
4.3 |
22.1 |
4.4 |
(28.0) |
103.5 |
32.2 |
(22.6) |
1.3 |
EPS |
(27.0) |
58.5 |
(22.1) |
10.2 |
10.3 |
14.0 |
10.2 |
5.6 |
DPS |
22.2 |
40.0 |
14.9 |
(7.4) |
2.1 |
3.1 |
1.5 |
(0.3) |
|
|
|
|
|
|
|
|
|
Balance sheet, RUBbn |
2013 |
2014 |
2015 |
2016 |
2017 |
2018E |
2019E |
2020E |
Current assets |
769 |
1,236 |
1,214 |
1,256 |
1,308 |
1,679 |
1,855 |
1,947 |
Non-current assets |
2,828 |
3,503 |
3,807 |
3,759 |
3,918 |
4,065 |
4,189 |
4,309 |
Total assets |
3,597 |
4,739 |
5,021 |
5,015 |
5,226 |
5,744 |
6,044 |
6,255 |
Current liabilities |
430 |
779 |
695 |
831 |
959 |
1,163 |
1,140 |
1,103 |
Long-term liabilities |
558 |
910 |
1,094 |
956 |
777 |
637 |
687 |
687 |
Minorities |
17 |
12 |
9 |
7 |
7 |
9 |
9 |
9 |
Equity |
2,592 |
3,037 |
3,222 |
3,221 |
3,483 |
3,935 |
4,207 |
4,457 |
Total equity and liabilities |
3,597 |
4,739 |
5,021 |
5,015 |
5,226 |
5,744 |
6,044 |
6,255 |
|
|
|
|
|
|
|
|
|
Cash-flow statement, RUBbn |
2013 |
2014 |
2015 |
2016 |
2017 |
2018E |
2019E |
2020E |
Net income |
250 |
396 |
291 |
207 |
419 |
561 |
453 |
459 |
DD&A |
205 |
293 |
351 |
312 |
325 |
388 |
439 |
459 |
Other |
104 |
(11) |
138 |
234 |
15 |
(52) |
4 |
0 |
Changes in working capital |
(34) |
(27) |
69 |
- |
- |
- |
- |
- |
Cash flow from operations |
524 |
651 |
849 |
752 |
758 |
898 |
896 |
918 |
Cash flow used for investments |
(594) |
(578) |
(526) |
(500) |
(433) |
(495) |
(542) |
(551) |
Cash flow used for/from financing |
33 |
30 |
(253) |
(193) |
(247) |
(322) |
(148) |
(226) |
Effect of exchange rate changes |
(1) |
23 |
18 |
(55) |
(9) |
- |
- |
- |
Cash flow for the year |
(38) |
126 |
88 |
4 |
69 |
81 |
205 |
141 |
|
|
|
|
|
|
|
|
|
Key data |
2013 |
2014 |
2015 |
2016 |
2017 |
2018E |
2019E |
2020E |
Net debt/(cash), RUBbn |
299 |
587 |
602 |
437 |
286 |
57 |
(98) |
(239) |
Net debt/equity, % |
11.6 |
19.3 |
18.7 |
13.6 |
8.2 |
1.5 |
(2.3) |
(5.4) |
RoE, % |
9.6 |
13.0 |
9.0 |
6.4 |
12.0 |
14.3 |
10.8 |
10.3 |
RoIC, % |
8.7 |
8.8 |
9.2 |
9.8 |
10.0 |
12.4 |
10.0 |
9.8 |
RoACE, % |
9.4 |
0.9 |
8.4 |
6.1 |
11.0 |
13.7 |
10.3 |
9.8 |
Source: Company data, Renaissance Capital estimates
36
vk.com/id446425943
Surgutneftegas
Surgutneftegas
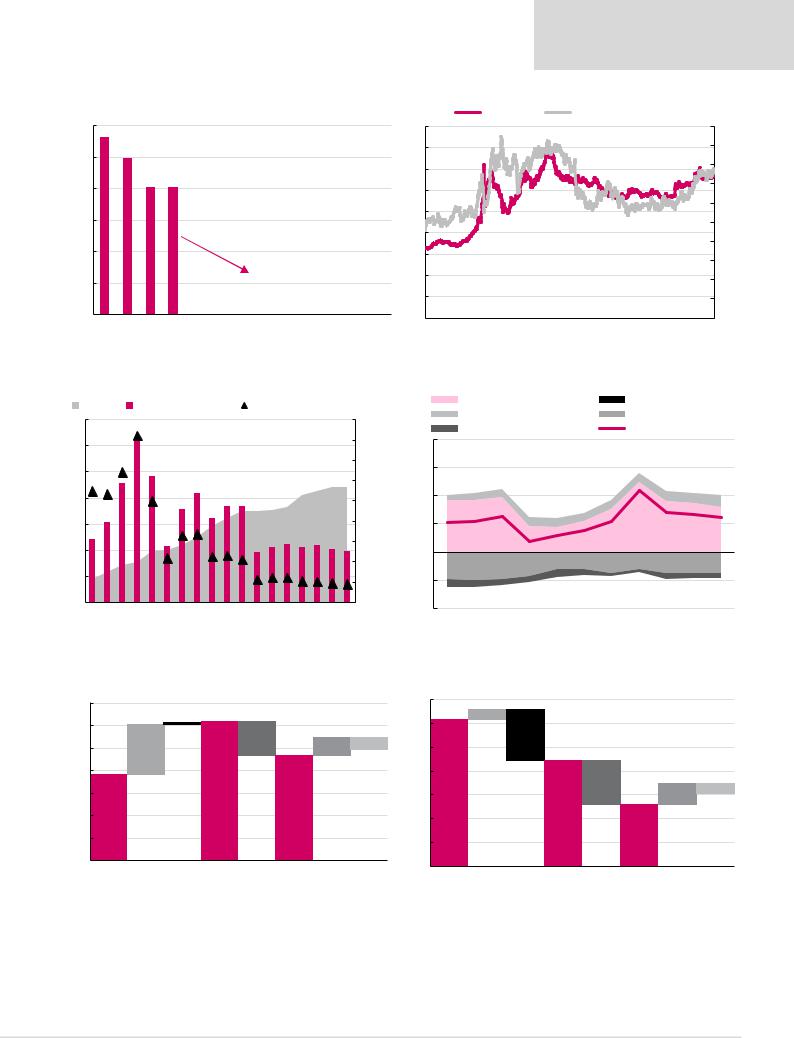
Our investment case on Surgutneftegas is marred by the still unexplained disappearance of 17.6bn of its treasury shares (representing 40% of its share capital and currently valued at $20bn) between 2001 and 2010. The uncertainty over the identity and strategy of the controlling shareholder(s) makes minority shareholders in Surgutneftegas no more than passive observers, while the company’s shares represent simply a claim on dividends until the shareholding mystery is eventually resolved, in our view. The company’s dividend policy is well established, with the dividend mainly determined by the effect of
FX movements on the company’s $42bn cash pile. We believe this means Surgutneftegas offers good exposure to the decline in the rouble/dollar exchange rate. Based on a YE18 rate of RUB65.5/$, we calculate current dividend yields of 2.3% (for commons) and 16.5% (for prefs). We therefore maintain our BUY rating on Surgutneftegas prefs and our HOLD on commons. While Surgutneftegas has traded at a negative EV since 2014, our HOLD rating reflects a long history of under-utilisation of its cash pile, while our 9%-higher RUB120 TP reflects our fundamental valuation of the assets.
Corporate governance remains a concern
Surgutneftegas did not report consolidated financial statements for 11 years, between 2001 and 2013. The 30 April 2013 release of the company’s 2010-2012 IFRS results showed that the 17.6bn treasury shares (representing 40% of the company’s total capital) – which were last reported to exist in its 2001 US GAAP results – have disappeared. No official explanation has been provided by the company. The whereabouts of these shares represents the biggest uncertainty to the company’s investment case, in our view.
Stable business model with limited upside potential
With its East Siberian oil output having reached the c. 9mn tpa plateau, we expect little further production growth for Surgutneftegas, with a forward-looking three-year CAGR of -0.2%. In the downstream, a catalytic cracker remains a theoretical option for the Kirishi refinery, particularly in light of IMO2020 regulations, but we understand FID is not imminent – although it is overdue, in our opinion. With the company’s fundamental focus on stability, we expect little operational upside.
Cash pile under-utilised and under-valued, but weaker rouble supports dividend outlook
Surgutneftegas trades at a negative EV, as its $42bn cash pile exceeds its $26bn market cap. This situation has not changed since 2014, reflecting the lack of visibility over the company’s plans towards its cash position and generally poor track record on corporate governance. FX gains/losses from cash revaluation dwarf the company’s operating earnings and are the major drivers of its RAS earnings, which form the basis for dividend calculations. Given our current RUB/$ forecasts, we estimate Surgutneftegas’s prefs may be entitled to a dividend of RUB6.27 for 2018, reflecting an attractive dividend yield of 16.5%.
Company update
HOLD/BUY
(comm/pref; maintained) TP: RUB120
(comm/pref; previously RUB110)
Oil & Gas Russia
Report date: |
14 December 2018 |
|
Current price, RUB |
|
27.9 / 38.1 |
Upside/downside, % |
|
330.1/ 215.0 |
MktCap, $bn |
|
19,425.6 |
Average daily volume, RUBmn |
1,224.7 |
|
Free float, RUBmn |
|
544,436.4 |
Bloomberg |
SNGS RX / SNGSP RX |
|
|
|
|
Summary valuation and financials, RUBbn (unless otherwise stated)
|
|
|
2017 |
|
2018E |
2019E |
2020E |
|
Revenue |
1,333 |
1,873 |
1,858 |
1,800 |
||||
EBITDA |
360 |
561 |
|
532 |
505 |
|||
Net income |
150 |
681 |
|
469 |
435 |
|||
Net debt |
(2,372) |
(2,880) |
(3,153) |
(3,424) |
||||
EPS, RUB |
3.5 |
15.9 |
|
11.0 |
10.2 |
|||
DPS (ord), RUB |
0.7 |
0.65 |
|
0.7 |
0.7 |
|||
DPS (pref), RUB |
1.4 |
6.27 |
|
4.3 |
4.0 |
|||
EV/Sales, x |
(1.2) |
(0.9) |
|
(0.9) |
(0.9) |
|||
EV/EBITDA, x |
(4.4) |
(2.9) |
|
(3.0) |
(3.2) |
|||
P/E, x |
8.6 |
1.9 |
|
2.8 |
3.0 |
|||
Net debt/EBITDA, x |
(6.6) |
(5.1) |
|
(5.9) |
(6.8) |
|||
Div yield (ord), % |
2 |
2 |
|
2 |
2 |
|||
Div yield (pref), % |
4 |
16 |
|
11 |
11 |
|||
FCF yield, % |
24.2 |
53.2 |
|
36.1 |
35.5 |
|||
|
|
Source: Company data, Renaissance Capital estimates |
||||||
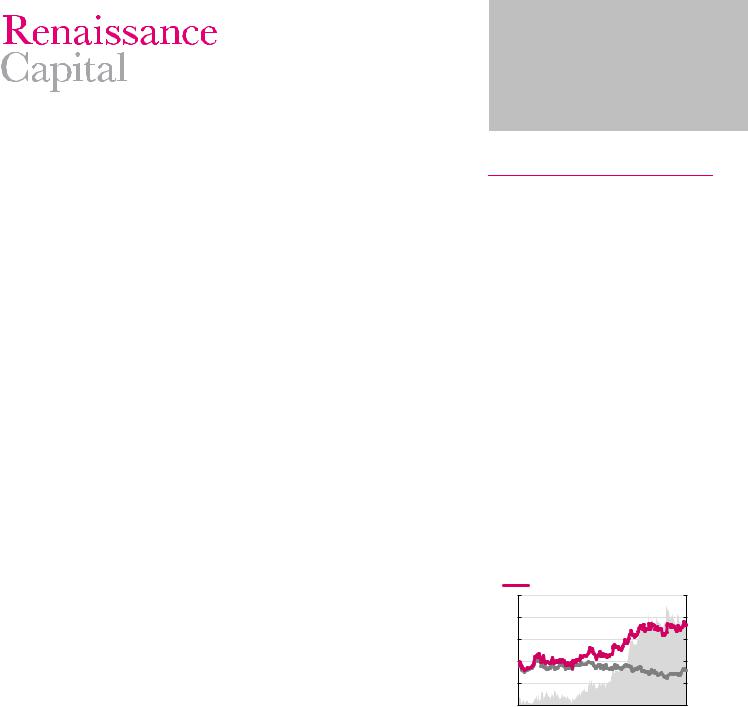
Figure 61: Price performance – 52 weeks, RUB |
|
|||||||
|
|
Pref premium (rhs) |
|
|
SNGS RX Equity |
|||
|
|
|
|
|||||
SNGSP RX Equity
45 |
|
|
|
|
|
|
|
|
|
|
50% |
40 |
|
|
|
|
|
|
|
|
|
|
40% |
35 |
|
|
|
|
|
|
|
|
|
|
30% |
30 |
|
|
|
|
|
|
|
|
|
|
20% |
25 |
|
|
|
|
|
|
|
|
|
|
10% |
20 |
Jan-18 |
|
Mar-18 |
|
May-18 |
Jun-18 |
Jul-18 |
|
|
|
0% |
Dec-17 |
Feb-18 |
Apr-18 |
Aug-18 |
Sep-18 |
Oct-18 |
Nov-18 |
Source: Bloomberg
vk.com/id446425943
|
|
|
|
|
|
|
Renaissance Capital |
|
|
|
|
|
|
|
14 December 2018 |
|
|
|
|
|
|
|
Surgutneftegas |
Figure 62: Share of treasury stock in total share count |
Figure 63: Surgutneftegas preferred share price vs RUB/$ exchange rate |
||||||
|
|
|
|
RUB/$ rate |
|
Surgutneftgas pref (RUB, rhs) |
|
60% |
56% |
|
90 |
|
|
|
50 |
50% |
50% |
|
80 |
|
|
|
45 |
|
|
|
|
|
|
40 |
|
|
|
|
70 |
|
|
|
|
|
41% 40% |
|
|
|
|
|
|
|
|
|
|
|
|
35 |
|
40% |
|
|
60 |
|
|
|
|
|
|
|
|
|
|
||
|
|
|
50 |
|
|
|
30 |
30% |
|
|
|
|
|
|
|
|
|
|
|
|
|
25 |
|
|
|
|
40 |
|
|
|
20 |
|
|
|
|
|
|
|
|
20% |
|
|
30 |
|
|
|
15 |
|
|
|
|
|
|
|
|
10% |
|
|
20 |
|
|
|
10 |
|
|
|
|
|
|
||
|
|
|
|
|
|
|
|
|
|
<1% <1% <1% <1% <1% <1% |
10 |
|
|
|
5 |
|
|
|
|
|
|
|
|
0% |
|
|
0 |
|
|
|
0 |
|
1998 1999 2000 2001 |
2011 2012 2013 2014 2015 2016 |
|
|
|
||
|
2013 |
2014 |
2015 |
2016 |
2017 |
||
|
|
|
|||||
|
|
Source: Company data |
|
|
|
Source: Bloomberg, Renaissance Capital |
|
Figure 64: Surgutneftegas – market cap vs cash, $bn |
|
|
|
Figure 65: Surgutneftegas – sources and uses of funds, $bn |
||||||||||||||
Net cash |
Period-end market cap |
Premium/(discount) to cash, rhs |
|
CFFO |
|
|
|
|
|
Divestments |
||||||||
|
Interest |
|
|
|
|
|
Capex and investments |
|||||||||||
70 |
|
|
|
|
|
|
|
|
|
350% |
|
|
|
|
|
|
||
|
|
|
|
|
|
|
|
|
|
Dividends |
|
|
|
|
FCF to equity |
|||
|
|
|
|
|
|
|
|
|
|
|
|
|
|
|
|
|||
60 |
|
|
|
|
|
|
|
|
|
300% |
20 |
|
|
|
|
|
|
|
|
|
|
|
|
|
|
|
|
|
|
|
|
|
|
|
|
|
|
|
|
|
|
|
|
|
|
|
|
250% |
15 |
|
|
|
|
|
|
|
50 |
|
|
|
|
|
|
|
|
|
|
|
|
|
|
|
|
|
|
|
|
|
|
|
|
|
|
|
200% |
|
|
|
|
|
|
|
|
|
|
|
|
|
|
|
|
|
|
|
|
|
|
|
|
|
|
|
|
40 |
|
|
|
|
|
|
|
|
|
150% |
10 |
|
|
|
|
|
|
|
|
|
|
|
|
|
|
|
|
|
|
|
|
|
|
|
|
|
|
30 |
|
|
|
|
|
|
|
|
|
100% |
5 |
|
|
|
|
|
|
|
|
|
|
|
|
|
|
|
|
|
|
|
|
|
|
|
|
||
20 |
|
|
|
|
|
|
|
|
|
50% |
|
|
|
|
|
|
|
|
|
|
|
|
|
|
|
|
|
0% |
- |
|
|
|
|
|
|
|
|
|
|
|
|
|
|
|
-40%-39% |
|
|
|
|
|
|
|
|
|
||
|
|
|
|
|
|
-45% |
-49%-49% |
|
|
|
|
|
|
|
|
|
||
10 |
|
|
|
|
|
|
|
|
-53%-56% |
|
|
|
|
|
|
|
|
|
|
|
|
|
|
|
|
|
|
-50% |
(5) |
|
|
|
|
|
|
|
|
|
|
|
|
|
|
|
|
|
|
|
|
|
|
|
|
|
||
0 |
|
|
|
|
|
|
|
|
|
-100% |
(10) |
|
|
|
|
|
|
|
2003 |
2005 |
2007 |
2009 |
2011 |
2013 |
2015 |
2017 |
2Q18 |
|
|
|
|
|
|
|
|
||
|
2011 |
2012 |
2013 |
2014 |
2015 |
2016 |
2017 |
2018E 2019E 2020E 2021E |
||||||||||
|
|
|
|
|
|
|
|
|
|
|
||||||||
Source: Company data, Bloomberg Finance LP, Renaissance Capital |
Source: Company data, Renaissance Capital estimates |
|
Figure 66: Surgutneftegas – FCF bridge 2018E, $bn
14
12
10
8
6
4
2
-
CFFO 2017 |
WC |
Other |
CFFO 2018 |
Capex |
FCF 2018 |
Interest |
Dividends 2018 |
Source: Company data, Renaissance Capital estimates
Figure 67: Surgutneftegas – FCF bridge 2019E, $bn
14
12
10
8
6
4
2
-
CFFO 2018 |
WC |
Other |
CFFO 2019 |
Capex |
FCF 2019 |
Interest |
Dividends 2019 |
Source: Company data, Renaissance Capital estimates
38

vk.com/id446425943
Renaissance Capital
14 December 2018
Surgutneftegas
Figure 68: Surgutneftegas – operating and financial summary
Operating statistics |
2013 |
2014 |
2015 |
2016 |
2017 |
2018E |
2019E |
2020E |
Crude oil production, mnt |
61 |
61 |
62 |
62 |
61 |
61 |
62 |
61 |
Gas production, bcm |
12.1 |
9.5 |
9.6 |
9.8 |
9.6 |
9.6 |
9.8 |
9.7 |
Total hydrocarbon production, mn boe |
520 |
504 |
506 |
509 |
498 |
503 |
509 |
505 |
Refining throughput, mtn |
20 |
19 |
19 |
19 |
18 |
18 |
18 |
18 |
|
|
|
|
|
|
|
|
|
Income statement, RUBbn (unless otherwise stated) |
2013 |
2014 |
2015 |
2016 |
2017 |
2018E |
2019E |
2020E |
Gross revenue |
1,288 |
1,359 |
1,261 |
1,186 |
1,333 |
1,873 |
1,858 |
1,800 |
Operating expenses |
(1,088) |
(1,182) |
(1,027) |
(950) |
(1,101) |
(1,449) |
(1,473) |
(1,454) |
EBITDA |
289 |
271 |
333 |
344 |
360 |
561 |
532 |
505 |
EBITDA margin |
22% |
20% |
26% |
29% |
27% |
30% |
29% |
28% |
EBIT |
200 |
177 |
234 |
235 |
232 |
424 |
385 |
346 |
EBIT margin |
16% |
13% |
19% |
20% |
17% |
23% |
21% |
19% |
Financial items |
113 |
891 |
668 |
(359) |
(48) |
439 |
201 |
198 |
Profit before tax |
313 |
1,068 |
903 |
(123) |
184 |
863 |
586 |
544 |
Net income |
257 |
892 |
751 |
(105) |
150 |
681 |
469 |
435 |
Average number of shares outstanding, m |
42,778 |
42,778 |
42,778 |
42,778 |
42,778 |
42,778 |
42,778 |
42,778 |
EPS, RUB per share |
6.00 |
20.84 |
17.56 |
(2.45) |
3.50 |
15.92 |
10.95 |
10.17 |
DPS commons, RUB per share |
0.60 |
0.65 |
0.60 |
0.60 |
0.65 |
0.65 |
0.65 |
0.65 |
DPS prefs, RUB per share |
2.36 |
8.21 |
6.92 |
0.60 |
1.38 |
6.27 |
4.32 |
4.01 |
Payout ratio, % |
15.4 |
9.7 |
9.9 |
(24.9) |
22.6 |
10.5 |
12.0 |
12.4 |
|
|
|
|
|
|
|
|
|
Growth rates, % |
|
|
|
|
|
|
|
|
Total hydrocarbon production |
(0.2) |
(3.0) |
0.4 |
0.6 |
(2.1) |
0.9 |
1.2 |
(0.9) |
Revenue |
(99.9) |
5.5 |
(7.2) |
(6.0) |
12.4 |
40.5 |
(0.8) |
(3.1) |
EPS |
59.4 |
247.6 |
(15.7) |
(113.9) |
(242.9) |
354.7 |
(31.2) |
(7.2) |
DPS |
35.4 |
118.3 |
(13.6) |
(65.1) |
29.9 |
111.3 |
(21.1) |
(4.2) |
|
|
|
|
|
|
|
|
|
Balance sheet, RUBbn |
2013 |
2014 |
2015 |
2016 |
2017 |
2018E |
2019E |
2020E |
Current assets |
673 |
957 |
845 |
819 |
1,203 |
1,334 |
1,618 |
1,889 |
Non-current assets |
1,432 |
2,060 |
2,860 |
2,721 |
2,495 |
3,224 |
3,337 |
3,449 |
Total assets |
2,105 |
3,017 |
3,704 |
3,540 |
3,699 |
4,558 |
4,955 |
5,338 |
Current liabilities |
88 |
128 |
130 |
111 |
132 |
167 |
167 |
172 |
Long-term liabilities |
55 |
65 |
71 |
76 |
81 |
82 |
82 |
82 |
Minorities |
- |
- |
- |
- |
- |
- |
- |
- |
Equity |
1,962 |
2,823 |
3,504 |
3,353 |
3,486 |
4,308 |
4,706 |
5,084 |
Total equity and liabilities |
2,105 |
3,017 |
3,704 |
3,540 |
3,699 |
4,558 |
4,955 |
5,338 |
|
|
|
|
|
|
|
|
|
Cash-flow statement, RUBbn |
2013 |
2014 |
2015 |
2016 |
2017 |
2018E |
2019E |
2020E |
Net income |
257 |
892 |
751 |
(105) |
150 |
681 |
469 |
435 |
DD&A |
89 |
95 |
99 |
109 |
128 |
136 |
147 |
159 |
Other |
(45) |
(817) |
(562) |
444 |
159 |
25 |
(10) |
(10) |
Changes in working capital |
6 |
7 |
(24) |
(90) |
9 |
(71) |
(11) |
5 |
Cash flow from operations |
307 |
175 |
264 |
358 |
446 |
771 |
595 |
588 |
Cash flow used for investments |
(275) |
(742) |
(881) |
24 |
6 |
(678) |
(250) |
(261) |
Cash flow used for/from financing |
(29) |
(40) |
(87) |
(75) |
(26) |
(34) |
(72) |
(56) |
Effect of exchange rate changes |
(8) |
609 |
745 |
(337) |
(405) |
- |
- |
- |
Cash flow for the year |
(6) |
2 |
41 |
(30) |
20 |
59 |
273 |
271 |
|
|
|
|
|
|
|
|
|
Key data |
2013 |
2014 |
2015 |
2016 |
2017 |
2018E |
2019E |
2020E |
Net debt/(cash), RUBbn |
(1,147) |
(1,971) |
(2,563) |
(2,234) |
(2,372) |
(2,880) |
(3,153) |
(3,424) |
Net debt/equity, % |
(58.4) |
(69.8) |
(73.2) |
(66.6) |
(68.1) |
(66.8) |
(67.0) |
(67.3) |
RoE, % |
13.1 |
31.6 |
21.4 |
(3.1) |
4.3 |
15.8 |
10.0 |
8.6 |
RoIC, % |
19.9 |
11.1 |
6.5 |
5.6 |
16.8 |
23.6 |
19.8 |
16.7 |
RoACE, % |
14.0 |
37.3 |
23.7 |
(3.1) |
4.4 |
17.5 |
10.4 |
8.9 |
Source: Company data, Renaissance Capital estimates
39