


vk.com/id446425943
Appendix 1. Oil price outlook
Renaissance Capital
14 December 2018
Oil & Gas
Appendix 1. Oil price outlook
73

vk.com/id446425943
Renaissance Capital
14 December 2018
Oil & Gas
Supply growth outpaces demand
Forecasts from the International Energy Agency (IEA), the Energy Information Administration (EIA) of the US Department of Energy, and OPEC now average 1.5% growth in demand for crude oil in 2018 to 99.4mnb/d, a marginal reduction vs an average forecast of 1.6% in July 2018. Growth is then expected to stabilise at 1.4% in 2019 according to the average estimates from these three agencies. These forecasts are summarised below.
Figure 157: World crude supply/demand balance, mnb/d
|
2016 |
|
|
2017 |
|
|
|
|
2018E |
|
|
|
|
2019E |
|
|
|
FY |
1Q |
2Q |
3Q |
4Q |
FY |
1Q |
2Q |
3Q |
4QE |
FYE |
1QE |
2QE |
3QE |
4QE |
FYE |
Demand |
96.1 |
96.4 |
97.7 |
98.4 |
98.9 |
97.9 |
98.4 |
98.7 |
99.9 |
100.3 |
99.4 |
99.6 |
100.2 |
101.4 |
101.7 |
100.7 |
IEA |
96.1 |
96.4 |
98.0 |
98.4 |
98.7 |
97.9 |
98.2 |
98.5 |
99.8 |
100.1 |
99.2 |
99.2 |
100.3 |
101.4 |
101.4 |
100.6 |
EIA |
96.9 |
97.1 |
98.6 |
99.1 |
99.4 |
98.5 |
99.2 |
99.5 |
100.7 |
100.9 |
100.1 |
100.6 |
101.0 |
102.2 |
102.3 |
101.5 |
OPEC |
95.4 |
95.7 |
96.5 |
97.9 |
98.7 |
97.2 |
97.8 |
98.0 |
99.3 |
100.0 |
98.8 |
99.1 |
99.3 |
100.6 |
101.3 |
100.1 |
Supply |
96.7 |
96.5 |
96.7 |
97.6 |
98.1 |
97.2 |
98.3 |
98.7 |
100.3 |
100.5 |
99.5 |
100.8 |
101.1 |
101.7 |
102.2 |
101.5 |
Non-OPEC |
57.5 |
57.7 |
57.7 |
58.0 |
59.0 |
58.1 |
59.2 |
59.9 |
61.1 |
61.4 |
60.4 |
61.8 |
62.2 |
62.9 |
63.4 |
62.6 |
IEA |
57.4 |
57.5 |
57.5 |
58.1 |
58.8 |
58.0 |
59.1 |
60.0 |
61.2 |
61.0 |
60.3 |
61.4 |
62.1 |
62.7 |
62.9 |
62.3 |
EIA |
58.0 |
58.0 |
57.9 |
58.4 |
59.3 |
58.4 |
59.4 |
60.3 |
61.7 |
62.6 |
61.0 |
62.4 |
63.4 |
63.7 |
64.0 |
63.4 |
OPEC |
57.0 |
57.7 |
57.5 |
57.5 |
58.8 |
57.9 |
59.1 |
59.5 |
60.3 |
60.5 |
59.9 |
61.5 |
61.2 |
62.4 |
63.3 |
62.1 |
Of which FSU |
14.1 |
14.3 |
14.2 |
14.1 |
14.3 |
14.2 |
14.3 |
14.4 |
14.5 |
14.6 |
14.4 |
14.7 |
14.6 |
14.6 |
14.7 |
14.7 |
IEA |
14.2 |
14.4 |
14.3 |
14.2 |
14.4 |
14.3 |
14.4 |
14.5 |
14.6 |
14.9 |
14.6 |
15.0 |
15.0 |
14.9 |
15.0 |
15.0 |
EIA |
14.2 |
14.4 |
14.3 |
14.2 |
14.3 |
14.3 |
14.4 |
14.4 |
14.6 |
14.8 |
14.6 |
14.8 |
14.8 |
14.8 |
14.9 |
14.8 |
OPEC |
13.9 |
14.1 |
14.1 |
13.9 |
14.1 |
14.1 |
14.1 |
14.1 |
14.3 |
14.2 |
14.2 |
14.2 |
14.2 |
14.2 |
14.2 |
14.2 |
OPEC NGLs |
6.5 |
6.5 |
6.6 |
6.6 |
6.6 |
6.6 |
6.6 |
6.6 |
6.7 |
6.7 |
6.7 |
6.7 |
6.7 |
6.7 |
6.7 |
6.7 |
IEA |
6.8 |
6.9 |
6.9 |
6.9 |
6.9 |
6.9 |
6.9 |
6.9 |
7.0 |
7.0 |
7.0 |
7.0 |
7.0 |
7.0 |
7.0 |
7.0 |
EIA |
6.6 |
6.6 |
6.6 |
6.6 |
6.6 |
6.6 |
6.7 |
6.6 |
6.6 |
6.6 |
6.6 |
6.6 |
6.6 |
6.6 |
6.6 |
6.6 |
OPEC |
6.1 |
6.1 |
6.3 |
6.3 |
6.2 |
6.2 |
6.3 |
6.3 |
6.4 |
6.4 |
6.3 |
6.4 |
6.4 |
6.5 |
6.5 |
6.5 |
Call on OPEC crude and stocks |
32.2 |
32.2 |
33.4 |
33.8 |
33.4 |
33.2 |
32.6 |
32.2 |
32.2 |
32.3 |
32.3 |
31.2 |
31.3 |
31.8 |
31.6 |
31.5 |
IEA |
31.9 |
32.0 |
33.6 |
33.4 |
33.0 |
33.0 |
32.2 |
31.6 |
31.6 |
32.1 |
31.9 |
30.8 |
31.2 |
31.7 |
31.5 |
31.3 |
EIA |
32.4 |
32.5 |
34.0 |
34.1 |
33.5 |
33.5 |
33.2 |
32.7 |
32.4 |
31.8 |
32.5 |
31.6 |
31.0 |
31.9 |
31.8 |
31.6 |
OPEC |
32.3 |
31.9 |
32.7 |
34.0 |
33.7 |
33.1 |
32.4 |
32.2 |
32.7 |
33.0 |
32.6 |
31.2 |
31.6 |
31.8 |
31.5 |
31.5 |
OPEC crude |
32.8 |
32.2 |
32.5 |
33.0 |
32.6 |
32.6 |
32.5 |
32.2 |
32.6 |
32.5 |
32.5 |
32.4 |
32.2 |
32.1 |
32.1 |
32.2 |
IEA |
33.0 |
32.3 |
32.6 |
33.0 |
32.6 |
32.6 |
32.3 |
32.1 |
32.6 |
|
|
|
|
|
|
|
EIA |
32.7 |
32.3 |
32.5 |
33.2 |
32.8 |
32.7 |
32.7 |
32.3 |
32.5 |
32.5 |
32.5 |
32.4 |
32.2 |
32.1 |
32.1 |
32.2 |
OPEC |
32.6 |
32.1 |
32.3 |
32.7 |
32.4 |
32.4 |
32.4 |
32.2 |
32.6 |
|
|
|
|
|
|
|
Stock-build/(draw) |
0.3 |
0.0 |
(1.0) |
(0.9) |
(0.8) |
(0.6) |
(0.1) |
0.1 |
0.3 |
0.7 |
(0.0) |
0.8 |
1.2 |
0.2 |
0.3 |
0.6 |
IEA |
0.8 |
0.2 |
(1.0) |
(0.5) |
(0.5) |
(0.4) |
0.1 |
0.6 |
0.9 |
|
|
|
|
|
|
|
EIA |
(0.3) |
(0.3) |
(1.5) |
(0.9) |
(0.7) |
(0.8) |
(0.5) |
(0.3) |
0.2 |
0.7 |
(0.0) |
0.8 |
1.2 |
0.2 |
0.3 |
0.6 |
OPEC |
0.4 |
0.2 |
(0.4) |
(1.3) |
(1.3) |
(0.7) |
(0.0) |
(0.0) |
(0.1) |
|
|
|
|
|
|
|
Note: The IEA and OPEC numbers do not project OPEC crude supply. Processing volumetric gains, losses and biofuels are included in non-OPEC supply.
Source: IEA, EIA, OPEC, Renaissance Capital
All three agencies are forecasting stronger oil demand in 2018, in line with an accelerating global economy, which is expected to grow by 3.7% in 2018 and 2019, according to the IEA. The IEA was the only agency to decrease its oil demand forecast for 2018, by 100kb/d compared to its October 2018 estimate. This decrease could be associated with higher oil prices YoY as well as depreciating currencies in non-OECD countries and deteriorating economic activity – notably in India, Brazil and Argentina. The IEA, EIA and OPEC forecast average demand growth of 1.4%, or 1.3mnb/d in 2019, supported by a solid economic outlook.
On the supply side, forecasts from the agencies estimate an increase of 2.4% or 2.3mnb/d to 99.5mnb/d in 2018, compared with 97.2mnb/d in 2017. The supply forecasts averaged an upward revision of 0.5% in comparison with October 2018. For the year as a whole, non-OPEC production is on track to increase by 2.3mnb/d, the highest increase in five years, and then slow to growth of 2.2mnb/d in 2019. According to the IEA, Russia, the US and Saudi Arabia are producing at record-high levels and are the main drivers behind supply levels exceeding 100mnb/d for the first time in history. The US and Russia, as well as a return in Brazilian growth, underpin the non-OPEC growth of 1.9mnb/d in 2019, following an increase of 2.3mnb/d in 2018. The US will account for 90% of net YoY nonOPEC supply growth, according to the IEA. Consensus now calls for former Soviet Union
74
vk.com/id446425943
Renaissance Capital
14 December 2018
Oil & Gas
(FSU) production to grow by 1.5% YoY in both 2018 and 2019, although this was before the 7 December 2018 OPEC+ production cut discussed below (taking into account
Russia’s 228kb/d quota of the cut, we calculate Russia’s output will grow 0.6% in 2019, see Upstream outlook for 2019).
Taking the above-mentioned demand and non-OPEC supply forecasts at face value, as well as the IEA, EIA and OPEC forecasts of 1.5% growth in OPEC natural gas liquids (NGL) supply in 2018, balanced markets would require 2.6% (1.0mnb/d) less OPEC crude in 2018 than in 2017, or 32.3mnb/d. The EIA, IEA, and OPEC forecasts for 2019 estimate that the call on OPEC crude and stocks will decrease by a further 3% to 31.5mnb/d next year as non-OPEC supply expands strongly. Record production from the UAE and Saudi Arabia helped to raise OPEC output in 2018 by over an additional 200kb/d and more than compensate for further losses from Iran. Heading into the new year, in addition to the reduced demand expectations, non-OPEC growth is expected to continue and could result in a cut on the call on OPEC crude of approximately 2mnb/d below the current output to 30.7mnb/d, according to the IEA. With supply reaching high levels and outpacing demand growth, OPEC/non-OPEC producers agreed on 7 December 2018 to cut their combined output by 1.2mnb/d, driven by an 800kb/d cut by OPEC members and a 400kb/d cut by non-OPEC producers. The agreement will last for six months but could be reviewed during the next OPEC+ meeting, scheduled for April 2019.
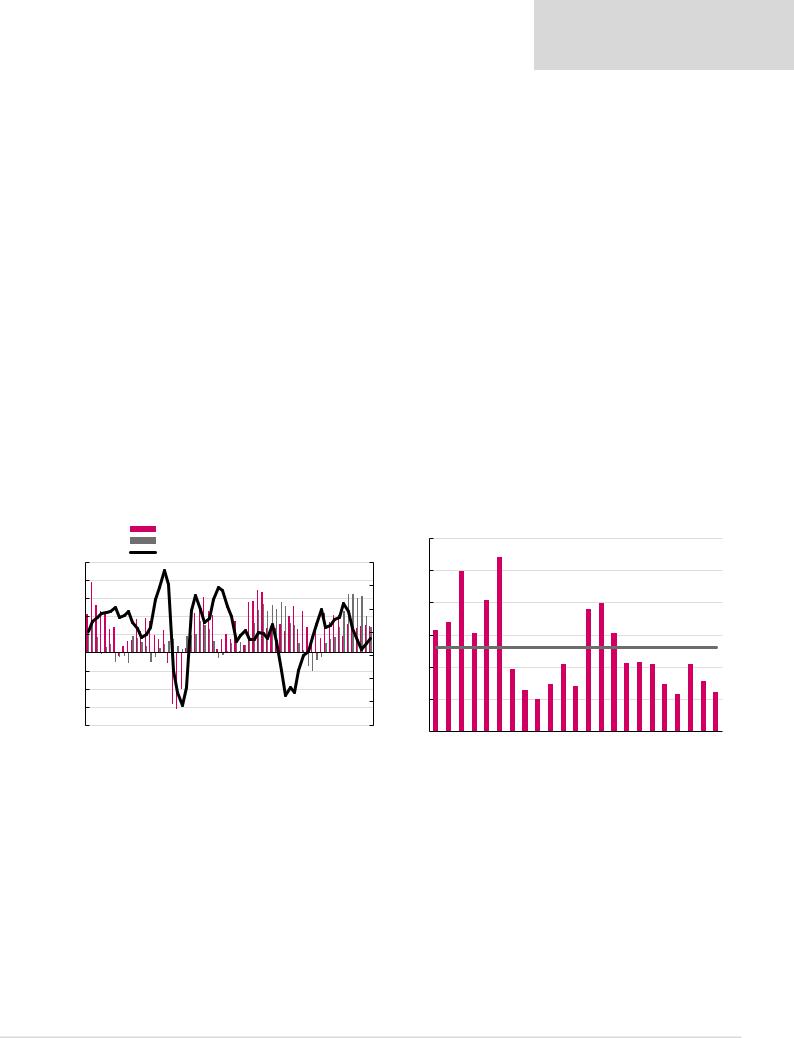
As shown in Figure 158, the EIA estimates that non-OPEC production growth will exceed demand growth throughout 2018 and the first half of 2019. The EIA expects that this relationship may reverse towards the end of the second half of 2019, suggesting an increasing call on OPEC output then.
Figure 158: Brent oil price tends to rise when demand growth exceeds |
|
|
Figure 159: OPEC spare production capacity, mnb/d |
|
|
|||||||||||||||||||||||
non-OPEC supply |
|
|
|
|
|
|
|
|
|
|
|
|
|
|
|
|
|
|
|
|
|
|
|
|
||||
|
|
|
|
|
|
Demand growth YoY (mnbpd, LHS) |
|
|
|
|
|
6 |
|
|
|
|
|
|||||||||||
|
|
|
|
|
|
Non-OPEC supply growth YoY (mnbpd, LHS) |
|
|
|
|
|
|
|
|
||||||||||||||
|
|
|
|
|
|
Brent, $/bbl higher YoY (RHS) |
|
|
|
|
|
|
|
|
|
|
|
|
|
|||||||||
5 |
|
|
|
|
|
|
|
|
|
|
|
|
|
|
|
|
|
|
|
|
60 |
5 |
|
|
|
|
|
|
4 |
|
|
|
|
|
|
|
|
|
|
|
|
|
|
|
|
|
|
|
|
|
|
|
|
|
|
||
|
|
|
|
|
|
|
|
|
|
|
|
|
|
|
|
|
|
|
|
40 |
|
|
|
|
|
|
||
|
|
|
|
|
|
|
|
|
|
|
|
|
|
|
|
|
|
|
|
|
|
|
|
|
|
|
||
3 |
|
|
|
|
|
|
|
|
|
|
|
|
|
|
|
|
|
|
|
|
|
4 |
|
|
|
|
|
|
|
|
|
|
|
|
|
|
|
|
|
|
|
|
|
|
|
|
|
|
|
20 |
|
|
|
|
|
||
2 |
|
|
|
|
|
|
|
|
|
|
|
|
|
|
|
|
|
|
|
|
|
|
|
|
|
|
||
|
|
|
|
|
|
|
|
|
|
|
|
|
|
|
|
|
|
|
|
|
|
|
|
|
|
|
||
1 |
|
|
|
|
|
|
|
|
|
|
|
|
|
|
|
|
|
|
|
|
- |
3 |
|
1997-2017 average |
|
|
||
- |
|
|
|
|
|
|
|
|
|
|
|
|
|
|
|
|
|
|
|
|
-20 |
|
|
|
|
|
|
|
|
|
|
|
|
|
|
|
|
|
|
|
|
|
|
|
|
|
|
|
|
|
|
|
|
|
|
||
-1 |
|
|
|
|
|
|
|
|
|
|
|
|
|
|
|
|
|
|
|
|
|
2 |
|
|
|
|
|
|
|
|
|
|
|
|
|
|
|
|
|
|
|
|
|
|
|
|
|
|
-40 |
|
|
|
|
|
|
||
|
|
|
|
|
|
|
|
|
|
|
|
|
|
|
|
|
|
|
|
|
|
|
|
|
|
|
||
-2 |
|
|
|
|
|
|
|
|
|
|
|
|
|
|
|
|
|
|
|
|
|
|
|
|
|
|
|
|
-3 |
|
|
|
|
|
|
|
|
|
|
|
|
|
|
|
|
|
|
|
|
-60 |
1 |
|
|
|
|
|
|
|
|
|
|
|
|
|
|
|
|
|
|
|
|
|
|
|
|
|
|
|
|
|
|
|
|
|||
|
|
|
|
|
|
|
|
|
|
|
|
|
|
|
|
|
|
|
|
|
|
|
|
|
|
|
||
-4 |
|
|
|
|
|
|
|
|
|
|
|
|
|
|
|
|
|
|
|
|
-80 |
- |
|
|
|
|
|
|
1Q04 |
4Q04 |
3Q05 |
2Q06 |
1Q07 |
4Q07 |
3Q08 |
2Q09 |
1Q10 |
4Q10 |
3Q11 |
2Q12 |
1Q13 |
4Q13 |
3Q14 |
2Q15 |
1Q16 |
4Q16 |
3Q17 |
2Q18 |
1Q19 |
4Q19 |
|
|
|
|
|
||
1997 |
2001 |
2005 |
2009 |
2013 |
2017 |
|||||||||||||||||||||||
|
|
|
|
|
|
|
|
|
|
|
|
|
|
|
|
|
|
|
|
|
|
|||||||
|
|
|
|
|
|
|
|
Source: EIA, Bloomberg Finance LP, Renaissance Capital estimates |
|
|
|
|
|
Source: EIA |
||||||||||||||
We maintain our 2019 Brent oil price forecast of $65/bl
US sanctions on Iran have proved less severe than we feared, as six-month waivers granted have reduced the expected negative effect on global crude supplies. Elsewhere, strong OPEC and non-OPEC production growth YtD are contrasted with slightly reduced demand expectations, with the OPEC+ agreement necessary to keep markets in balance until at least 2H19. We expect OPEC+ compliance will be high, supporting a 2019 Brent oil price around our unchanged $65/bl estimate.
While supply risks are still abundant (Iran post-waivers, Venezuela), we believe there is sufficient global capacity for stronger production growth elsewhere. In particular, the surge
75
vk.com/id446425943
Renaissance Capital
14 December 2018
Oil & Gas
in US oil production continues with a significant 3mnb/d YoY increase recorded in August 2018, according to the IEA; there are also many other growth spots in the world, notably recovery in Libyan production, Canada, Russia, Kazakhstan and Brazil, as well as the reversal of Venezuela’s and Iran’s oil production at some point. We therefore retain our somewhat lower $60/bl Brent oil price (real) assumption for 2020 and beyond.
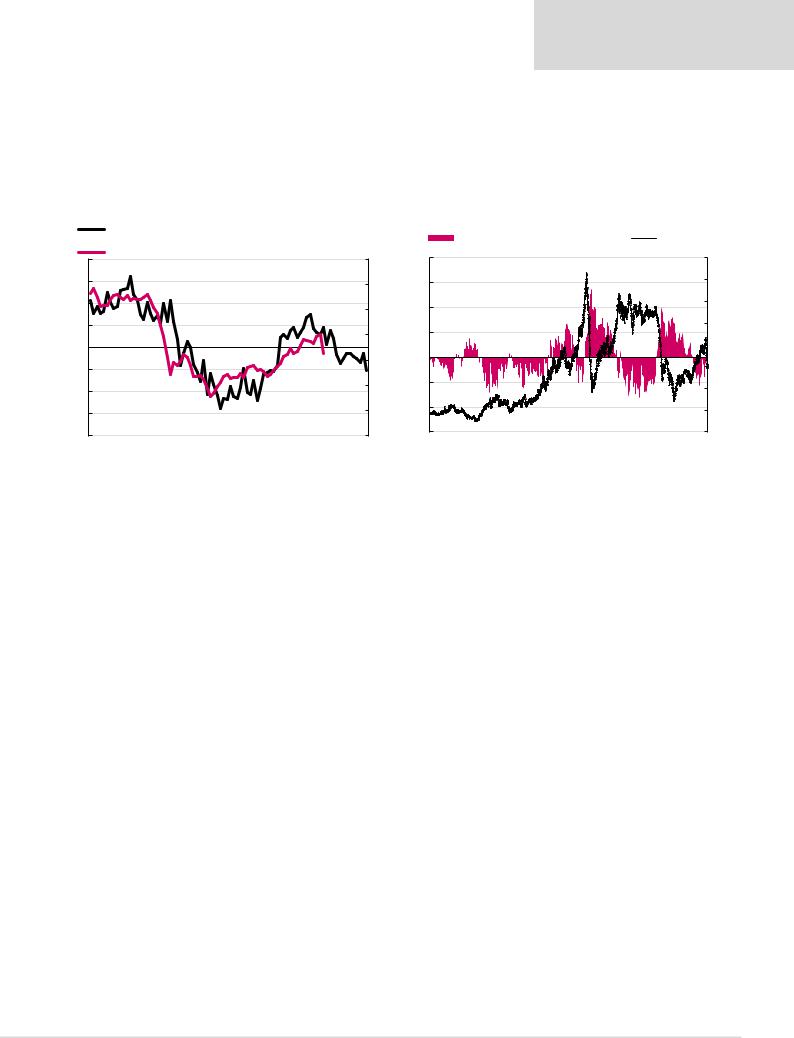
Our estimates remain below Bloomberg consensus, as shown in Figure 162.
Figure 160: OECD commercial liquids inventories and Brent price (rhs) |
Figure 161: Contango/backwardation in one-year Brent oil futures, $/bl |
|||||||||||||||
|
OECD inventories (days of supply) in excess of 5-yr average, mn bls (lhs, |
|
One-year contango/(backwardation) (LHS) |
|
Brent (RHS) |
|||||||||||
|
inverted) |
|
|
|
|
|||||||||||
|
|
|
|
|
|
|
|
|
|
|
|
|
|
|
||
(8) |
Brent oil price, $/bl (rhs) |
140 |
20 |
|
|
|
|
|
|
|
|
|
|
160 |
||
|
|
|
|
|
|
|
|
|
|
|
|
|||||
(6) |
|
|
120 |
15 |
|
|
|
|
|
|
|
|
|
|
140 |
|
(4) |
|
|
100 |
10 |
|
|
|
|
|
|
|
|
|
|
120 |
|
|
|
|
|
|
|
|
|
|
|
|
|
|
|
|||
(2) |
|
|
80 |
5 |
|
|
|
|
|
|
|
|
|
|
100 |
|
|
|
|
|
|
|
|
|
|
|
|
|
|
|
|||
|
|
|
|
|
|
|
|
|
|
|
|
|
|
80 |
||
- |
|
|
|
|
|
|
|
|
|
|
|
|
|
|
||
|
|
|
0 |
|
|
|
|
|
|
|
|
|
|
|
||
|
|
|
60 |
|
|
|
|
|
|
|
|
|
|
60 |
||
2 |
|
|
|
|
|
|
|
|
|
|
|
|
|
|||
|
|
|
|
|
|
|
|
|
|
|
|
|
|
|||
|
|
|
|
|
|
|
|
|
|
|
|
|
|
|
||
4 |
|
|
40 |
-5 |
|
|
|
|
|
|
|
|
|
|
40 |
|
|
|
|
|
|
|
|
|
|
|
|
|
|
||||
|
|
|
|
|
|
|
|
|
|
|
|
|
|
|||
|
|
|
|
|
|
|
|
|
|
|
|
|
|
|
||
6 |
|
|
20 |
-10 |
|
|
|
|
|
|
|
|
|
|
20 |
|
|
|
|
|
|
|
|
|
|
|
|
|
|
||||
|
|
|
|
|
|
|
|
|
|
|
|
|
|
|
||
8 |
|
|
- |
-15 |
|
|
|
|
|
|
|
|
|
|
0 |
|
|
|
95 |
97 |
99 |
01 |
03 |
05 |
07 |
09 |
11 |
13 |
15 |
17 |
|||
Jan-13 |
Nov-13 Sep-14 |
Jul-15 |
May-16 Mar-17 Jan-18 Nov-18 Sep-19 |
|||||||||||||
|
|
|
|
|
|
|
|
|
|
|
|
|||||
|
|
|
Source: EIA, Bloomberg |
|
|
|
|
|
|
|
|
|
|
|
Source: Bloomberg |
|
Figure 162: Our oil price forecasts, $/bl (unless otherwise stated)
|
1Q18 |
2Q18 |
3Q18 |
4Q18E |
2018E |
2019E |
2020E |
Brent |
|
|
|
|
|
|
|
New forecast |
67.0 |
74.6 |
75.3 |
71.0 |
72.0 |
65.0 |
60.0 |
Previous forecast |
67.0 |
74.6 |
75.3 |
75.0 |
73.0 |
65.0 |
60.0 |
Change |
0% |
0% |
0% |
-5% |
-1% |
0% |
0% |
Bloomberg consensus |
|
|
|
|
|
73.2 |
73.0 |
Forward curve |
|
|
|
|
|
60.7 |
60.4 |
|
|
|
|
|
|
|
|
Urals |
|
|
|
|
|
|
|
New forecast |
65.7 |
74.5 |
74.8 |
70.0 |
71.3 |
64.0 |
59.0 |
Previous forecast |
65.7 |
74.5 |
74.8 |
74.0 |
72.3 |
640 |
59.0 |
Change |
0% |
0% |
0% |
-5% |
-1% |
0% |
0% |
Source: Bloomberg Finance LP, Renaissance Capital estimates
76