

vk.com/id446425943
Oil & Gas
2019 outlook
We maintain our positive view on both Russian oil & gas stocks and the emerging European refiners into 2019, supported by a generally favourable oil price/FX backdrop, regulatory opportunities and a continuing strong FCF and dividend outlook. In declining order of upside potential, our top picks in Russia are Gazprom, Rosneft and LUKOIL. In emerging Europe, we prefer MOL Group, Tupras and Grupa LOTOS. With this report we upgrade Petkim to BUY (from Hold), following a more stable outlook on European petrochemical margins and the synergy effect we expect from the recent launch of its STAR refinery. On our revised estimates we adjust our TPs for most stocks – with our TPs on average across the sector higher by 5%.
A year of change, a year of opportunity
The sector is entering a period of unprecedented regulatory change. In Russia, 2019 will see: 1) the start of the big ‘tax manoeuvre’; 2) the introduction of an excess profits tax regime; and 3) a more structured approach to the regulation of domestic product prices. We see growth-oriented and greenfield-heavy Rosneft and Gazprom Neft as most positively exposed to these changes (although we prefer Gazprom as a way to own Gazprom Neft). Elsewhere, the introduction of new marine fuel regulations from 2020 will send shock waves through the whole sector, but should particularly affect the emerging European refineries. We see Grupa LOTOS, Tupras and MOL Group as best positioned.
OPEC+ déjà vu
Russia’s new production cut commitment will reduce 2019 average production growth to just 0.6%, we estimate, with the effects we expect mirroring the November 2016 deal. While we have had to reconsider our production forecasts for the Russian oils – particularly for growth-dependent stocks such as Rosneft and Gazprom Neft – we believe their positive exposure to local regulatory changes and more robust dividend prospects will compensate for potential delays to production growth.
Attractive dividend yields
We forecast a sustainable average yield of 7-8% for the Russian oil & gas sector, further augmented by selected buyback strategies, led in 2018 by Surgutneftegas preferred shares (16.5%), Tatneft prefs (13.3%) and Gazprom Neft (8.8%). In Russia, we see further payout upside for Gazprom, Transneft and Gazprom Neft. We forecast a lower 4% average yield for emerging European refiners in 2018, although with a much wider range between zero (Petkim) and 11% (Tupras).
Sector update
Equity Research 14 December 2018
Oil & Gas
Emerging markets
Alexander Burgansky +44 (207) 005-7982 ABurgansky@rencap.com
Oleg Chistyukhin
+7 (495) 258-7770 x4073 OChistyukhin@rencap.com
Richard Wisentaner
+44 (207) 005-7954 RWisentaner@rencap.com
Summary ratings and TPs (for details of TP changes, see Figure 3)
Ticker |
TP |
CP |
Rating |
GAZP RX |
RUB230 |
RUB158.6 |
BUY |
LKOH RX |
RUB5,860 |
RUB5,267.0 |
BUY |
LTS PW |
PLN102.0 |
PLN84.0 |
BUY |
MOL HB |
HUF4,400 |
HUF3,110 |
BUY |
NVTK RX |
RUB1,080 |
RUB1,101 |
HOLD |
PETKM TI |
TRY7.7 |
TRY5.13 |
BUY* |
PKN PW |
PLN111 |
PLN106.0 |
HOLD |
ROSN RX |
RUB550 |
RUB425.6 |
BUY |
SIBN RX |
RUB380 |
RUB366.7 |
HOLD |
SNGS RX |
RUB120 |
RUB27.9 |
HOLD |
SNGSP RX |
RUB120 |
RUB38.1 |
BUY |
SNP RE |
RON0.50 |
RON0.36 |
BUY |
TATN RX |
RUB750 |
RUB760 |
HOLD |
TATNP RX |
RUB750 |
RUB540 |
BUY |
TRNFP RX |
RUB224,000 |
RUB169,900 |
BUY |
TUPRS TI |
TRY200 |
TRY122.4 |
BUY |
*Previously Hold
Prices in this report are as of market close on 11 December 2018
Source: Bloomberg, Renaissance Capital estimates
Important disclosures are found at the Disclosures Appendix. Communicated by Renaissance Securities (Cyprus) Limited, regulated by the Cyprus Securities & Exchange Commission, which together with non-US affiliates operates outside of the USA under the brand name of Renaissance Capital.

vk.com/id446425943
Contents
Contents |
2 |
Investment summary |
3 |
Themes |
3 |
Stock ideas |
4 |
Model updates and changes to TPs and ratings |
6 |
Total sector return in 2018 YtD |
8 |
Upstream outlook for 2019 |
10 |
A year of regulatory change |
13 |
Who’s the fairest of them all? |
22 |
Downstream outlook: EE refiners |
24 |
Gas market outlook |
27 |
Domestic gas market outlook |
27 |
European gas market outlook |
28 |
Company profiles |
30 |
Rosneft |
31 |
LUKOIL |
34 |
Surgutneftegas |
37 |
Gazprom Neft |
40 |
Tatneft |
43 |
Gazprom |
46 |
NOVATEK |
49 |
Transneft |
52 |
MOL Group |
55 |
Polski Koncern Naftowy ORLEN SA |
58 |
Grupa Lotos |
61 |
OMV Petrom |
64 |
Tupras |
67 |
Petkim |
70 |
Appendix 1. Oil price outlook |
73 |
Supply growth outpaces demand |
74 |
We maintain our 2019 Brent oil price forecast of $65/bl |
75 |
Disclosures appendix |
77 |
Renaissance Capital
14 December 2018
Oil & Gas
2

vk.com/id446425943
Investment summary
We maintain our positive view on both Russian oil & gas stocks and the emerging European refiners into 2019, supported by a generally favourable oil price/FX backdrop, regulatory opportunities and a continuing strong FCF and dividend outlook.
The recent OPEC+ agreement has caused us to reconsider our production forecasts for the Russian oils – particularly for growth-dependent stocks such as Rosneft and Gazprom Neft – but we believe their positive exposure to local regulatory changes and more robust dividend prospects compensate for potential delays to production growth. We prefer
Gazprom as a way of owning Gazprom Neft, considering Gazprom’s dividend upside.
LUKOIL and Tatneft (prefs) will continue to differentiate themselves via FCF focus and high dividend yields; while we think Transneft’s investment case rests on its higher dividend payout ratio. We associate most of NOVATEK’s performance in 2019 with the progress of its long-dated liquefied natural gas (LNG) projects.
In emerging Europe, we expect a growing degree of divergence between the performance of modernised and unmodernised refineries in the run-up to the introduction of new marine fuel regulations from 2020 (IMO2020), with Tupras and Grupa LOTOS providing the best pure-play exposure. We believe 2019 could become an exceptionally strong and eventful year for MOL Group as well, as the years of strategic refocusing and investments come to fruition, while OMV Petrom could benefit from the final investment decision (FID) on the Neptun field. We remain cautious on PKN ORLEN due to investment risks, but upgrade Petkim to BUY (from Hold), with a combination of stabilised European petrochemical margins, forthcoming STAR-related synergies and low valuations outweighing the dividend risk, in our view.
Themes
▪Significant regulatory changes. The sector is entering a period of unprecedented regulatory change. In Russia, 2019 will see: 1) the start of the big ‘tax manoeuvre’; 2) the introduction of an excess profits tax regime; and 3) a more structured approach to the regulation of domestic product prices. We see growthoriented and greenfield-heavy Rosneft and Gazprom Neft as most positively exposed to these changes (although we prefer Gazprom as a way to own Gazprom Neft). Elsewhere, the introduction of new marine fuel regulations from 2020 will send shock waves through the whole sector, but should particularly affect the emerging European refineries. We see Grupa LOTOS, Tupras and MOL Group as best positioned.
▪Attractive dividend payouts and yields. Although Russian oil & gas stocks have already seen major improvements in shareholder distributions, we think there is more to come in 2019. Dividend upside is key to our investment thesis on Gazprom, where we think yields could improve to 9% in the event of a payout ratio of just 25%, with Transneft and Gazprom Neft moving towards 50% payout within next 12 months. Overall, we forecast a sustainable average yield of 7-8% for the Russian oil & gas sector, further augmented by selected buyback strategies.
▪Focus on underperformers. We see particularly strong investment cases for Gazprom and MOL Group, which have underperformed their respective peer group by 20% and 4% in the past 12 months. Our positive case on Gazprom reflects what we view as a disconnect between the company’s share price performance and a visible improvement in both European gas sales and the value of its subsidiaries and associates. Additional upside potential comes from a likely higher dividend for 2018. We believe 2019 could become an exceptionally strong and eventful year for MOL, with stronger refining margins in the run-up to IMO2020 regulations; exploration upside from three new drills in Norway; and a possible resolution of the INA dispute, we think.
Renaissance Capital
14 December 2018
Oil & Gas
3

vk.com/id446425943
Renaissance Capital
14 December 2018
Oil & Gas
Stock ideas
In declining order of upside potential, our top picks in Russia are Gazprom, Rosneft and LUKOIL. In emerging Europe, we prefer MOL Group, Tupras and Grupa LOTOS. Our investment views are summarised in Figure 1.
Figure 1: Summary of our investment views, risks and catalysts for Russian oil and gas companies
Renaissance Capital view |
Main risks to our investment thesis |
|
Catalysts |
||
Rosneft |
|
|
|
|
|
We maintain our positive outlook for Rosneft, driven by its superior growth potential (we forecast |
|
|
▪ |
Growing share of tax- |
|
additional production capacity of 690kboe/d by end-2019), strong FCF outlook and improving |
▪ |
M&A activity |
|
advantaged hydrocarbon |
|
dividend prospects. We believe Rosneft will be one of the beneficiaries of the 2019 tax changes in |
▪ |
Increase in oil trading activity with |
|
production |
|
the Russian oil sector, particularly via the new EPT regime, as well as benefiting from above- |
|
Kurdistan, Venezuela and other |
▪ |
Higher dividend payments due |
|
average logistical co-efficients applied to the calculation of a negative oil excise tax. We maintain |
|
high-risk entities |
|
to growth in reported net |
|
our BUY rating and TP of RUB550/share. |
|
|
|
income |
|
LUKOIL |
|
|
|
|
|
We regard LUKOIL as a core holding in the Russian oil & gas sector. Our positive outlook is |
|
|
|
|
|
supported by LUKOIL’s history of consistently superior corporate governance standards, an |
|
|
▪ |
Attractive shareholder returns in |
|
attractive position in the company’s operating cycle, and a strong focus on shareholder value- |
▪ |
|
|||
LUKOIL could lose out if future |
|
the form of dividends and share |
|||
creation. In addition, we believe LUKOIL will benefit from Russia’s forthcoming oil tax manoeuvre |
|
||||
|
fiscal policy targets to eliminate |
|
buybacks |
||
because of its focus on tax-advantaged hydrocarbon output and attractively located high-quality |
|
▪ |
|||
|
downstream preferences are |
Continuing ramp-up in |
|||
refining assets in Russia. We estimate LUKOIL’s buyback programme will accelerate into 2019 and |
|
||||
|
implemented |
|
production from tax-advantaged |
||
amount to at least $2bn (compared with $655mn spent YtD in 2018), which, when combined with |
|
|
|||
|
|
|
fields |
||
regular dividends, could increase total cash distribution to shareholders to $5bn, a combined yield |
|
|
|
||
|
|
|
|
||
of 8.4% in 2019. We maintain our BUY rating with a 5% higher TP of RUB5,860. |
|
|
|
|
|
Surgutneftegas |
|
|
|
|
|
Our investment case on Surgutneftegas is marred by the still unexplained disappearance of 17.6bn |
|
|
|
|
|
of its treasury shares (representing 40% of its share capital and currently valued at $20bn) between |
|
|
|
|
|
2001 and 2010. The uncertainty over the identity and strategy of the controlling shareholder(s) |
|
|
|
|
|
makes minority shareholders in Surgutneftegas no more than passive observers, while the |
▪ |
Any visible improvement in |
|
|
|
company’s shares represent simply a claim on dividends until the shareholding mystery is |
|
|
|||
|
corporate governance could |
▪ |
|
||
eventually resolved, in our view. The company’s dividend policy is well established, with the |
|
FX movements, which |
|||
|
provide material upside potential |
||||
dividend mainly determined by the effect of FX movements on the company’s $42bn cash pile. We |
▪ |
|
determine future dividends |
||
Main risk to our BUY-rated |
|
||||
believe this means Surgutneftegas offers good exposure to the decline in the rouble/dollar |
|
|
|||
|
preferred share is RUB/$ |
|
|
||
exchange rate. Based on a YE18 rate of RUB65.5/$, we calculate current dividend yields of 2.3% |
|
|
|
||
|
strengthening |
|
|
||
(for commons) and 16.5% (for prefs). We therefore maintain our BUY rating on Surgutneftegas |
|
|
|
||
|
|
|
|
||
prefs and our HOLD on commons. While Surgutneftegas has traded at a negative EV since 2014, |
|
|
|
|
|
our HOLD rating reflects a long history of under-utilisation of its cash pile, while our 9%-higher |
|
|
|
|
|
RUB120 TP reflects our fundamental valuation of the assets. |
|
|
|
|
|
Gazprom Neft |
|
|
|
|
|
We believe Gazprom Neft will be one of the beneficiaries of the 2019 tax changes in the Russian oil |
▪ |
Potential upside risks include |
▪ |
|
|
sector, mainly because of the conversion of its core Novoport field taxation into the EPT regime. |
Transition of core |
||||
|
additional asset transfers from |
||||
Benefiting from above-average production growth (we estimate total hydrocarbon production, |
|
|
Novoportovskoye field to the |
||
|
Gazprom, higher dividend |
|
|||
including associates, will increase by 3.8% in 2019) and tight cost control, Gazprom Neft has |
|
|
new tax regime during 2019 |
||
|
payouts, sanctions removal |
▪ |
|||
delivered stronger-than-expected FCF, with our FCF outlook remaining positive despite an elevated |
▪ |
Potential changes to OPEC+ |
|||
Potential downside risks include |
|||||
capex programme. We believe the company’s dividend payout ratio could increase from 35% (for |
|
deal could affect the company’s |
|||
|
negative tax changes, tightening |
|
|||
9M18), with our 50% expectation for 2020 reflecting a yield of 7.1%. We maintain our HOLD rating |
|
|
growth targets |
||
|
of sanctions |
|
|||
with a 6% higher TP of RUB380. |
|
|
|
||
|
|
|
|
||
Tatneft |
|
|
|
|
|
Tatneft’s recently announced 2030 Strategy promises accelerated production growth and delays full |
▪ |
Tatneft could lose out if future |
▪ |
|
|
|
fiscal policy targets to eliminate |
Improved production growth |
|||
commissioning of the TANECO refinery compared with our previous expectations. A 60% stated |
|
||||
|
downstream preferences are |
|
rates and TANECO profitability |
||
increase in the company’s 2019 capex will pressure its FCF and dividend payouts next year, we |
|
▪ |
|||
|
implemented |
Dividend payout ratio is a key |
|||
estimate, with our estimated sustainable dividend payout ratio of 50% resulting in 2019 dividend |
▪ |
||||
Upside risk to our HOLD-rated |
|
driver of the share price, we |
|||
yields of 5.5% for commons (HOLD) and 7.8% for prefs (BUY). We increase our TP by 1% to |
|
||||
|
common shares is higher |
|
think |
||
RUB750 (from RUB740). |
|
|
|||
|
dividend payouts |
|
|
||
|
|
|
|
||
Gazprom |
|
|
|
|
|
Our BUY rating on Gazprom reflects what we view as a disconnect between the company’s share |
|
|
|
|
|
price performance and a visible improvement in both its main profit-generating business (European |
▪ |
Low dividend payout ratio |
|
|
|
▪ |
Government decisions on |
||||
gas sales) and the value of its subsidiaries and associates. We estimate Gazprom trades at a 64% |
▪ |
Asset transfers, lower gas |
|||
|
Gazprom taxation and |
||||
discount to our SoTP valuation and our 5%-higher RUB230 TP implies 45% upside potential over |
|
demand and prices in Europe, |
|
||
|
|
dividends for 2018 and 2019 |
|||
the next 12 months. Our continuing positive outlook on the Russian oil sector makes Gazprom, in |
|
sanctions tightening, outcome of |
▪ |
||
|
European gas sales and price |
||||
our view, a cheaper and more liquid way to own Gazprom Neft, which we consider one of the |
|
litigation cases with Naftogaz in |
|||
|
|
statistics |
|||
fastest-growing Russian oil producers and one of the main beneficiaries of recent tax reforms. |
|
Stockholm arbitrage |
|
||
|
|
|
|||
Additional upside potential comes from a likely higher dividend for 2018.
Source: Renaissance Capital
4

vk.com/id446425943
Renaissance Capital
14 December 2018
Oil & Gas
Figure 1: Summary of our investment views, risks and catalysts for Russian oil and gas companies (continued)
Renaissance Capital view |
Main risks to our investment thesis |
|
|
Catalysts |
|||||
NOVATEK |
|
|
|
|
|
|
|
|
|
Our fundamentally positive outlook for NOVATEK contrasts with its rich valuation and long-lead |
|
|
|
|
|
|
|
|
|
catalysts. The company’s refocusing towards longer-dated LNG projects means that its catalysts have |
|
|
▪ Potential downside risks include |
|
|
|
|
||
become more long term in nature, with future share price performance likely to reflect a de-risking of |
|
|
▪ |
|
|
||||
|
|
|
negative tax changes, delays with |
|
Monetisation of Arctic LNG-2 |
||||
Arctic LNG-2 and other similar LNG projects as they pass their development milestones. Key in this |
|
|
|
|
|||||
|
|
|
the development of its LNG |
|
▪ |
Progress with the roll-out of |
|||
respect is the FID on Arctic LNG-2 (2019), as well as the entry of additional shareholders into the |
|
|
|
|
|||||
|
|
|
projects, and the tightening of |
|
|
wider LNG strategy |
|||
project, which could allow for an early monetisation of value for NOVATEK. We remain enthusiastic |
|
|
|
|
|
||||
|
|
|
sanctions |
|
|
|
|
||
about NOVATEK’s long-term growth prospects but see better immediate value elsewhere in the |
|
|
|
|
|
|
|
||
|
|
|
|
|
|
|
|
|
|
sector. We slightly increase our TP to RUB1,080 (from RUB1,070) and maintain our HOLD rating. |
|
|
|
|
|
|
|
|
|
Transneft |
|
|
|
|
|
|
|
|
|
Transneft’s dividend payout ratio grew from 5% in 2014 to 43% in 2017. We believe a 50% payout |
|
|
|
|
|
|
|
|
|
ratio will become a permanent feature of the company’s future dividend policy, which would imply a |
|
|
|
|
|
|
|
|
|
2018 dividend of RUB14,177/common share, on our estimates, reflecting a current yield of 8.3%. |
|
|
|
|
|
|
▪ |
2018 dividend decision |
|
Higher dividend payments are just one of the signs of the recent improvements in the company’s |
|
|
▪ Low dividend payout ratio |
|
▪ |
Commencement of share |
|||
corporate governance, with future changes possibly including a conversion of prefs into commons and |
|
|
▪ Tightening of sanctions |
|
|
buyback; possible conversion |
|||
a formal change in the dividend policy to reflect the higher actual payout ratio (vs the 25% currently |
|
|
|
|
|
|
|
of pref shares into commons |
|
stated). Additional upside may be presented by the potential to realise the value of its quasi-treasury |
|
|
|
|
|
|
|
|
|
shareholding and line-fill in the longer term. Maintain BUY with a 4% higher TP of RUB224,000. |
|
|
|
|
|
|
|
|
|
|
|
|
|
|
|
|
|
|
Source: Renaissance Capital |
Figure 2: Summary of our investment views, risks and catalysts for emerging European refining companies |
|
|
|
||||||
Renaissance Capital view |
|
|
Main risks to our investment thesis |
|
|
Catalysts |
|||
MOL Group |
|
|
|
|
|
|
|
|
|
We believe 2019 could be an exceptionally strong and eventful year for MOL as the years of strategic |
|
|
|
|
|
|
|
|
|
focus and investments come to fruition. In the downstream, we upside potential to our estimates of |
|
|
|
|
|
|
|
|
|
refining margins in the run-up to IMO2020 regulations and on the back of high diesel crack spreads in |
|
|
▪ |
Lower-than-expected refining |
|
▪ |
Drilling results on the |
||
Europe. In the upstream, we see exploration potential from three new drills in Norway, with results |
|
|
|
margins in Europe |
|
||||
|
|
▪ |
|
|
Norwegian shelf |
||||
expected by the end of 2019. Elsewhere, the final outcome of arbitration by the International Centre for |
|
|
Lower-than-expected |
|
▪ |
||||
|
|
|
Settlement of INA dispute |
||||||
Settlement of Investment Disputes (ICSID) could pave the way for a resolution of the INA dispute during |
|
|
petrochemical margins in Europe |
|
|||||
|
▪ |
|
▪ |
IMO2020 regulations |
|||||
2019, we think. Poor dividend policy remains the weakest link in MOL’s investment case, in our view, but |
|
Low dividend payouts |
|
||||||
|
|
|
|
||||||
a strong FCF outlook and IMO upside could make special dividends a more permanent feature. Maintain |
|
|
|
|
|
|
|
||
BUY with a 5% higher TP of HUF4,400. |
|
|
|
|
|
|
|
|
|
PKN ORLEN |
|
|
|
|
|
|
|
|
|
PKN ORLEN is the largest refiner in emerging Europe, but its refining margin is one of the lowest due to |
|
▪ Upside risks include higher-than- |
|
▪ |
Planned takeover of Grupa |
||||
its product slate. What we view as the company’s strong FCF potential is offset by low dividend payouts |
|
|
|||||||
|
|
expected refining margins and |
|
|
LOTOS |
||||
and continuing investment risks, related to the pending acquisition of Grupa LOTOS and the possible |
|
|
|
|
▪ |
||||
|
|
|
dividends |
|
FID on Mazeikiai refinery |
||||
construction of a power plant in Poland. We further note the lack of a decision on the required upgrade |
|
|
|
|
|||||
|
|
▪ Downside risks include M&A and |
|
|
upgrade |
||||
of its 204kb/d Mazeikiai refinery, which will put pressure on margins from 2020 due to IMO2020 |
|
|
|
▪ |
|||||
|
|
|
investment activity |
|
IMO2020 regulations |
||||
regulations, we think. Our updated model results in an increased TP of PLN111/share; maintain HOLD. |
|
|
|
|
|||||
|
|
|
|
|
|
|
|
||
Grupa LOTOS |
|
|
|
|
|
|
|
|
|
We think 2019 should be a transformational year for Grupa LOTOS, as the two drivers of its investment |
|
|
▪ Low takeover price by PKN |
|
|
|
|||
|
|
|
ORLEN |
|
▪ |
|
|||
thesis culminate. First is the completion of the EFRA upgrade, which will result in a 31% LfL |
|
|
|
|
Commissioning of EFRA |
||||
|
|
▪ Delays to the commissioning of |
|
||||||
improvement in LOTOS’s refining margin, we estimate. Second is the potential takeover by PKN |
|
|
|
|
project |
||||
|
|
|
the effective refining (EFRA) |
|
▪ |
||||
ORLEN, which is on track to acquire the Polish government’s 53% stake in LOTOS next year, potentially |
|
|
|
IMO2020 regulations |
|||||
|
|
project |
|
||||||
leading to a full takeover. Should LOTOS remain a publicly listed entity into 2020, we see further support |
|
▪ |
|
|
|
||||
|
Lower-than-expected refining |
|
|
|
|||||
from IMO2020 regulations. We maintain our BUY rating with an 11% higher TP of PLN102. |
|
|
|
|
|
||||
|
|
|
margins in Europe |
|
|
|
|||
|
|
|
|
|
|
|
|
||
OMV Petrom |
|
|
|
|
|
|
|
|
|
OMV Petrom benefits from material exposure to conventional upstream production in Romania, with |
|
|
|
|
|
|
|
|
|
further upside potential from the Neptun discovery, where an FID was recently delayed into 2019. The |
|
|
|
|
|
|
|
|
|
company’s refining exposure is via the Petrobrazi refinery, which has above-average profitability due to |
|
|
▪ Lack of FID on Neptune field |
|
▪ |
FID on Neptune field |
|||
its high complexity and inland premium pricing. Attractively valued, in our view, at a 2019E EV/EBITDA |
|
|
▪ |
Lower-than-expected refining |
|
||||
|
|
|
▪ |
IMO2020 regulations |
|||||
multiple of 2.1x and a current dividend yield of 5.8%, OMV Petrom’s investment case combines the |
|
|
|
margins in Europe |
|
||||
|
|
|
|
|
|
||||
benefits of EE’s downstream exposure with upstream upside and low relative valuations. Maintain BUY |
|
|
|
|
|
|
|
|
|
with a 9% higher TP of RON0.50. |
|
|
|
|
|
|
|
|
|
Tupras |
|
|
|
|
|
|
|
|
|
Tupras operates some of the most advanced and flexible refineries in the region. We believe it is well |
|
|
|
|
|
|
|
|
|
positioned to benefit from both structural growth in fuel demand in Turkey, and our expectations of a |
|
|
▪ Lower-than-expected refining |
|
▪ |
|
|||
pick-up in global demand for middle distillates, following the tightening of bunker fuel specification |
|
|
|
2018 dividend decision |
|||||
|
|
|
margins in Europe |
|
|||||
standards in 2020. Reaping the benefits of its recent $3bn RUP investment, we forecast low levels of |
|
|
▪ |
|
▪ |
IMO2020 regulations |
|||
|
|
Low dividend payouts |
|
||||||
capex and high levels of FCF, with a near-90% dividend payout ratio and a sustainable dividend yield of |
|
|
|
|
|||||
|
|
|
|
|
|
|
|||
above 10%. We maintain our BUY rating with a revised TP of TRY200 (from TRY176). |
|
|
|
|
|
|
|
|
|
Petkim |
|
|
|
|
|
|
|
|
|
We upgrade Petkim to BUY (from Hold) following a more stable outlook on European petrochemical |
|
|
|
|
|
|
|
|
|
margins, the recent launch of its 18%-owned STAR refinery and the completion of Petkim’s 60-day |
|
|
▪ Lower-than-expected |
|
|
|
|||
shutdown. A 23% drop in Europe’s ethylene prices during 2018 has caused a 12% narrowing of the |
|
|
|
petrochemical margins in Europe |
|
▪ |
2018 dividend decision |
||
NEW LLDPE/naphtha spread and a 49% decline in Petkim’s dollar share price. We view high ethylene |
|
|
▪ No dividends for 2018 (this may |
|
▪ |
Synergy effect from the |
|||
prices in Europe as a cause for concern, particularly in light of Petkim’s high share of thermoplastics |
|
|
|
be taken negatively by the market |
|
ramp-up of the STAR |
|||
output. The launch of the STAR refinery in late 2018 should strengthen the supply chain and provide |
|
|
|
although it is in line with our |
|
|
refinery |
||
substantial synergies to Petkim from 2019. We calculate Petkim trades at 2019E FCF and dividend |
|
|
|
estimates) |
|
|
|
||
yields of -10.9% and 7.7%, respectively. |
|
|
|
|
|
|
|
|
|
Source: Renaissance Capital
5

vk.com/id446425943
Renaissance Capital
14 December 2018
Oil & Gas
Model updates and changes to TPs and ratings
We have updated our company models and detail the changes to our TPs and ratings in Figure 3, while our estimate changes are summarised in Figure 4. With this report we upgrade Petkim to BUY (from Hold), following a more stable outlook on European petrochemical margins and the synergy effect we expect from the recent launch of the STAR refinery.
Figure 3: Changes to our ratings and TPs
Stock |
|
|
|
|
Old |
|
|
|
|
|
|
New |
|
|
|
|
Potential upside/ |
|
|||
|
|
|
TP, RUB/share |
Rating |
|
TP, RUB/share |
|
% chg |
|
|
Rating |
TP/Rating |
|
(downside) |
|
|
|||||
|
|
|
|
|
|
|
|
|
|
|
|||||||||||
Rosneft |
|
|
|
|
550 |
Buy |
|
|
550 |
|
0% |
|
|
BUY |
=/= |
|
|
29% |
|
|
|
LUKOIL |
|
|
|
|
5,600 |
Buy |
|
|
5,860 |
5% |
|
|
BUY |
+/= |
|
|
11% |
|
|
||
Gazprom Neft |
|
|
|
|
360 |
Hold |
|
|
380 |
|
6% |
|
|
HOLD |
=/= |
|
|
4% |
|
|
|
Surgutneftegas (common) |
|
|
110 |
Hold |
|
|
120 |
9% |
|
|
HOLD |
+/= |
|
|
330% |
|
|
||||
Surgutneftegas (preferred) |
|
|
110 |
Buy |
|
|
120 |
|
9% |
|
|
BUY |
+/= |
|
|
215% |
|
|
|||
Tatneft (common) |
|
|
|
|
740 |
Hold |
|
|
750 |
1% |
|
|
HOLD |
+/= |
|
|
-1% |
|
|
||
Tatneft (preferred) |
|
|
|
|
740 |
Buy |
|
|
750 |
|
1% |
|
|
BUY |
+/= |
|
|
39% |
|
|
|
Gazprom |
|
|
|
|
220 |
Buy |
|
|
230 |
5% |
|
|
BUY |
+/= |
|
|
45% |
|
|
||
NOVATEK |
|
|
|
|
1,070 |
Hold |
|
|
1,080 |
|
1% |
|
|
HOLD |
+/= |
|
|
-2% |
|
|
|
Transneft (preferred) |
|
|
215,000 |
Buy |
|
|
224,000 |
4% |
|
|
BUY |
=/= |
|
|
32% |
|
|
||||
|
|
|
|
|
|
|
|
|
|
|
|
|
|
|
|
|
|
|
|
|
|
Stock |
|
|
|
|
Old |
|
|
|
|
|
|
New |
|
|
|
|
Potential upside/ |
||||
|
|
|
TP, LCY/share |
Rating |
|
TP, LCY/share |
|
% chg |
|
|
Rating |
TP/Rating |
|
(downside) |
|
|
|||||
|
|
|
|
|
|
|
|
|
|
|
|||||||||||
PKN Orlen |
|
|
|
|
PLN98 |
Hold |
|
|
PLN111 |
|
13% |
|
|
HOLD |
+/= |
|
|
5% |
|
|
|
MOL Group |
|
|
|
|
HUF4,200 |
Buy |
|
HUF4,400 |
5% |
|
|
BUY |
+/= |
|
|
41% |
|
|
|||
Grupa LOTOS |
|
|
|
|
PLN92 |
Buy |
|
|
PLN102 |
|
11% |
|
|
BUY |
+/= |
|
|
21% |
|
|
|
OMV Petrom |
|
|
|
|
RON0.46 |
Buy |
|
RON0.50 |
9% |
|
|
BUY |
+/= |
|
|
39% |
|
|
|||
Tupras |
|
|
|
|
TRY176 |
Buy |
|
TRY200 |
|
14% |
|
|
BUY |
+/= |
|
|
63% |
|
|
||
Petkim |
|
|
|
|
TRY8.0 |
Hold |
|
|
TRY7.7 |
-3% |
|
|
BUY |
-/+ |
|
|
50% |
|
|
||
|
|
|
|
|
|
|
|
|
|
|
|
|
|
|
|
|
Source: Renaissance Capital estimates |
||||
Figure 4: Change in estimates |
|
|
|
|
|
|
|
|
|
|
|
|
|
|
|
|
|
|
|
||
|
|
|
|
|
Previous estimates |
|
|
|
|
|
New estimates |
|
|
|
Change in estimates |
|
|
||||
|
|
|
|
|
2019 |
2020 |
|
|
2019 |
|
2020 |
|
2019 |
|
2020 |
|
|
||||
Company |
Currency |
|
EBITDA |
Net income |
EBITDA Net income |
|
EBITDA |
Net income |
EBITDA |
|
Net income |
EBITDA |
Net income |
EBITDA Net income |
|||||||
Rosneft |
RUBbn |
|
2,117 |
777 |
2,200 |
916 |
|
2,144 |
771 |
2,264 |
|
980 |
1% |
-1% |
3% |
7% |
|
||||
LUKOIL |
RUBbn |
|
1,066 |
514 |
950 |
419 |
|
993 |
453 |
1,011 |
459 |
-7% |
-12% |
6% |
9% |
|
|||||
Gazprom Neft |
RUBbn |
|
531 |
312 |
489 |
266 |
|
489 |
243 |
507 |
|
246 |
-8% |
-22% |
4% |
-7% |
|
||||
Surgutneftegas |
RUBbn |
|
530 |
468 |
488 |
423 |
|
532 |
469 |
505 |
435 |
0% |
0% |
3% |
3% |
|
|||||
Tatneft |
RUBbn |
|
276 |
196 |
265 |
182 |
|
282 |
194 |
271 |
|
180 |
2% |
-1% |
2% |
-1% |
|
||||
NOVATEK |
RUBbn |
|
239 |
236 |
254 |
263 |
|
225 |
224 |
247 |
256 |
-6% |
-5% |
-3% |
-3% |
|
|||||
Gazprom |
RUBbn |
|
2,098 |
1,223 |
2,156 |
1,208 |
|
2,051 |
1,150 |
2,153 |
|
1,165 |
-2% |
-6% |
0% |
-4% |
|
||||
Transneft |
RUBbn |
|
450 |
198 |
454 |
190 |
|
480 |
196 |
484 |
188 |
7% |
-1% |
7% |
-1% |
|
|||||
PKN Orlen |
PLNmn |
|
9,170 |
5,163 |
9,291 |
5,236 |
|
9,268 |
5,307 |
9,365 |
|
5,360 |
1% |
3% |
1% |
2% |
|
||||
MOL Group |
HUFmn |
|
701 |
247 |
688 |
237 |
|
732 |
273 |
707 |
255 |
4% |
11% |
3% |
8% |
|
|||||
Grupa LOTOS |
PLNmn |
|
3,609 |
2,010 |
4,062 |
2,364 |
|
3,947 |
2,256 |
4,255 |
|
2,507 |
9% |
12% |
5% |
6% |
|
||||
OMV Petrom |
RONmn |
|
7,156 |
2,918 |
6,767 |
2,612 |
|
7,166 |
3,012 |
6,810 |
2,721 |
0% |
3% |
1% |
4% |
|
|||||
Tupras |
TRYmn |
|
9,511 |
6,589 |
9,639 |
6,775 |
|
9,790 |
6,606 |
10,175 |
|
7,283 |
3% |
0% |
6% |
8% |
|
||||
Petkim |
TRYmn |
|
1,791 |
1,418 |
2,496 |
2,082 |
|
1,635 |
1,295 |
2,368 |
1,976 |
-9% |
-9% |
-5% |
-5% |
|
|||||
Source: Renaissance Capital
6
vk.com/id446425943
|
|
|
|
|
|
|
|
|
|
|
|
|
|
|
|
|
|
|
|
|
|
Renaissance Capital |
|||
|
|
|
|
|
|
|
|
|
|
|
|
|
|
|
|
|
|
|
|
|
|
|
14 December 2018 |
||
|
|
|
|
|
|
|
|
|
|
|
|
|
|
|
|
|
|
|
|
|
|
|
|
Oil & Gas |
|
|
|
|
|
|
|
|
|
|
|||||||||||||||||
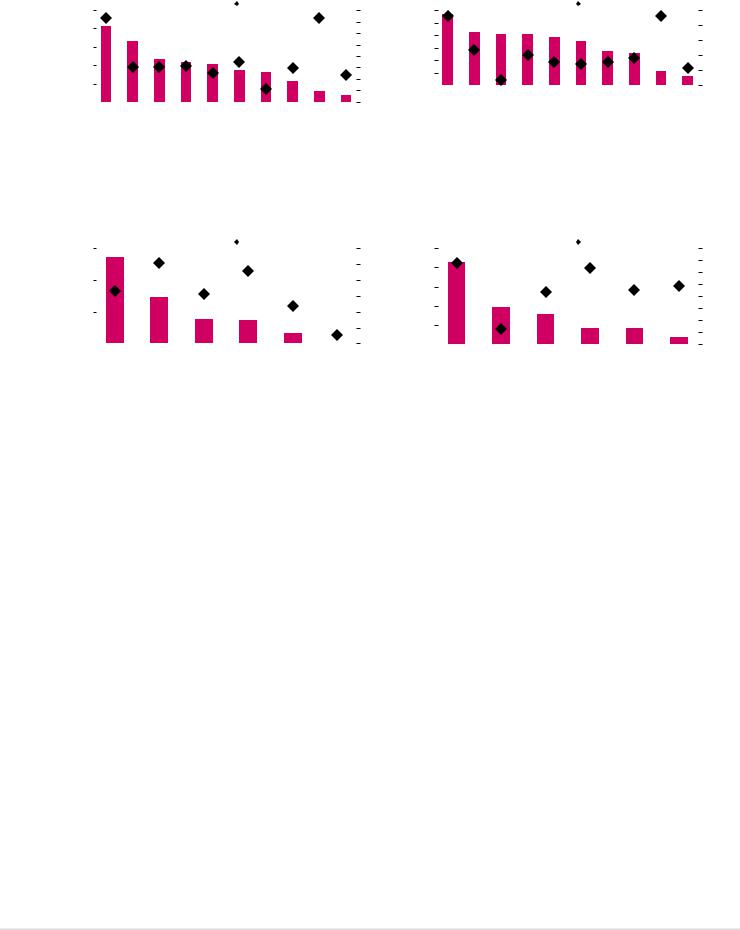
Figure 5: Russian oil and gas – FCF and dividend yield by company, 2018E |
Figure 6: Russian oil and gas – FCF and dividend yield by company, 2019E |
||||||||||||||||||||||||
20% |
|
|
|
|
Dividend yield |
FCF yield (rhs) |
|
|
60% |
12% |
|
|
|
|
Dividend yield |
FCF yield (rhs) |
|
|
40% |
||||||
|
|
|
|
|
|
|
|
|
|
|
|
||||||||||||||
|
|
|
|
|
|
|
|
|
|
|
|
||||||||||||||
|
|
|
|
|
|
|
|
|
|
|
|
|
|
|
|
|
|
|
|
|
|
||||
16% |
|
|
|
|
|
|
|
|
|
|
|
50% |
10% |
|
|
|
|
|
|
|
|
|
|
|
30% |
|
|
|
|
|
|
|
|
|
|
|
|
|
|
|
|
|
|
|
|
|
|
||||
|
|
|
|
|
|
|
|
|
|
|
40% |
8% |
|
|
|
|
|
|
|
|
|
|
|
20% |
|
|
|
|
|
|
|
|
|
|
|
|
|
|
|
|
|
|
|
|
|
|
|
|
|||
12% |
|
|
|
|
|
|
|
|
|
|
|
30% |
6% |
|
|
|
|
|
|
|
|
|
|
|
|
|
|
|
|
|
|
|
|
|
|
|
|
|
|
|
|
|
|
|
|
|
|
10% |
|||
8% |
|
|
|
|
|
|
|
|
|
|
|
20% |
4% |
|
|
|
|
|
|
|
|
|
|
|
|
|
|
|
|
|
|
|
|
|
|
|
10% |
|
|
|
|
|
|
|
|
|
|
|
0% |
||
|
|
|
|
|
|
|
|
|
|
|
2% |
|
|
|
|
|
|
|
|
|
|
|
|||
|
|
|
|
|
|
|
|
|
|
|
|
0% |
|
|
|
|
|
|
|
|
|
|
|
||
|
|
|
|
|
|
|
|
|
|
|
|
|
|
|
|
|
|
|
|
|
|
|
|
||
4% |
|
|
|
|
|
|
|
|
|
|
|
0% |
|
|
|
|
|
|
|
|
|
|
|
-10% |
|
|
|
|
|
|
|
|
|
|
|
|
-10% |
|
|
|
|
|
|
|
|
|
|
|
|||
|
Surgutneftegas pref |
prefTatneft |
commTatneft |
NeftGazprom |
prefTransneft |
Rosneft |
Gazprom |
LUKOIL |
Surgutneftegas |
NOVATEK |
|
prefSurgutneftegas |
Rosneft |
Gazprom |
prefTransneft |
prefTatneft |
NeftGazprom |
commTatneft |
LUKOIL |
Surgutneftegas |
NOVATEK |
||||
0% |
-20% |
|
|||||||||||||||||||||||
|
|
|
|
|
|
|
|
|
|
|
|
|
|
|
|
|
|
|
|
|
|
|
|
||
|
|
|
|
|
|
|
|
|
Source: Renaissance Capital estimates |
|
|
|
|
|
|
|
|
|
Source: Renaissance Capital estimates |
||||||
Figure 7: EE refiners – FCF and dividend yield by company, 2018E |
|
|
Figure 8: EE refiners – FCF and dividend yield by company, 2019E |
|
|
||||||||||||||||||||
12% |
|
|
|
|
Dividend yield |
FCF yield (rhs) |
|
|
20% |
20% |
|
|
|
|
Dividend yield |
FCF yield (rhs) |
|
|
25% |
||||||
|
|
|
|
|
|
|
|
|
|
|
|
||||||||||||||
|
|
|
|
|
|
|
|
|
|
|
|
||||||||||||||
|
|
|
|
|
|
|
|
|
|
|
|
|
|
|
|
|
|
|
|
|
|
||||
|
|
|
|
|
|
|
|
|
|
|
|
15% |
16% |
|
|
|
|
|
|
|
|
|
|
|
20% |
|
|
|
|
|
|
|
|
|
|
|
|
|
|
|
|
|
|
|
|
|
|
|
15% |
||
|
|
|
|
|
|
|
|
|
|
|
|
|
|
|
|
|
|
|
|
|
|
|
|
||
8% |
|
|
|
|
|
|
|
|
|
|
|
10% |
|
|
|
|
|
|
|
|
|
|
|
|
|
|
|
|
|
|
|
|
|
|
|
|
12% |
|
|
|
|
|
|
|
|
|
|
|
10% |
||
|
|
|
|
|
|
|
|
|
|
|
|
|
|
|
|
|
|
|
|
|
|
||||
|
|
|
|
|
|
|
|
|
|
|
|
5% |
|
|
|
|
|
|
|
|
|
|
|
||
|
|
|
|
|
|
|
|
|
|
|
|
8% |
|
|
|
|
|
|
|
|
|
|
|
5% |
|
4% |
|
|
|
|
|
|
|
|
|
|
|
0% |
|
|
|
|
|
|
|
|
|
|
|
0% |
|
|
|
|
|
|
|
|
|
|
|
|
|
|
|
|
|
|
|
|
|
|
|
||||
|
|
|
|
|
|
|
|
|
|
|
4% |
|
|
|
|
|
|
|
|
|
|
|
-5% |
||
|
|
|
|
|
|
|
|
|
|
|
|
-5% |
|
|
|
|
|
|
|
|
|
|
|
||
|
|
|
|
|
|
|
|
|
|
|
|
|
|
|
|
|
|
|
|
|
|
|
-10% |
||
|
|
|
|
|
|
|
|
|
|
|
|
|
|
|
|
|
|
|
|
|
|
|
|
||
|
|
|
|
|
|
|
|
|
|
|
|
|
|
|
|
|
|
|
|
|
|
|
|
|
|
0% |
|
|
|
|
|
|
|
|
|
|
|
-10% |
0% |
|
|
|
|
|
|
|
|
|
|
|
-15% |
|
Tupras |
|
OMV Petrom |
|
PKN Orlen |
MOL Group |
|
Grupa LOTOS |
|
Petkim |
|
Tupras |
|
Petkim |
|
OMV Petrom |
MOL Group |
|
PKN Orlen |
|
Grupa LOTOS |
||||
|
|
|
|
|
|
|
|
|
Source: Renaissance Capital estimates |
|
|
|
|
|
|
|
|
|
Source: Renaissance Capital estimates |
||||||
7