

Brt max Service Questionnaire
Thank you for taking the time to fill out this survey. We are part of a research team conducting an evaluation of the MAX service for the Federal Transit Administration. We value your opinions and appreciate your assistance with our evaluation.
1. Did you drive vehicles for CAT prior to driving on the MAX route?
Yes
No – I’m a new driver
No – I worked for another ATC operation in another part of the country
2. How long have you been driving for CAT?
Less than 1 year Between 1 year and 3 years
Between 3 and 5 years Between 5 and 10 years
More than 10 years
3. How long have you been driving the CIVIS vehicle on the MAX route?
Since service began – about 2 years
Less than 2 years but more than 1 year
Less than 1 year
4. Do you still sometimes drive CAT routes?
Yes No
5. Generally speaking, do you prefer driving the CIVIS over CAT vehicles?
Yes No Other: ______________________________
6. Please rate how the CIVIS compares with standard CAT vehicles for the following features:
Better Neutral Worse
Driver Comfort/Ride
Passenger Comfort
Vehicle Handling/ Maneuverability
Safety – on road performance
Driver sense of security & safety
Overall Vehicle Performance
7. The CIVIS vehicle has a center drive position. Based on your experience driving from the center position CIVIS vehicle as compared with driving from the left hand position with CAT vehicles, how do the following features rate:
Better Neutral Worse
Forward visibility
Left Side visibility
Right side visibility
Rear visibility
Lining up with curb/platform
General operations
8. How difficult it is to make a stop close to the curb and at the designated door locations?
Very Difficult Neutral Not
Difficult at
All
Challenge of docking vehicle
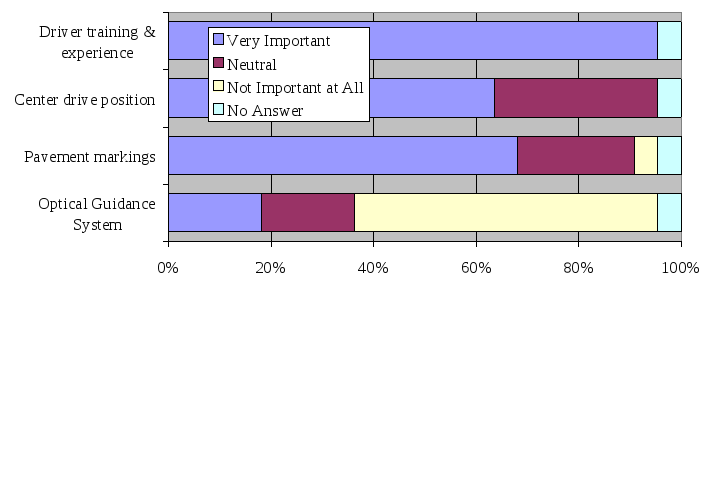
9. How important are the following features are helping you dock the vehicle and make precision stops?
Very Not
Important Neutral Important
at All
Driver training & experience
Center drive position
Pavement markings
Optical Guidance System
10. How does each of the following MAX features services contribute to route speed and service reliability as compared with standard CAT service:
Improves Reduces
Speed No Speed &
Reliability Effect Reliability
Multiple doors for entry/exit
Off-board fare collection
Passenger accessibility
ADA passenger accessibility
Signal priority at intersections
Queue jump
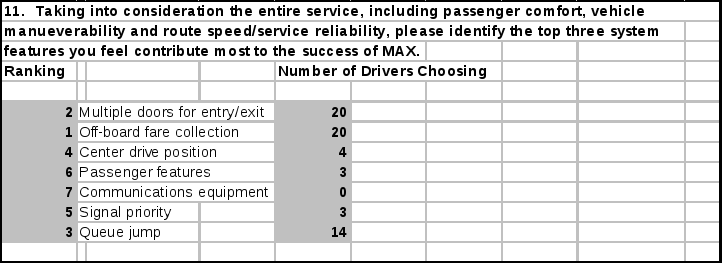
11. Taking into consideration the entire service, including passenger comfort, vehicle maneuverability and route speed/service reliability, please identify the top three system features you feel contribute most to the success of MAX.
Ranking
Multiple doors for entry/exit ____
Off-board fare collection ____
Center drive position ____
Passenger features ____
Communications equipment ____
Signal priority ____
Queue jump ____


COMPARISON GRAPH

VISIBILITY GRAPH

DOCKING GRAPH
SPEED COMPONENT GRAPH

1 The Evaluation Guidelines for BRT Demonstration Projects can be found at http://www.itsdocs.fhwa.dot.gov//JPODOCS/REPTS_TE//13831.html
CBRT report is available at http://www.gobrt.org/CBRT-DecisionMaking.pdf
2 The other bus system using proof of payment is the Los Angeles Metro Orange Line, which opened in October 2005. Proof of payment is used on many bus systems around the world and on every new light rail system in the U.S. and Canada. It is also used on the Transitway portion of the Ottawa bus system.
3 See RTC, FAST. Transit Signal Priority Implementation Summary Report. June 15, 2005.
4 The data for MAX with TSP off were from Thursday, September 15, 2005 to Saturday, September 24, 2005 (10 days). The data for MAX with TSP in operation were from Tuesday, September 27, 2005 to Monday, October 1, 2005 (7 days).
5 Following the Route 113 schedule for July 2006, we added 7 minutes to the southbound trips to account for the Washington Street to DTC segment, except in the overnight (10 pm to 5 am) period, where we added 6 minutes. For northbound 113 trips, we added 9 minutes for the DTC to Washington segment during the 7 am to 7 pm period, 7 minutes during the overnight period, and 8 minutes at other times. For MAX, following trip data prepared for the October 2006 schedule, we added 9 minutes to account for the DTC to Jerry’s Nugget segment northbound and 8 minutes to account for the same segment southbound, at all times. Note that for both MAX and 113 the south and north routings are different, hence the different travel times. Schedule data were provided by Jacob Simmons of RTC.
6 The week of data was for August 25 to 31, 2006.
7 The previous evaluation of MAX produced for FTA showed travel time savings of 38%- 42% during several time periods. One explanation for the somewhat lower time savings documented here is that the previous study compared MAX to Route 113 prior to MAX service. Many 113 riders changed to MAX when the service became available, and the lower ridership on MAX has possibly resulted in lower dwell times and faster service.
8 RTC conducted on-board passenger surveys in both April and October of 2005. The second survey was conducted to ask additional questions, gauge changes in opinion, and verify the validity of responses to the first survey. Each round of surveys targeted 225 MAX passengers and 225 Route 113 passengers.
9 The calculation of standard deviation of trip times excludes Route 113 trips starting at times when MAX does not operate, namely 10 pm to 5 am.
10 The 2004 benchmark survey had 599 valid respondents interviewed from December 5-17, 2004. The 2005 benchmark survey had a total sample size of 600 Las Vegas Valley residents interviewed from January 16-23, 2006.
11 RTC estimates MAX operating revenues by crediting to MAX all TVM sales of one-ride tickets except those sold at TVMs located on the Strip and by allocating pass revenues based on the percentage of pass usage, as estimated based on the fare payment control counts. As of June 2006, RTC was waiting for a software change to the PDAs used to check fares. RTC expects the change will produce better estimates of use of different fare media.