- •2006 Evaluation of the Las Vegas Metropolitan Area Express (max) Bus Rapid Transit Project
- •Max is one of 17 National brt Projects that make up the brt Consortium supported by fta
- •Executive Summary III max Project Fact Sheet VII
- •List of Exhibits 79
- •1.0 Introduction
- •1.1 Evaluation Overview
- •1.2 Max Evaluation Objectives
- •Max evaluation objectives
- •Figure 2-1: max system schematic map
- •2.1 Project and Corridor Description
- •2.2 Running Ways
- •Figure 2-2: More than half of max’s 7.5 mile route is an exclusive curbside bus lane
- •2.3 Stations
- •Figure 2-3: Typical max station (Jerry’s Nugget South)
- •Figure 2-4: Lake Mead station with max ticket vending machine
- •Figure 2-5: Las Vegas Downtown Transportation Center
- •2.4 Vehicles
- •2.5 Fare Collection
- •Figure 2-10: Ticket Vending Machine
- •Figure 2-11: Uniformed security officer checking for fare proof of payment using Personal Digital Assistant
- •2.6 Intelligent Transportation Systems (its)
- •2.7 Service and Operations Plans
- •2.8 Branding and Marketing
- •Figure 2-12: max marketing materials
- •Figure 2-13: Opening Day Celebration
- •3.0 System costs
- •3.1 Capital Costs
- •Table 3-1: Overview of Capital Costs associated with the max service*
- •3.2 Operating Costs
- •Vehicle Operation & Maintenance
- •Table 3-2: max Operating Costs, July 2004 to December 2005
- •4.1 Planning and Design
- •4.2 Vehicle Service, Maintenance and Operations Plan
- •Vehicle Service Plan
- •Vehicle Maintenance
- •Vehicle Operations
- •4.3 Implementation and Management of the its Elements
- •4.4 Branding and Public Acceptance of Service
- •Figure 4-2: Deuce, rtc's new double decker bus, operates on the heavily traveled Las Vegas strip.
- •Table 4-3: Importance of max features in docking the vehicle for precise stops*
- •5.1 Travel Time
- •Table 5-5: Has your travel time changed since riding max?
- •Figure 5-1: Has your travel time changed since riding max? (October 2005)
- •Table 5-6: Rate the speed of travel on max and cat
- •Table 5-7: For riders transferring from other cat/max routes, how long did you wait at the location you transferred? (October 2005)
- •Table 5-8: Rate the Wait Time at max and cat Stations
- •Table 5-9: Dwell Time Model Results
- •5.2 Reliability
- •Table 5-10: Rate the Dependability of max and cat
- •Figure 5-3: Driver Assessment of max features for route speed and reliability compared to cat
- •5.3 Identity and Image
- •Table 5-11: Passenger Rating of Vehicles and Shelters,
- •Max and cat riders
- •Table 5-12: All things considered rating of max and cat by riders of the service
- •Figure 5-4: Overall Rating of max / cat Service (October 2005)
- •Figure 5-5: Survey of cat riders, “Have you ever ridden max?”
- •Table 5-13: Overall rating of max service by cat riders and cat service by max riders
- •Figure 5-6: Survey of cat riders, “Do you prefer to ride cat or max?”
- •5.4 Safety and Security
- •Table 5-14: Rate the Safety of max / cat Vehicle
- •Figure 5-8: Rate the Safety of max Stations / cat Stops (October 2005)
- •5.5 Capacity
- •6.1 Ridership
- •Figure 6-1: Average Boardings per Day, max and 113, January 2004 to July 2006
- •Figure 6-3: Index of Changes in Boardings, lvbn Corridor and Systemwide
- •Table 6-1: Previous mode of max riders
- •Figure 6-4: Previous mode of max riders (October 2005)
- •Table 6-2: Rider ethnicity
- •Figure 6-5: Rider ethnicity
- •Table 6-3: Rider age
- •Figure 6-6: Rider age
- •Table 6-4: Employment status
- •Figure 6-7: Employment status
- •Table 6-5: Rider gender
- •6.2 Capital Cost Effectiveness
- •6.3 Operating Cost Efficiency
- •Figure 6-8: Intensity of Use, max compared to 113
- •Figure 6-9: max Operating Cost per Vehicle Hour
- •Figure 6-10: max Operating Cost per Boarding
- •6.4 Land Use
- •Figure 6-11: Opportunities for Redevelopment: North Las Vegas
- •6.5 Environmental Quality
- •7.1 Max is a success
- •7.2 What Works
- •Table 7-1: Calculation of Time Savings per Trip due to Dwell Time Reduction during Peak (7 am to 7 pm)
- •7.3 Summary of Lessons Learned
- •Vehicle Procurement
- •Its: Traffic Signal Priority and Queue Jumper Technology
- •Brt max Service Questionnaire


PROJECT #FTa-dc26-7248-2006.1
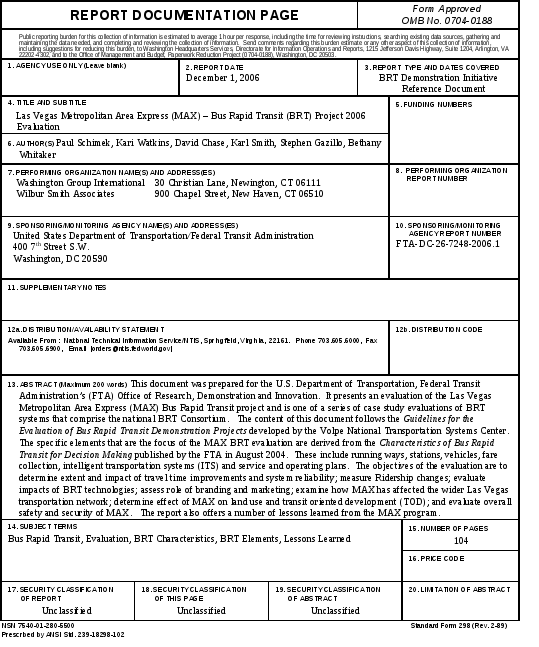
2006 Evaluation of the Las Vegas Metropolitan Area Express (max) Bus Rapid Transit Project
A&E Services
For Bus Rapid Transit Initiative
Contract No. DTFT60-02-D-00009
Task 2. Evaluation Assistance
Prepared by
Washington Group International, Inc
Wilbur Smith Associates
DECEMBER 1, 2006
NOTICE:
This
document is disseminated under the sponsorship of the United States
Department of Transportation in the interest of information
exchange. The United States Government assumes no liability for
its contents or use thereof.
The
United States Government does not endorse manufacturers or
products. Trade or manufacturer’s names appear herein solely
because they are essential to the objective of this report.

Foreword
The U.S. Department of Transportation’s Federal Transit Administration (FTA) is conducting a series of case study evaluations of the 17 Bus Rapid Transit (BRT) systems that comprise the National BRT Consortium. The Las Vegas Metropolitan Area Express (MAX) project is one of the 17 projects. This report documents the second evaluation of the Las Vegas MAX BRT project to determine the full effects of its implementation as the system matured. MAX BRT service was implemented with the goal of providing faster, more reliable, and more accessible transit service in Northern Las Vegas.
W
Max is one of 17 National brt Projects that make up the brt Consortium supported by fta
ashington Group International and Wilbur Smith Associates –
international planning and engineering firms - prepared the 2006
evaluation under contract to and with guidance from the FTA Office
of Mobility Innovation. The evaluation is based on the Guidelines
for the Evaluation of BRT Demonstration Projects,
developed by the Volpe National Transportation Systems Center. The
first evaluation, published in 2005 shortly after MAX began
operations, was a welcome success.
The FTA is evaluating each of the projects in the National BRT Consortium to address the significant issues associated with the implementation and operation of BRT service. Sharing of this information with a broad audience of federal, state and local transportation agencies and consultants will greatly assist planners as they look to evaluate new transit options for their communities.
Table of Contents
Executive Summary III max Project Fact Sheet VII
1.0 Introduction
1.1 Evaluation Overview 1
1.2 MAX Evaluation Objectives 2
2.0 Project Elements 3
2.1 Project and Corridor Description 4
2.2 Running Ways 4
2.3 Stations 5
2.4 Vehicles 7
2.5 Fare Collection 10
2.6 ITS 12
2.7 Service and Operations Plans 12
2.8 Branding and Marketing 13
3.0 System Costs 16
3.1 Capital Costs 16
3.2 Operating Costs 18
4.0 Planning, Design, and Implementation 20
4.1 Planning and Design 20
4.2 Vehicle Service, Maintenance and Operations Plan 20
-
Implementation and Management of the ITS Elements 23
-
Branding and Public Acceptance of Service 30
5.0 Evaluation of System Performance 33
5.1 Travel Time 33
5.2 Reliability 42
5.3 Identity and Image 43
5.4 Safety and Security 52
5.5 Capacity 56
6.0 System Benefits 57
6.1 Ridership 57
6.2 Capital Cost Effectiveness 64
6.3 Operating Cost Efficiency 65
6.4 Land Use 68
6.5 Environmental Quality 71
7.0 Conclusions- Observations and Lessons Learned 73
7.1 MAX is a Success 73
7.2 What Works 74
7.3 Summary of Lessons Learned 75
