

ppl_03_e2
.pdfCustomer: Oleg Ostapenko E-mail: ostapenko2002@yahoo.com
CHAPTER 5
AERONAUTICAL CHARTS AND
CHART-MAKING
67

Order: 6026
Customer: Oleg Ostapenko E-mail: ostapenko2002@yahoo.com
Customer: Oleg Ostapenko E-mail: ostapenko2002@yahoo.com
CHAPTER 5: AERONAUTICAL CHARTS AND CHART-MAKING
68

ID: 3658
Customer: Oleg Ostapenko E-mail: ostapenko2002@yahoo.com
Customer: Oleg Ostapenko E-mail: ostapenko2002@yahoo.com
CHAPTER 5: AERONAUTICAL CHARTS AND CHART-MAKING
AERONAUTICAL CHARTS AND CHART MAKING.
INTRODUCTION.
In order to navigate an aircraft, a pilot needs to be able to determine the position of the starting point and destination of any planned flight, and to calculate bearings which tell him the direction in which to fly between departure and destination airfields.
The pilot also needs to be able to measure the distance between departure and destination, so that he can work out times to checkpoints, turning points and destination based on known airspeeds and wind speeds, and calculated groundspeeds.
Determining direction and fixing position require a chart which displays known locations and enables bearings to be measured.
In Chapter 3, we have already taken a brief look at how, in principle, a pilot uses an aeronautical chart in order to determine the heading to fly in order to make good a required direction or track. You will learn the actual method of measuring track in Chapter 7, but, in this chapter, we will first take a general look at charts and chart making.
Figure 5.1 Using an aeronautical chart to plan a navigational flight.
MAPS AND CHARTS.
You will notice that in aviation we refer to the term charts, not maps.
Although there is no formal definition of the difference between a map and a chart, it is generally accepted that the difference is essentially one of detail.
When driving, we use road maps because we require details which enable us to identify, for example, road numbers and distances between villages, towns and cities which are joined by roads. However, a pilot flying over the sea, requires a chart which contains none of the detail found on a road map, but which allows tracks to be plotted with great accuracy, and which includes only details of such things as coastlines airways and radio navigation features. On a small-scale Atlantic Chart, only the general shape of large land masses make the chart recognisable as a type of map. (See Figure 5.2, overleaf.)
69

Order: 6026
Customer: Oleg Ostapenko E-mail: ostapenko2002@yahoo.com
Customer: Oleg Ostapenko E-mail: ostapenko2002@yahoo.com
CHAPTER 5: AERONAUTICAL CHARTS AND CHART-MAKING
Aeronautical charts need to
contain ground features
that pilots may use as checkpoints or fixes.
A large-scale road map with detailed Figure 5.2 |
A small-scale aeronautical chart |
ground features. |
of the North Atlantic. |
Aeronautical Charts for Visual Navigation.
The chart that many VFR pilots use for visual navigation is the ICAO 1:500 000 scale chart, which is quite detailed, but does not contain the same detail of ground features as a road map. When navigating, a light aircraft pilot does not need to know the name of every small town or the numbers of the roads, only their relative locations. He does, however, need to know other details concerning regulated airspace and radio-navigation aids.
Figure 5.3 An ICAO 1:500 000 aeronautical chart showing Broadway, a small town situated between a disused railway track and an escarpment, with a road running through the town in a NW-SE direction.
On a visual navigation trip, for instance, a pilot might wish to use a small town as a checkpoint, or in order to fix his position, and to recognise that a main road runs through it in, say, a NW to SE direction. (See Figure 5.3.) But, the detail on an aeronautical chart need only be enough to indicate the presence of a small town situated, say, at the foot of an escarpment, a major road running in a particular direction and, perhaps, a disused railway track running parallel to the escarpment.
70

ID: 3658
Customer: Oleg Ostapenko E-mail: ostapenko2002@yahoo.com
Customer: Oleg Ostapenko E-mail: ostapenko2002@yahoo.com
CHAPTER 5: AERONAUTICAL CHARTS AND CHART-MAKING
We will return to visual navigation charts later, and to the features they need to show, but let us first take a look at the problems which chart makers faced in attempting to project the spherical surface of the globe of the Earth onto the flat surface of paper or parchment.
THE PROBLEM OF CHART MAKING.
It is not too difficult to appreciate that the spherical surface of the Earth can never be represented on a two-dimensional chart without the Earth’s surface undergoing deformation in one way or another. The challenge to the chart-maker, then, was to project the Earth’s surface onto a flat chart in such a way that, despite the inevitable deformations, the projection conserved as many of the characteristics of the Earth’s surface as possible that were useful to the navigator.
The type of desirable properties needing to be conserved were:
•Conservation of surface area.
•Conservation of angles (bearings).
•Conservation of distance.
The spherical
surface of the Earth
cannot be
represented on a flat chart without some degree
of deformation in area, scale, shape or angles.
The problem faced by chart makers, then, is not simple, as can be seen from Figure 5.4 which depicts a method of chart-making called the cylindrical projection.
The Cylindrical Projection.
The most famous cylindrical projections were made by Gerardus Mercator onto a cylinder of paper wrapped around a reduced Earth, and touching at the Equator. In a cylindrical projection of this kind, meridians of longitude and parallels of latitude are straight and perpendicular to each other, but there is much east-west and northsouth stretching, and significant distortion of scale with increasing distance from the Equator; for example, Iceland appears as large as India. However, rhumb lines, lines making constant angles with meridians of longitude, are represented by straight lines on a Mercator Projection, which made the Mercator Chart very suitable for navigation by ocean-going ships. Despite the significant distortion in land mass proportions near the poles, bearings measured from Mercator Charts are accurate. This latter property, which preserves accuracy of angles, makes the chart “conformal” in chartmakers’ speech.
Straight lines
drawn on a cylindrical
transverse
projection, such as a mercator projection, are rhumb lines.
Figure 5.4 The Mercator Cylindrical Projection.
71
Order: 6026
Customer: Oleg Ostapenko E-mail: ostapenko2002@yahoo.com
Customer: Oleg Ostapenko E-mail: ostapenko2002@yahoo.com
CHAPTER 5: AERONAUTICAL CHARTS AND CHART-MAKING
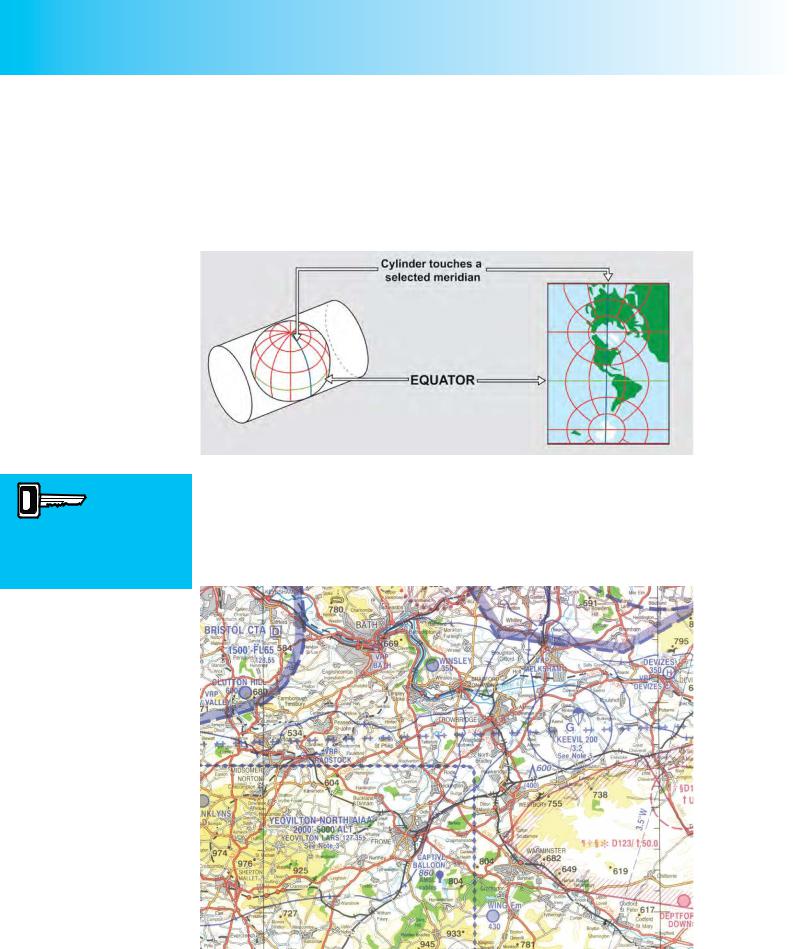
The Transverse Mercator Projection is an adaptation of the original Mercator projection. Both projections are cylindrical and conformal. However, in a Transverse Mercator Projection, the cylinder is rotated 90° (transverse) relative to the Equator so that the projected surface is aligned with a meridian of longitude rather than with the Equator, as depicted in Figure 5.5. In both the original and the Transverse Mercator Projection, there is little distortion of scale in the region on the chart where the projected surface touches the meridian.
The UK 1:250 000
aeronautical chart is
a Transverse Cylindrical Projection based on the 2° West Meridian of Longitude.
Figure 5.5 A Transverse Mercator Projection.
The UK CAA1:250 000 Chart series (See Figure 5.6), is constructed from a Transverse Mercator Cylindrical Projection, based on the 2° West meridian of longitude. Angles and bearings taken from the 1:250 000 chart are accurate. Shape and scale over the small area represented by each of the 8 charts covering the UK are conserved to a high practical accuracy, and a straight line marking the track between any two places represents a rhumb line.
Figure 5.6 A section from one of the eight 1:250 000 aeronautical charts covering the United Kingdom.
72

ID: 3658
Customer: Oleg Ostapenko E-mail: ostapenko2002@yahoo.com
Customer: Oleg Ostapenko E-mail: ostapenko2002@yahoo.com
CHAPTER 5: AERONAUTICAL CHARTS AND CHART-MAKING
The Conical Projection.
Conical projections involve placing a cone of paper over the reduced Earth, and projecting latitude and longitude graticules onto the cone, by placing a light source in the centre of the reduced Earth. Subsequently, the cone is slit along one side and opened to produce a flat sheet of paper.
Figure 5.7 Conical Projection.
Conical (or conic) projections are usually made with the axis of the cone parallel to the axis of the Earth. Using this procedure, the projection on the cone is perfectly tangential (where the paper touches the earth) along one or two parallels of latitude, true scale being obtained along those parallels.
In a conical projection, meridians of longitude appear as radiating straight lines and parallels of latitude as concentric angles. Deformation is uniform along any parallel of latitude, and levels of distortion are low in the mid latitudes. Figure 5.8 depicts a simple conical projection, with the parallel of tangency (parallel of origin) being 45° North.
In conical projections, angles and bearings
are conserved.
Figure 5.8 A Simple Conical Projection onto a flat surface.
73

Order: 6026
Customer: Oleg Ostapenko E-mail: ostapenko2002@yahoo.com
Customer: Oleg Ostapenko E-mail: ostapenko2002@yahoo.com
CHAPTER 5: AERONAUTICAL CHARTS AND CHART-MAKING
One of the most common conical projections is the Lambert’s Conformal Conical Projection in which angles and bearings, measured from the chart, are conformal with angles on the surface of the Earth, together with distances, over an area of about 160 nautical miles in an East-West direction and about 270 nautical miles North to South. For this reason, the Lambert’s Conformal Conical Projection is used in aeronautical charts, which cover large areas of the Earth’s surface, such as the 1:1
000 000 scale world series.
The ICAO 1:500 000 Chart series (See Figure 5.9), perhaps the most widely-used of all charts for visual navigation, is also constructed from a Lambert’s Conformal Conical Projection.
On a Lambert’s Conical Projection, great circles, which represent the shortest distance between two points on the Earth’s surface, appear as straight lines, at or near the parallel of origin. Moving away from the parallel of origin, great circles will appear slightly curved, concave to the parallel of origin. However, the curvature is not pronounced, and for practical purposes, on any Lambert’s Chart representing a small area of the Earth’s surface, such as Southern England, for instance, a straight line drawn on the chart represents a great circle.
The 1:500 000
chart of the UK is a
Lambert’s Conical Projection. Straight lines drawn on
this chart are great circles. Therefore, bearings must be taken at the mid-track position.
Figure 5.9 Section from an ICAO 1:500 000 chart of the United Kingdom - a Lambert’s Conformal Conical Projection.
Being a Lambert’s Conical Projection, the meridians of longitude on the UK
1:500 000 chart converge towards the North Pole. A straight line drawn on the 1:500 000 chart represents a great circle on the Earth’s surface, cutting the different meridians of longitude at a slightly different angle. This is hardly noticeable over the small areas covered by the 1:500 000 charts, but nevertheless, when measuring true headings, bearings should always be taken from the mid-track position.
74

ID: 3658
Customer: Oleg Ostapenko E-mail: ostapenko2002@yahoo.com
Customer: Oleg Ostapenko E-mail: ostapenko2002@yahoo.com
CHAPTER 5: AERONAUTICAL CHARTS AND CHART-MAKING
SCALE.
Distances read from a chart (along track lines, for instance) must be related to the real distances on the surface of the Earth by a fixed proportional factor. For example, on the ICAO 1:500 000 charts, one unit of distance on the chart, whether it be an inch, a centimetre or any other unit, represents a distance of 500 000 of those units on the Earth’s surface. On the UK CAA 1:250 000 charts, one unit measured on the chart represents 250 000 such units on the surface of the Earth. Thus, there is a known relationship between a distance measured on the chart and the real physical distance over the Earth.
This relationship is called scale.
As you will have deduced for yourself, the two terms 1:500 000 and 1:250 000 are both expressions of scale.
Scale may be expressed by the relationship:
distance on the chart Scale = distance on the Earth
It is absolutely crucial, when using scales to compute distances, either on the chart or over the Earth’s surface, that both terms of the above fraction be in the same units.
If, for example, you were to chose one inch to represent a given terrestrial distance on a 1:500 000 chart, that inch would represent 500 000 inches (ins) on the Earth’s
surface. |
|
|
|
500 000 ins = |
500 000 feet = 41 667 feet = |
41 667 |
nautical miles = 6.9 nm |
|
12 |
6076 |
|
If, on the other hand, you were to chose one centimetre to represent a given terrestrial distance, on a 1:250 000 chart, that centimetre would represent 250 000 centimetres (cm) on the Earth’s surface.
250 000 cm = |
250 000 |
kilometres = 2.5 kilometres = |
2.5 |
= 1.35 nm |
100 000 |
1.852 |
Distances, both on the chart and on the surface of the Earth, can be easily calculated, depending on the scale of the chart, by using a flight navigation computer. The CDROM which comes with this volume will teach you how to do this.
The scale of a chart is usually located in the legend box of the chart; that is, the box which explains the symbols and provides other important information about the chart. On the 1:500 000 chart of the United Kingdom, the scale appears in the legend box in the bottom left-hand corner of the chart.
A scale can be printed in a variety of ways. It can be expressed as a ratio, such as 1:500 000, a term with which you are now familiar, or it may even be shown as a length on a linear scale next to other lengths. Both of these methods of indicating scale are depicted on the UK 1:500 000 Chart.
75

Order: 6026
Customer: Oleg Ostapenko E-mail: ostapenko2002@yahoo.com
Customer: Oleg Ostapenko E-mail: ostapenko2002@yahoo.com
CHAPTER 5: AERONAUTICAL CHARTS AND CHART-MAKING
Figure 5.10 Two ways of indicating scale, shown on a 1:500 000 aeronautical chart.
Scale may also be written in words such as “One centimetre equals one kilometre” or “One inch equals one mile”.
Charts are often referred to as large scale or small scale. A large scale chart is one which shows greater detail because the fraction expressing the scale, for instance, 1/50 000, is a fraction of greater value than that expressing the scale of a small scale chart, for instance 1/500 000. You will remember from your mathematics lessons that the larger the number on the bottom line of a fraction, the smaller the value of the fraction. Maps of the world which fit onto two pages of an atlas are of very small scale, 1:100 000 000 being typical.
In your VFR cross-country flying, you will doubtless be using the 1:500 000 scale chart quite often; three of these charts cover the United Kingdom. You will find that the 1:500 000 chart (popularly known as the “half mil”) is divided into rectangles of half a degree (30’) of latitude and longitude. As one minute of latitude measured along a meridian of longitude is equal to one nautical mile, the marks along the lines of longitude, which indicate latitude, can be used for measuring distance, by employing a pair of dividers.
Figure 5.11 Graduations along a meridian of longitude: – one minute of latitude equals one nautical mile; 30’ equals 30 nm.
76