

ppl_03_e2
.pdfID: 3658
Customer: Oleg Ostapenko E-mail: ostapenko2002@yahoo.com
Customer: Oleg Ostapenko E-mail: ostapenko2002@yahoo.com
CHAPTER 6: FEATURES ON AERONAUTICAL CHARTS
Finally, you will notice that the chart indicates that the VHF frequency of 124.275, Brize Radar’s frequency, providing a Lower Airspace Radar Service (LARS), also gives the pilot access to a VHF Direction Finding (VDF) service.
As mentioned, the majority of these radio-navigation aids are covered in thesecondpartofthisbook. However, for the PPL theoretical knowledge examinations and skills test, a pilot needs only a basic knowledge of, and competence in, the use of radionavigation aids. Those pilots who wish to make a deeper study of radio-navigation, perhaps in order to prepare for an IMC Rating, may wish to consult OAAmedia’s interactive
CD-ROM entitled ‘The IMC Rating &
Instrument Flying’.
The other items in the list on Page 85 are dealt with in the Air Law & Operational Procedures volume in this series of manuals.
Figure 6.4 OAAmedia’s interactive CD-Rom on ‘The IMC Rating & Instrument Flying’.
It is only through study of the aeronautical chart itself, and of its legend, that you will learn to recognise instantly the features on your chart which are essential to safe visual navigation.
Always Carry an Up-to-Date Chart.
The aeronautical chart should be a pilot’s constant companion; not that he needs continuously to read the chart in flight, but it should always be within reach, and the pilot needs to be fully familiar with the information it contains, be able to read it fluently, whenever necessary, and to use it in accordance with sound navigational techniques. Remember, however, that features may not stand out so prominently on the ground during an actual flight as they appear on the chart, especially if visibility is poor or the ground is in cloud shadow.
Both the 1:500 000 and the 1:250 000 scale charts are updated regularly, the current version of the chart being detailed in Aeronautical Information Circulars.
Some changes of importance (e.g. airspace changes) take place between chart issues. Details of such changes are contained in NOTAMs and in the Aeronautical Information Publication (AIP). In this case, it is prudent to make a hand-drawn amendment of your chart until the next issue becomes available.
Chart updates are published on the United Kingdom CAA website, currently at www.caa.co.uk, under “airspace policy” and “aeronautical charts”.
Be aware that the law requires you always to carry with you up-to-date versions of all the charts required to carry out any flight, including charts containing details of diversions.
It is only
through study of the
aeronautical
chart itself, and of its legend, that you will learn to recognise instantly the features on your chart which are essential
to safe visual navigation.
87

Order: 6026
Customer: Oleg Ostapenko E-mail: ostapenko2002@yahoo.com
Customer: Oleg Ostapenko E-mail: ostapenko2002@yahoo.com
CHAPTER 6: FEATURES ON AERONAUTICAL CHARTS
Be aware
that the law requires you always
to carry with you up-to- date versions of all the charts that are required to carry out any flight,
including charts containing details of deviations.
Differences in Information Shown on the 1:500 000 and 1:250 000 Charts.
1:500 000 aeronautical charts depict topographical features above 500 feet above mean sea-level, and obstacles above 300 feet above ground level. Aeronautical information, such as details of controlled airspace, is contained in the 1:500 000 chart up to Flight Level 195.
The UK CAA 1:250 000 aeronautical chart depicts surface topographical detail similar to that contained in the 1:500 000 chart, though the 1:250 000 chart shows terrain contours above 200 feet above mean sea-level. However, controlled airspace is depicted only up to 5000 feet altitude or Flight Level 55 if vertical limits are given as flight levels.
The 1:250 000 chart should, therefore, be used only for that part of a cross-country flight which takes place below an altitude of 5000 feet. (Beware, too, that if the pressure at sea-level is below 1013.2 millibars, the pressure datum for flight levels, the base of controlled airspace not shown on the chart may be below 5000 feet). (See Chapter 10 on Altimetry.)
Both the 1:500 000 and the 1:250 000 charts also include local magnetic variation in the form of isogonals, and details of radio frequencies.
TERRAIN AND OBSTACLE ELEVATION ON THE 1:500 000 AERONAUTICAL CHART.
Terrain Elevation and Depiction of Terrain Relief.
The elevation of terrain and obstacles is, by definition, measured from mean sea level, whereas the height of an obstacle is measured from ground level.
Portrayal of Relief.
Figure 6.5 depicts a section of the 1:500 000 chart which features Snowdonia in Wales, together with a key to terrain elevation which is printed in the legend at the bottom left corner of the chart. Tinted colours and contours are used to show ground relief and elevation. Contours are shown for 500 foot intervals.
Figure 6.5 Depiction of terrain elevation.
88

ID: 3658
Customer: Oleg Ostapenko E-mail: ostapenko2002@yahoo.com
Customer: Oleg Ostapenko E-mail: ostapenko2002@yahoo.com
CHAPTER 6: FEATURES ON AERONAUTICAL CHARTS
The coloured tints make it easier to see changes in ground relief when map reading. Different shades of colour are used for the various bands of terrain elevation. Note that the chart legend depicts the value of the highest known elevation on the chart, in this case, the elevation of the summit of Mount Snowdon. On the chart itself, other significant elevations (the summits of other mountains) are shown as spot elevations.
As you have learnt, no contours or elevation tints are shown for terrain below 500 feet. Consequently, all the white areas on the chart depict terrain lower than 500 feet above mean sea level.
Note that the green areas on the chart indicate wooded areas, and built-up areas are coloured yellow. These two colours have nothing to do with elevation.
Maximum Elevation Figures (MEF).
The 1:500 000 chart is divided into quadrangles bounded by black graticule lines, every ½ degree of latitude and longitude. Maximum Elevation Figures (MEF) are shown, in blue, within each quadrangle, in thousands and hundreds of feet. Each MEF is based on the highest obstacle or terrain elevation within the quadrangle. If the object is a man-made obstruction, e.g. a television mast, its elevation will be precisely known so the elevation is simply rounded up to the next 100 feet to give the MEF. In Figure 6.6, the MEF is 13 because the highest point in that quadrangle is a mast whose elevation is 1 297 feet. If the highest point is a spot elevation, 300 feet is added to the elevation and then the figure is rounded up to the next 100 feet. 300 feet is added because an obstacle of up to 300 feet in height may be constructed on the summit of a hill or mountain without any requirement to notify the authorities.
Figure 6.6 Maximum Elevation Figures.
Thus, any given MEF is either the highest obstacle, rounded up to the next 100 feet, or the highest spot elevation plus 300 feet, rounded up to the next 100 feet. For instance, in Figure 6.5, as the summit of Mount Snowdon is 3 560 feet above sea level, 300 feet is added to that elevation and then rounded up to the next hundred feet to give 3 900 feet. Thus, the MEF for the quadrangle in which Mount Snowdon is located is shown as 39. Note that MEFs are not safety altitudes.
89
Order: 6026
Customer: Oleg Ostapenko E-mail: ostapenko2002@yahoo.com
Customer: Oleg Ostapenko E-mail: ostapenko2002@yahoo.com
CHAPTER 6: FEATURES ON AERONAUTICAL CHARTS
An MEF is NOT a Safety Altitude!
Air Navigation Obstacles.
An Air Navigation Obstacle is a radio or TV mast, a high chimney or any other high obstacle other than high ground. All such obstacles that are more than 300 feet above ground level are shown on the 1:500 000 chart. Each obstacle has two figures beside it. The figure in bold type shows the elevation of the top of the obstacle. The figure in brackets shows its height above ground level. The mast in Figure 6.6 rises to an elevation of 1 297 feet or to 751 feet above the ground.
The figure in bold type next
to an obstacle gives its
elevation above mean sea level. The figure in brackets gives its height above ground level.
REGULATED AIRSPACE.
Regulated airspace refers to all airspace in which the movement of aircraft is regulated in some way. Examples are airways, control zones, control areas, restricted areas, prohibited areas and danger areas. On the 1:500 000 chart, regulated airspace is shown only up to Flight Level 195.
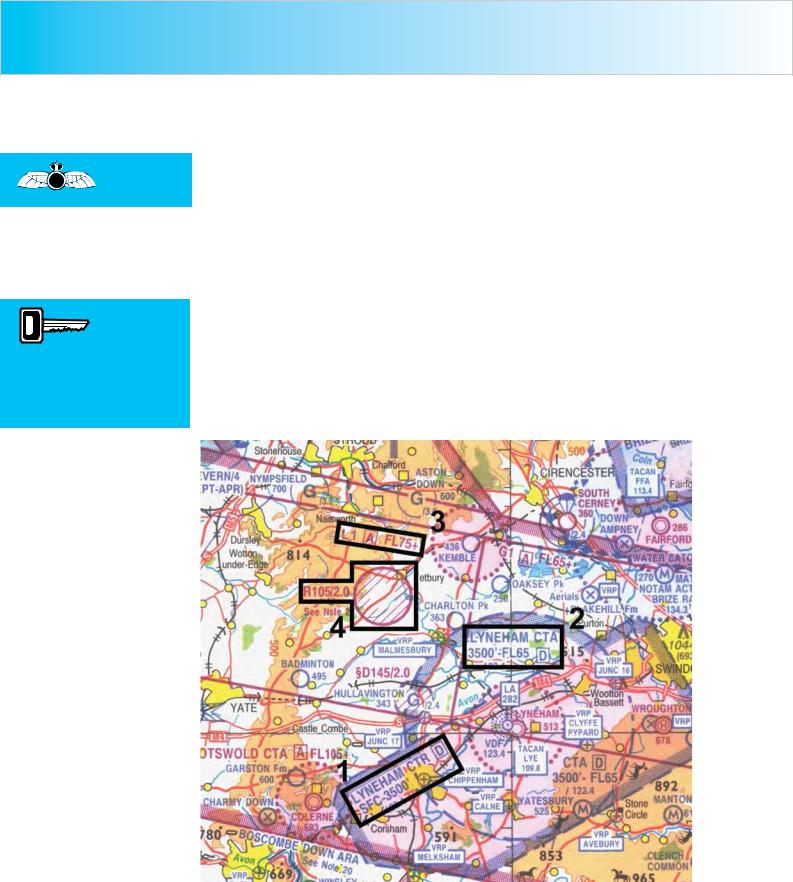
The vertical limits of all regulated airspace on the chart are shown either as altitudes or flight levels. For instance, the Control Area (CTA) surrounding Lyneham (See Figure 6.7) stretches vertically from an altitude of 3 500 feet to Flight Level 65, (i.e. 6 500 feet with respect to the pressure datum of 1013.2 millibars).
Figure 6.7 Four examples of Regulated Airspace on a 1:500 000 chart.
90

ID: 3658
Customer: Oleg Ostapenko E-mail: ostapenko2002@yahoo.com
Customer: Oleg Ostapenko E-mail: ostapenko2002@yahoo.com
CHAPTER 6: FEATURES ON AERONAUTICAL CHARTS
Figure 6.7 highlights the following regulated airspace.
1.The Lyneham Control Zone (CTR) which has vertical limits from the surface to an altitude of 3 500 feet.
2.Lyneham CTA stretching from 3 500 feet to Flight Level 65 (FL65).
3.Airway Lima 1 which has a base of FL75 and which extends upwards to the ceiling of lower airspace at Flight Level 195. You will note that this vertical extent is marked as FL75+. The (+) sign means “up to FL195”. The letter A denotes that the airway is Class A airspace.
4.Restricted Area R105 which has an upper limit of 2 000 feet. This restricted area is shown as R105/2.0. R105 identifies the restricted area itself, and 2.0 indicates “from the surface to 2 000 feet altitude”.
Certain Restricted, Prohibited, Danger and High Intensity Radio Transmission Areas may have the phrase “See Note ..” alongside; this refers to the notes in the Reference to Air Information section of the legend at the lower left corner of the Chart,, which gives additional information on certain areas of regulated airspace.
91

Order: 6026
Customer: Oleg Ostapenko E-mail: ostapenko2002@yahoo.com
Customer: Oleg Ostapenko E-mail: ostapenko2002@yahoo.com
CHAPTER 6: FEATURES ON AERONAUTICAL CHARTS QUESTIONS
Representative PPL - type questions to test your theoretical knowledge of the Features on Aeronautical Charts.
1.On the UK 1:500 000 aeronautical chart what does the symbol refer to?
a.The direction of approach to the primary runway of a civil aerodrome
b.The climb-out lane for IFR traffic departing the primary runway of a civil aerodrome
c.The localiser of an Instrument Landing System
d.A civil aerodrome, outside regulated airspace, which has one or more instrument approach procedures
2 . |
On the 1:500 000 aeronautical chart, in each quadrangle bounded by lines |
|
of latitude and longitude, at half degree intervals, there is a two-digit figure, |
|
the first digit being twice as large as the first. What does this two-digit figure |
|
denote? |
a.The minimum separation distance to be maintained from the highest obstacle in the quadrangle concerned, the first digit indicating thousands of feet and the second digit indicating hundreds of feet
b.The safety altitude for the quadrangle concerned, the first digit indicating thousands of feet and the second digit indicating hundreds of feet
c.The Maximum Elevation Figure for the quadrangle; but this is not a safety altitude; the first digit indicates thousands of feet and the second digit indicates hundreds of feet
d.The safety height for the quadrangle concerned, the first digit indicating thousands of feet and the second digit indicating hundreds of feet
3.If the highest obstacle in a quadrangle on the ½ million chart is a TV mast of elevation 1 130 feet what would you expect the MEF to be?
a.12
b.13
c.14
d.15
4 . |
A vertical obstruction symbol on a 1:500 000 aeronautical chart of the United |
||||||
|
Kingdom has the following figures printed next to it: 656 (263). What is the |
||||||
|
meaning of these figures? |
||||||
|
a. |
|
The obstacle rises to 263 feet above mean sea level, and should be |
||||
|
|
|
overflown at a minimum altitude of 650 feet |
||||
|
b. |
|
The obstacle rises to 656 feet above mean sea level and 263 feet |
||||
|
|
|
above ground level |
||||
|
c. |
|
The obstacle rises to 656 metres above mean sea level and 263 |
||||
|
|
|
metres above ground level |
||||
|
d. |
|
The obstacle rises to 263 metres above mean sea level and should |
||||
|
|
|
be cleared by a minimum separation distance of 656 |
||||
|
|
|
|
|
|
|
|
Question |
1 |
|
2 |
3 |
4 |
|
|
Answer |
|
|
|
|
|
|
|
The answers to these questions can be found at the end of this book.
92

Customer: Oleg Ostapenko E-mail: ostapenko2002@yahoo.com
CHAPTER 7
MEASURING TRACK ANGLE AND
TRACK DISTANCE
93

Order: 6026
Customer: Oleg Ostapenko E-mail: ostapenko2002@yahoo.com
Customer: Oleg Ostapenko E-mail: ostapenko2002@yahoo.com
CHAPTER 7: MEASURING TRACK ANGLE AND TRACK DISTANCE
94
ID: 3658
Customer: Oleg Ostapenko E-mail: ostapenko2002@yahoo.com
Customer: Oleg Ostapenko E-mail: ostapenko2002@yahoo.com
CHAPTER 7: MEASURING TRACK ANGLE AND TRACK DISTANCE
INTRODUCTION.
Having learnt something about aeronautical charts, direction, speed, distance and time, you are now ready to learn how to use this knowledge in order to develop the techniques and skills required to prepare a cross-country flight and to carry out effective visual navigation, in the air.
In this chapter, you will learn how to:
•measure the true bearing or true track angle of a desired track drawn on an aeronautical chart, between start point and destination.
•measure distance along track.
•plot your aircraft’s position along track.
•identify the position of a location, using latitude and longitude.
In order to get the most out of this chapter, you will need a copy of a 1:500 000 scale aeronautical chart of Southern England, a navigation protractor and a navigation rule.
Measuring Track Angle.
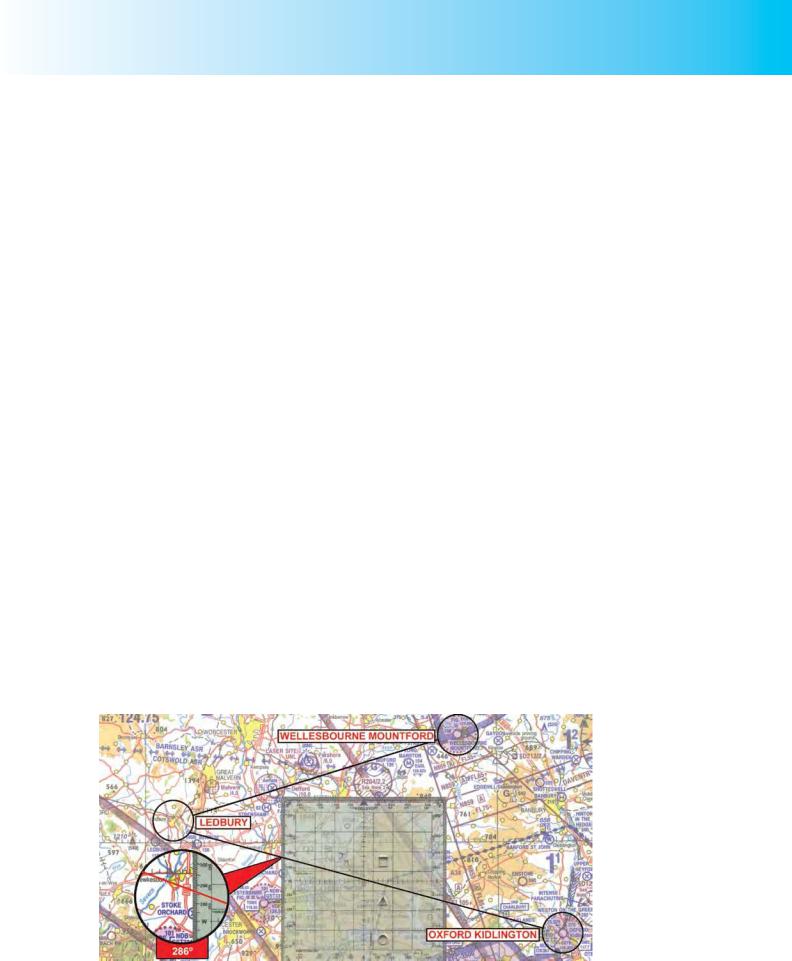
The first thing to do if you are planning to fly directly from one location to another on the Earth’s surface is to draw a line, or lines, on the chart to mark the track along which you wish to fly. The line drawn on the chart joining your point of departure to your destination or turning point is called the required track or true track. When there is more than one required track, each track is called a leg. Having drawn the track, or tracks, on your chart, begin by measuring the true bearing or true angle of each track; that is, the angle of the track with respect to True (geographical) North.
We will assume that you wish to fly a cross-country flight from Oxford Aerodrome to
Wellesbourne Mountford Aerodrome via Ledbury.
In order to measure the true angles of the required tracks, use a navigation protractor of the type illustrated in Figures 7.1a and 7.1b.
Figure 7.1a Measuring the True Track Angle from Oxford Kidlington to Ledbury: 286° (True).
95
Order: 6026
Customer: Oleg Ostapenko E-mail: ostapenko2002@yahoo.com
Customer: Oleg Ostapenko E-mail: ostapenko2002@yahoo.com
CHAPTER 7: MEASURING TRACK ANGLE AND TRACK DISTANCE
Measure
the True Track Angle
of your track lines from the mid-track position.
The protractor has a graticule on it which allows you to align it accurately with the North-South lines (that is, the meridians of longitude) on the chart.
On the 1:500 000 chart illustrated, straight lines represent great circles. Place the centre of the protractor over the approximate mid-point of the track from Oxford to Ledbury and align its North-South line with the mid-track line of longitude, making sure the north-pointer on the protractor is pointing North. Then, read off the true track angle from the markings at the edge of the protractor. You see that the track angle is 286° (True). (See Figure 7.1a.)
If there were no wind, if magnetic variation were zero, and if there were no compass deviation errors, the track angle of 286°(True) would be the heading you would fly to get from Oxford Kidlington to Ledbury. However, all those factors have to be taken into account, as you will learn in later chapters. For the moment, though, you must just measure your true track angle.
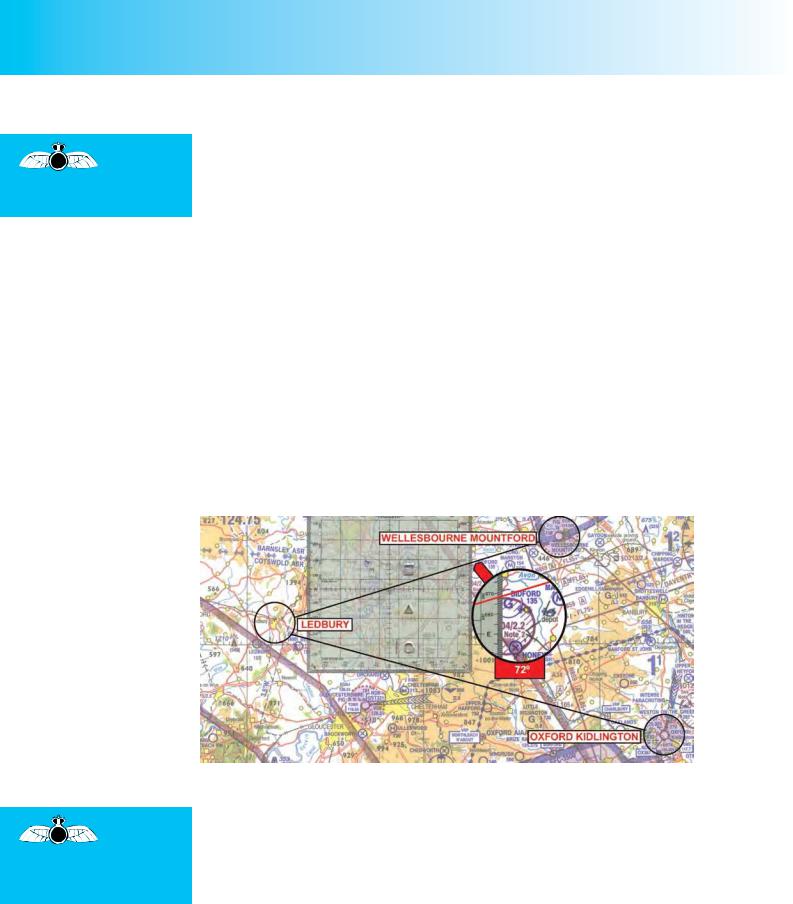
Follow the same procedure for the track from Ledbury to Wellesbourne Mountford.
You may find that, when you place the protractor over the mid-point of the track, the edges of the protractor extend beyond the ends of the track, making it difficult to read the track angle correctly. In this case, move the protractor to the left along the track, keeping the protractor’s north-south lines aligned with the meridians of longitude on the chart, until the track appears from under the edge of the protractor as shown in
Figure 7.1b. The track angle for this leg of the flight is 072° (True).
Always make
a gross error check
of the Track Angles that you measure. It is easy to
misalign a square protractor.
Figure 7.1b Measuring the True Track Angle from Ledbury to
Wellesbourne Mountford: 072°(True).
Always ensure that you make a gross error check on the bearing you have measured for your track. It is easy to misalign a square protractor, for example, to lay it on the chart with its North direction pointing East, West or South. A mistake of this nature, could put your track out by 90°, 180° or 270°.
Measuring Distance Along Track.
Measuring the distance between any two points along track is straightforward. Navigation rules are graduated in statute miles, nautical miles and kilometres, usually with scales for both 1:500,000 and 1:250,000 scales.
96