

ЭкспериментИскусство_2011
.pdfin dreams. I added instructions for the mirror’s use, suggesting to dream “your true image”. In 1979 I exhibited the Tachystoscopic Mirror with Dream Stimulants (see Fig. 7) as a self-service artwork in some art galleries (Lombardo 1979, 1981, 1991; Calvesi et al., 1995).
In this work all the basic concepts of eventualism are involved in a strong way. Even the concept of deepness has been used in the instructions: The mirror with the instructions and the subliminal image is the stimulus, the dream is the event, the telling of the dream is the documentation.
The investigations on formal methods generating random pictures led me to create the Stochastic Paintings, exhibited from 1980 (Lombardo 1983, 1986, 1991, 1993, 1997; Calvesi et al. 1995, 1996). The methods generating stochastic paintings can vary in many parameters: color proportions, proportions of black and white, straight and curved edges, order and disorder, continuity and discontinuity. I tried to discover the most important parameters and the best proportions to elicit the maximum number of different interpretations among viewers. A stochastic method named RAN was created to construct square tiles in black and white whose combinations grow with increase in the area of the tiling (Lombardo 1993, 1997). A white and black tiling exhibited in an art gallery is shown in Figure 8. Stochastic automatic methods named TAN, SAT, LAB were created to construct images never seen before, very far from ordinary human visual experience. All these automatic methods work in a space embedded in the torus, hence with all these images it is possible to make tilings.
In 1995 my interests shifted from stochastic methods toward map coloring theories. Stochastic paintings were preferred when there was a simulation of perspective. The presence of vertexes with 3 adjacent edges (degree 3) was the cause of the perspective effect. To increase the perspective effect, I constructed stochastic maps with all the vertexes of degree 3. After a while I realized that a map with all vertexes of degree 3, whose regions can not be colored with less than n colors and whose regions are not more than n, is a minimal map.
The number n can be at the most 4 if the map is planar, at the most 7 if the map is toroidal, at the most 6m (m is the number of non connected regions of the same color in a Heawood map) if the map is a Heawood map, at the most 6m+1 if the map is a Heawood toroidal map.
244
I constructed 5-chromatic, 6-chromatic and 7-chromatic toroidal maps, trying to find the best coloring. A tiling of 4 tiles made of a 7-chromatic minimal toroidal map is shown in Figure 9. This tiling was first exhibited in the Comunal Gallery of Modern and Contemporary Art in Rome (Bonasegale, 1998). Now I am interested to the systematic investigation of aesthetic relations between the best colorations and minimal forms. Previous investigations on the aesthetics of map coloring (Lombardo 1999) had proved the following:
1)Minimal maps are preferred to non minimal ones.
2)The minimum number of different hues is preferred to many different hues.
3)Aset of colors obtained adding steps of luminosity to a single hue is preferred to sets of colors with different hues.
4)A set of colors with the lightest color nearly as clear as the white and the darkest color nearly as dark as the black is preferred to sets of colors without both very clear and very dark colors.
5)A scale of colors adding to the most dark hue equal steps of progressive luminosity is preferred to scales of colors with arbitrary differences of luminosity.
6)Only if more than 7 colors are needed, is it preferable to use more than one hue.
7)When the form of the map is stochastic, the permutation of colors is not aesthetically relevant.
In order to investigate whether the permutation of colors in a non-stochastic map is aesthetically relevant, an experiment was planned. A 12-chromatic cylindric Heawood map with all regions in the form of strips of the same width was drawn. The map had 12 nations, each nation had two non-connected regions, both regions of the same nation were to be painted with the same color. Each nation had one edge in common with all the other 11 nations, thus the map could not be colored with less than 12 colors. The 12 colors were chosen as the following: 6 colors adding equal (i.e. perceptually equal) steps of light to a very dark violet and 6 colors adding equal steps of light to a very dark magenta. The darkest colors were nearly as dark as the black, the lightest colors were nearly as light as the white.
The location of the 12 colors was chosen randomly. 3 canvases of the same size (100 x 120 cm) and formal structure, but in different permutations of colors were painted. The three stimuli were exhibited at The Equilibri Precari Art Gallery in Rome and in a different disposition at The Auditorium of Santa Cecilia in Rome.
245
A sample of 80 persons (chosen among the visitors) was asked to rank the three paintings according to two parameters: supposed objective beauty and personal preference. No relevant preference was found (see Fig.10).
Robotic art
Can artistic creation be automatized? RoboticArt is based on the idea that the artist in the future will abandon the method of arbitrary inspiration and embrace the method of the scientist. The scientist describes a procedure (program) and anyone who will use such a procedure will make (execute, not create) a work of art, whose author is the scientist. If anyone is able to better the program, he will be the author of a new series of art works. Such attempt was imagined by early ‘900 avant-gardes (like Futurism, Surrealism, Suprematisme, Agit Prop), but never strictly actuated. In the Sixties, international avant-garde, of which I have been a member, and especially American artists tried to bring on the idea. From Allan Kaprow to Sol LeWitt, from Monochrome Malerei to Conceptual Art, the attempt was very serious. Roy Lichtenstein defines as “industrial Art” the same Pop Art. The creation of a tecnical procedure is the patent to make industrial art. Tecnical procedures are devices to create eventualist stimuli as artworks.
There are many difficulties, though. One is the slowness and the expensiveness of the scientific research against the easiness of arbitrary creativity. Moreover, the results must be more creative, more interesting and deeper than any arbitrary creativity. The procedure must generate figures that human brain cannot imagine and that humanity has never seen before. Here some automatic procedures I employed in my artistic work are described. Artworks produced in such a way are known as “Stochastic Paintings” or “Stochastic Tailings”. Some minimal and Heawood maps are described as well.
The aim of Robotic Art according to the Eventualist theory is not to find a method, or to construct a machine, able to do what painters already do, or could do, using traditional methods. The creation of a software that will enable a computer to do what used to be done with a paintbrush is not Robotic Art. Neither is Robotic Art the construction of an automatic robot instead of a static sculpture, if the robot-sculpture is previously imagined and designed by an artist and only executed by a robotic procedure. The invention
246
of a robotic procedure must create, or design, images, sculptures, architectures, psychologic stimuli, that would be impossible to create, or design, only using arbitrary or magic intuition. Robotic Art must be more interesting, surprising, original and deeper then any art created, or designed, by human artists. These artworks must excite the publics’ imagination, so that each spectator will project his own deepest and personal issues. Such projections, or issues, must be different for each spectator and different for the same spectator in different times. Automatic methods must improve the artists’ creative genius, not his manual ability. An automatic method, as opposed to arbitrary creation, may be repeatedly applied and sistematically improved.
Stochastic procedures
Five automatic procedures I have used in artistic production will be discussed. The first, discovered by F. Attneave and M. D. Arnoult in 1956, with the intent of creating “Nonsense Shapes”. The second, a modified extension of the first, was used starting from 1980 in some works that are the basis of my “Stochastic Paintings” (Lombardo, 1983; 1986, 1994) and, in particular, in “Stochastic Tilings” (Lombardo, 1994a). This procedure is called “RAN” method or “Dot Rain”. The third procedure, called “LAB” method, creates labyrinth-like shapes. The fourth and fifth, known as TAN and SAT methods, have been better described elsewhere (Lombardo 1986). Maps and Heawood maps are not precisely automatic procedures but solutions of complex formal problems.
I will then describe in detail two closing methods of one of the SAT method (Lombardo 1986).This method I used since 1984, creates very complex shapes that are able to stimulate projective interpretations among the public. No intuitive painter could create such surprising and attractive shapes, nonetheless, I think it may be improved. For this reason I will compare to different closing techniques.
“Nonsense shapes” by Аttneave-Аrnoult
In 1956, Attneave and Arnoult invented a famous method for constructing “Nonsense Shapes” in order to find an intelligent way to choose the stimuli for experiments investigating perception and memorization of unfamiliar shapes. I described in detail the procedure (Lombardo 1991).
247
Dots rain, or ran method
This method is an extension of the previous, but it is applied to a bi-dimensional torus (T2). The torus is flattened out in order to become a rectangular sheet. This way we can trace a virtually endless line remaining in the same rectangle. In fact, when the line meets the border of the rectangle, it will continue in the same direction from the opposite border. Juxtaposing copies of the toroidal rectangle as if they were tiles the picture continues undisturbed beyond the borders of the tiles.
A Dot Rain: P(1...n) creates a random n side polygon inscribed in a torus. The first step is to create a stochastic triangle by extracting 3 random points and tracing the smallest possible triangle connecting the three points.
Now we can apply the “Dot Rain” procedure to transform the triangle in a polygon.
Each time a new point will be extracted, 2 new sides will replace an older side of the polygon. To choose which side must be replaced one can follow different procedures:
1.The side is randomly chosen among those where a straight line could connect the vertexes without crossing other lines (visible).
2.Choose the closest among the “visible” ones.
4. Choose the farthest among the “visible” ones.
Stochastic tiles
Using RAN methods between 1990 and 1996, I designed many series of floors made of stochastic square tiles. Each tile had 4 dispositions: Nord, Sud, East, West. Each disposition of any tile of the floor changed, without interrupting, the general drаwing of the floor. A floor made of 16 equal tiles, for exаmple, could be fixed in 416 different ways, so that 4.294.067.296 different drаwings of the floor were possible. I designed many series of 72 different tiles (Lombardo 1994, Briguglio, Moschini 1997).
See fig. 8, fig. 11, fig. 12.
Tan method
To draw white and black nonsense patterns in which any people can see different meanings I created a procedure named TAN method. In a black cartesian rectangle 2 points are randomly selected
248

Fig. 11
Fig. 12
and a straight line crossing the 2 points is drawn. The procedure can be repeated n times, according to a program previously defined. To create curves the first point is the center and the second point is the circunference of a circle. The black rectangle is then cut along the lines and N black clippings are created. After giving progressive numbers to the clippings according to their area, and a specific
249
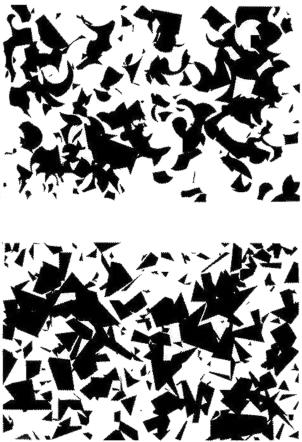
Fig. 13
Fig. 14
orientation , they are placed on a white cartesian rectangle by random procedures. The result can be a structure in which different people can recognice different meanings. See fig 13,14.
Lab method
Between 1980 and the middle of the nineties, during long phase called “Stochastic Painting”, I invented some automatic procedures for creating nonsense shapes. These shapes were constructed to induce endless interpretation in the public. These automatic proce-
250
dures are based on randomly picked of points, and on rules for the connection of these points, in order to construct planar or toroidal colored maps.
The following explanation is very semplified.
The LAB method consists in randomly extracting a point and connecting it to a previously extracted (older) one in order to create a tree. Each extracted point is numbered progressively. The connections between points, called sides, are straight-line segments. The sides must not cross over, nor come close, to previously drawn (older) sides or vertexes. The newly extracted vertex must be connected to an older vertex following this preference order:
–connect to the closest visible vertex already connected by 1 side (g°=1);
–if that is impossible, connect to the closest visible vertex already connected by 2 sides (g°=2);
–if this is also impossible, delete and extract the last vertex
again.
The tree must then be transformed into a map by connecting the vertexes of the hanging sides, called leafs (vertexes g°=1), by using the same rules that have been used for the creation of the tree, preferring the 2 sided vertexes, then the 1 sided ones, the 4 or more sided ones, and finally the 3 sided ones because, in this case, it is not possible to extract the hanging side again.
The map is then colored using the following algorithm:
–arrange the countries in order of complexity (the most complex country is the one that has a common border with the most countries that have common borders with at least 4 countries);
–color a country at a time from the most complex to the less complex;
–attribute color A, if there are countries of color A that share a border attribute color B, if there are countries of color B that share a border attribute color C, and so on;
–continue until the map is completely colored.
Minimal and Heawood maps
Minimal maps follow exact topological rules. These graphs are made of colored flat surfaces called regions or countries. The color used for each country may be the same as that used to color other countries, as long as the same color is not used for countries that share the same borders. If the maps are constructed on a plane they
251
are called planar, while if they are constructed on a torus they are called toroidal.
These maps are called minimal when they cannot be constructed or colored differently without them becoming more complicated, and there isn’t a way to simplify them. In this case, three borders must begin from each vertex.
The economy of these maps is given by the fact that they reach maximum complexity with less possible components, this is why they are almost always more beautiful then those that are not minimal. But, not all minimal maps are equally beautiful once colored. In fact, minimal maps may be constructed and colored in endless ways. We can ask ourselves, from an aesthetic point of view, which is the best way, if such a way exists, to design and color minimal maps.
Minimal maps may be sorted from different points of view: best coloring, structural simplicity, maintaining the same topological properties. The problem of the coloring is formulated in the following way: which is the best (aesthetically) possible way of coloring a certain map? The problem of the map structure is formulated in the following way: which is the simplest way to design a map with certain topological properties? These problems may not be treated separately because some maps that are considered aesthetically the best if colored following certain rules, if designed the simplest way may require different coloring rules.
Maps where all countries are independent can be colored with a minimum number of colors; this number is called the “chromatic number” of the map. All planar maps can be colored using 4 colors or less. All toroidal maps can be colored using 7 colors or less. Heawood maps are instead more complex, because their countries are not independent, each country is made by an m number of disconnected regions, to be colored using the same color in order to show that they belong to the same country. All Heawood maps where m=2 can be colored using 12 colors or less, the ones where m=3 can be colored using 24 colors or less. Planar Heawood maps may be colored using a maximum of 6m colors; if these maps are constructed on a torus their chromatic number is 6m+1.
Sat method and two different closure procedures
It involves drawing by lot the points of a Cartesian plane inscribed in a bi-dimensional torus and connecting them using straight line segments, in order to create a map. The map will be colored
252
by means of another algorithm. The N number of extracted points, called vertexes, represents the complexity of the drawing.
The procedure is divided in 3 different phases:
–creation of one or more N complexity SAT stochastic trees over a bi-dimensional torus (if the trees are more then one the graph is said to be a forest);
–the closure of the tree or forest in order to transform the graph into a map;
–coloring the countries of the map.
Here I will describe in detail the automatic procedure that creates a forest of 10 SAT trees of complexity N = 150. In the second phase I will apply two different closures, one called close and the other called far, obtaining two maps that I will then color using the same coloring procedure and the same colors.
This way, two stimuli will be created and evaluated, using aesthetic and Eventualist evaluation methods, in order to determine which one of the two methods is better.
The plane of the picture is x = 0…60, y = 0…40. Obviously, being a bi-dimensional torus 40 = 60 = 0.
–Extract the coordinates (x, y) of 10 different points in the torus area. Name these points using progressive numbers according to the order of extraction. These 10 points are 0 degrees vertexes and are called roots. In fact, each one of them may generate a stochastic tree when the other vertexes will be extracted. The degree of the vertex may grow when the connected sides are drawn.
–Extract another 140 vertexes, the overlapping ones, the ones that are too close to each other (distance<1) or to a side must be deleted and extracted again. Give each vertex a progressive number from 11 to 150.
Before extracting another vertex, starting from vertex 11, connect with a line, called side, the last accepted vertex and connect it with the closest vertex, among those visible in a straight line without crossing or coming close (distance<1) to vertexes or sides that have already been drawn (older). If there is more then one vertex at the same distance, the most recently extracted one (youngest) is preferred.
In order to transform this forest into a map, one must draw other sides from the vertexes that are connected to only one side, 1 degree vertexes, also called leafs. For this purpose, all the vertexes must be considered, in their order of extraction. If the vertex is a 0 degree one (a root from which no tree has grown) one must draw 2 sides
253