


CHAPTER NINE
Congenital Shunts and AV Valve Dysplasia
When considering intracardiac shunts, cardiac enlargement involves only those chambers that are included in the shunting blood’s route through the heart and lungs. There is a direct correlation between the clinical signs related to the cardiac shunt, the size of the defect, and the degree of volume overload in the involved chambers (1).
When one defect has been identified but there is enlargement of a chamber or vessel that is not normally part of the shunt pathway, another defect is probably present, or complications secondary to the shunt may exist. Each cardiac shunt will be considered in the following sections, and complications or possible concurrent problems will be covered.
Always measure pulmonary and aortic flow velocities in congenital heart disease. Increases in pulmonary flow suggest a VSD or ASD in the absence of PS. Increases in aortic flow suggest a PDA if AS is absent. These can help discover a defect not previously suspected.
Ventricular Septal Defect
Introduction
Ventricular septal defect (VSD) is a common congenital cardiac defect in cats and dogs (2–5). It is the most common congenital defect in the horse, llama, and cow (6–11). There are four types of ventricular septal defects: perimembranous, supracristal, muscular, and inlet. Perimembranous VSDs are located in the left ventricular outflow tract just proximal to the aortic valve, and blood flows into the right ventricular chamber under the tricuspid valve. The most common form of VSD is this high perimembranous type. Supracristal VSDs are located in the right ventricular outflow tract just proximal to the pulmonary valve and the right coronary cusp of the aortic valve above the crista supraventricularis. These defects have a high incidence of aortic insufficiency as the aortic valve leaflet prolapses into the defect (1,6,11–13). Inlet VSDs are located anywhere in the ventricular septum under the mitral and tricuspid valve leaflets. This is a type of endocardial cushion defect. Muscular defects can be located anywhere along the muscular ventricular septum (1). VSDs are assessed both by size of the defect itself and by the amount of volume that is shunting. A large VSD approximates the size of the aorta (1). The size of the defect alone does not determine how much blood is shunted away from the systemic circulation toward the pulmonary circulation. The degree of pulmonary resistance determines the degree of shunting. Depending upon the type of VSD, aortic insufficiency may be a complicating factor as well (1).
Supracristal VSDs have a high incidence of concurrent aortic insufficiency.

Two-Dimensional and M-mode Evaluation
Echocardiography is a reliable method of detecting VSDs in large and small animals (14–20). Careful examination will allow most perimembranous defects to be seen on right parasternal long-axis left ventricular outflow views where the muscular ventricular septum joins the anterior aortic wall (Figures 9.1, 9.2). Four-chamber views should never be used to identify high membranous defects because these imaging planes often have normal echo dropout between the ventricular septum and atrioventricular junction. Right parasternal transverse views at the level of the aorta and left atrium or aorta and pulmonary artery also show high perimembranous defects (Figures 9.3, 9.4). The high membranous hole is typically seen under the tricuspid valve above the aorta.
Do not use four-chamber views to diagnose a VSD.
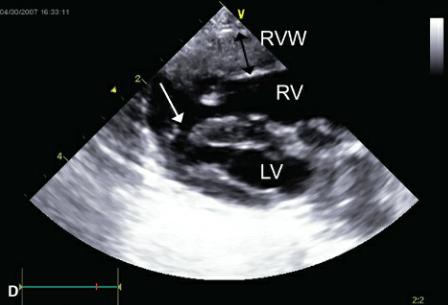
Figure 9.1 (A) A large ventricular septal defect is seen just proximal to the aortic valve (arrow). Volume overload of the left ventricular chamber is evident. The pulmonary artery is also dilated secondary to the large volume flowing through the shunt. (B) Color-flow Doppler documents left to right shunting through a high membranous ventricular septal defect. Plane = right parasternal long axis left ventricular outflow view, RV = right ventricle, LV = left ventricle, LA = left atrium, AO = aorta, PA = pulmonary artery.
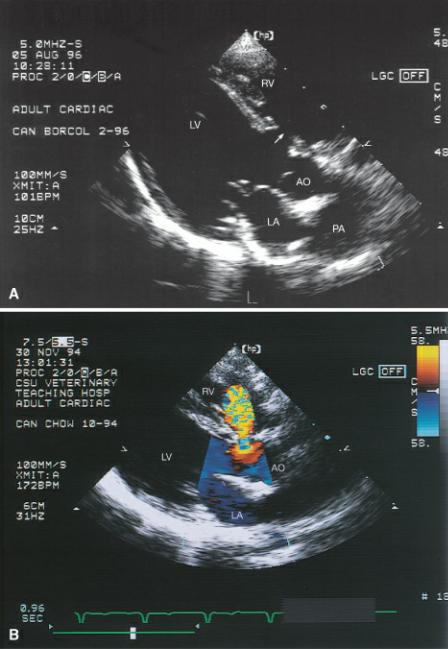
Figure 9.2 (A) A ventricular septal defect is clearly seen under the tricuspid valve (arrow) in this horse. Notice that the noncoronary cusp of the aortic valve overrides the septum. (B) Color-flow Doppler confirms its presence. Plane = right parasternal long axis left ventricular outflow view, RV = right ventricle, LV = left ventricle, AO = aorta.
Figure 9.3 Membranous ventricular septal defects (arrow) are seen at the level of the outflow tract on right parasternal transverse views of the heart base. RV = right ventricle, LVOT = left ventricular outflow tract, TV = tricuspid valve.
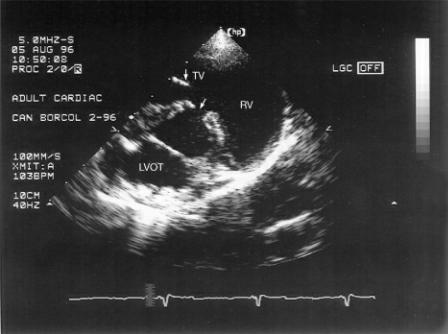
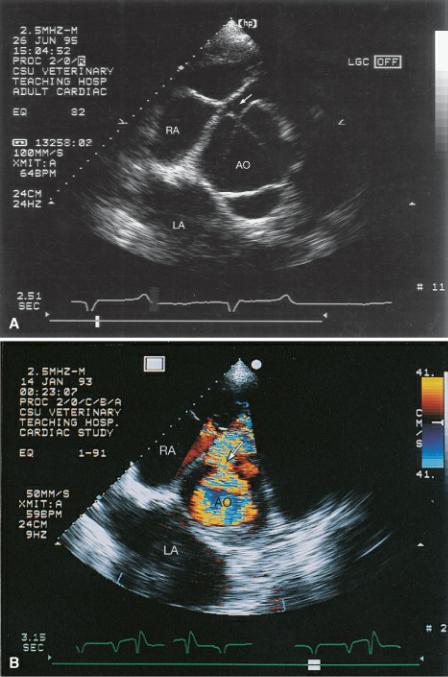
Figure 9.4 (A) The ventricular septal defect is right at the level of the aorta just under the tricuspid valve in this horse (arrow). (B) Color-flow Doppler shows the left to right shunting through the ventricular septal defect. Plane = right parasternal transverse heart base, RA = right atrium, AO = aorta, LA = left atrium.
Occasionally a VSD will be supracristal in the area proximal to both the aortic and pulmonary valves as opposed to under the tricuspid valve. A supracristal defect will not be seen in the right parasternal long-axis view. Color-flow Doppler may show systolic turbulence within the right side of the heart, but a point of flow origin will not be seen on four-chamber or left ventricular outflow planes. Supracristal VSDs are appreciated on right parasternal transverse images of the heart base just proximal to the pulmonary valve or on left cranial long-axis images of the aorta just proximal to the aortic and pulmonary valves (Figure 9.5). Color-flow Doppler is usually necessary to accurately identify this defect.
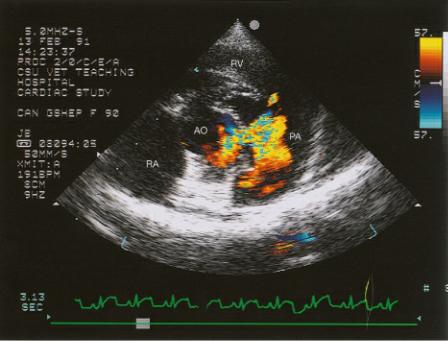
Figure 9.5 Supracristal ventricular septal defects are seen proximal to the aortic and pulmonic valves as opposed to under the tricuspid valve. Here color-flow Doppler shows left to right flow crossing the defect in the subpulmonic area. Plane = right parasternal transverse heart base, RV = right ventricle, AO = aorta, PA = pulmonary artery, RA = right atrium.
Ventricular septal defects may also be muscular (Figure 9.6) (9,11,19). They may be found anywhere along the ventricular septum. Turbulent color flow within the right ventricular chamber should prompt interrogation all along the septum.
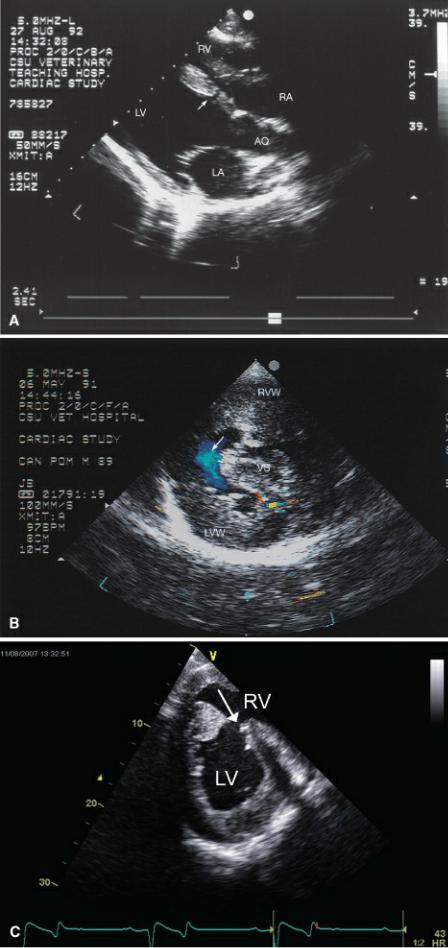
Figure 9.6 Muscular ventricular septal defects may be seen anywhere along the septum. (A) A small defect (arrow) is seen within the ventricular septum of this llama. Plane = right parasternal long-axis left ventricular outflow view. (B) A large muscular septal defect (arrow) is located toward the ventricular apex of this dog. Color-flow Doppler shows very little turbulence associated with this right to left shunt consistent with fairly balanced pressure between the right and left ventricles. This dog also had pulmonary and aortic stenosis. There is severe biventricular hypertrophy. Plane = right parasternal transverse left ventricle. (C) A large muscular defect (arrow) is seen in the middle of the ventricular septum on a right parasternal transverse view in this horse. (D) This kitten has a large ventricular septal defect (arrow) at the apex of the heart. Right ventricular hypertrophy (black arrow) is apparent, and pulmonary hypertension or stenosis should be suspected. This kitten had pulmonary stenosis. RVW = right ventricular wall, LVW = left ventricular wall, VS = ventricular septum, RV = right ventricle, LV = left ventricle, LA = left atrium, AO = aorta, RA = right atrium.
Very small defects at any location may not be seen with two-dimensional echocardiography, and Doppler studies are necessary to confirm the presence of the VSD (Figure 9.7). One study showed that only 82% of ventricular septal defects were seen on two-dimensional examinations without the aid of color-flow Doppler (21).
Figure 9.7 Very small ventricular septal defects may not be seen on two-dimensional images. They create very little, if any, changes in cardiac size. (A) The base of the ventricular septum appears mildly abnormal (arrow), but no defect is seen in this apparently normal heart. (B) Color-flow Doppler documents the presence of a small restrictive ventricular septal defect (arrow). Plane = right parasternal long-axis left ventricular outflow view, RV = right ventricle, LV = left ventricle, LA = left atrium, AO = aorta.
The pathway of blood in ventricular septal defect includes the left ventricle, right ventricle, pulmonary artery, lung, left atrium, and back into the left ventricle. Only those chambers and vessels will be volume overloaded. The aorta and right atrium are not involved in the shunt pathway and so should be normal if no other defects are complicating the picture. Even though the right ventricle is involved in this shunt pathway, there are a couple of reasons that this chamber may actually be normal in size despite the presence of a ventricular septal defect. The right and left ventricles contract simultaneously and as the blood is shunted toward the right side of the heart during systole, its proximity to the main pulmonary artery allows blood to essentially enter the right ventricular outflow tract and bypass the right ventricular chamber itself (1). Hemodynamically significant VSDs usually cause the right and left ventricular chambers to dilate (11,21).
VSD—shunt pathway
left ventricle →
right ventricle →
pulmonary artery →
lungs →
left atrium → left ventricle
The right ventricle may not be dilated in hearts with VSD even though it is in the shunt pathway.
The size of the VSD is a factor in how much dilation is present. A very small defect may not create any measurable volume overload of the chambers, which helps when deciding how hemodynamically significant the shunt is. Chamber dilation is directly proportional to the volume of blood being shunted. Even without Doppler evaluation to calculate pressures and volume through the vessels, the size of the chambers and vessels are an indication of whether the shunt volume is significant or not (8,19).
Hearts with significant shunts usually have significant volume overloads.
The pulmonary artery may be dilated in animals with sizable ventricular septal defects regardless of whether there is dilation of the rest of the right side of the heart. The artery sees all of the shunted blood. The vessel will be enlarged all along its length from the level of the pulmonary valve cusps into the bifurcation of the pulmonary artery (Figure 9.8). This differentiates the dilation from that seen in pulmonary stenosis when there is poststenotic dilation and the diameter of the pulmonary artery will change distal to the valve. The pulmonary valve itself should move normally. Slow motion or frame- by-frame analysis will show the cusps moving completely toward the walls of the pulmonary artery during systole. Failure to do so is suggestive of pulmonary stenosis.
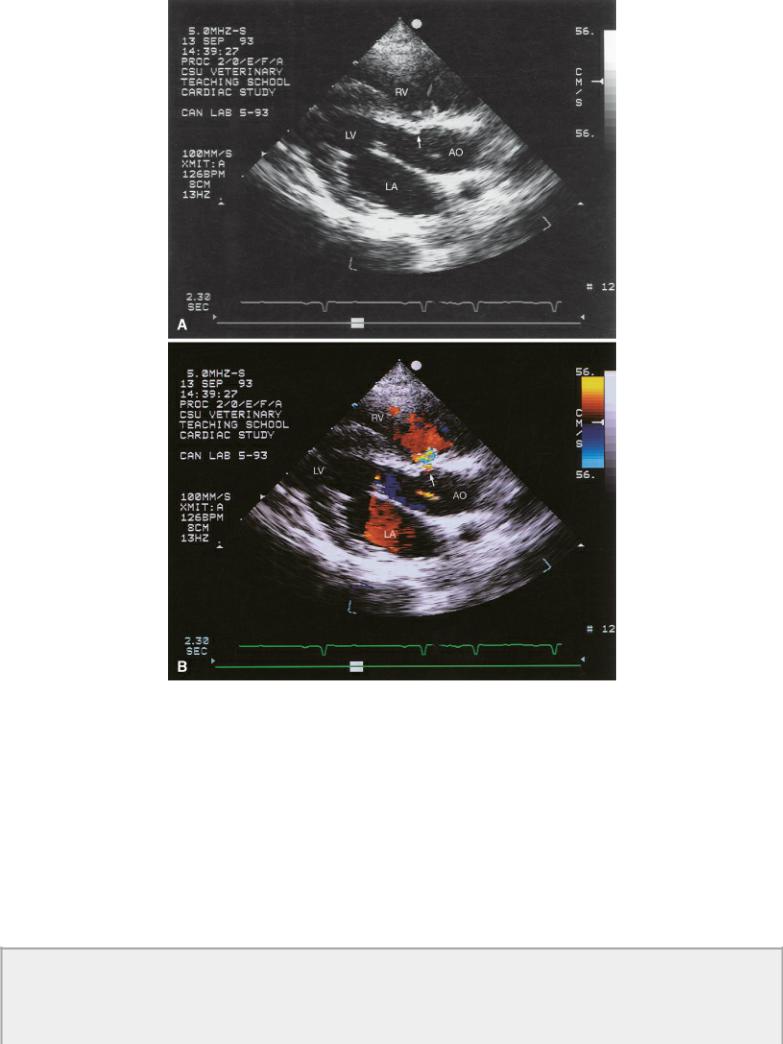
Figure 9.8 The ventricular septal defect in this cat has a shunt volume large enough to dilate the pulmonary artery as increased volume leaves the right side of the heart. Plane = right parasternal transverse heart base, RV = right ventricle, AO = aorta, RA = right atrium, PV = pulmonary valve, PA = pulmonary artery, RMPA = right main pulmonary artery, LMPA = left main pulmonary artery.
An M-mode feature that may help confirm the presence of a small defect when it cannot be seen on two-dimensional exams and when Doppler is unavailable is systolic tricuspid valve flutter. During
systole shunted blood strikes the septal leaflet after passing through the defect. This was present in 38% of dogs with VSD in one study (21). This finding is only reliable in the absence of tricuspid insufficiency when systolic flutter may be secondary to regurgitant flow as opposed to a shunt.
Aortic insufficiency is often seen in hearts with VSD especially if the VSD is of the supracristal type (1,11,13,22–25). The insufficiency is progressive and worsens with time in humans (24–27). Most insufficiencies are related to aortic valve prolapse. The right coronary or noncoronary cusp prolapses into the ventricular septal defect, and this is thought to be either secondary to a Venturi effect, a lack of normal muscular support at the level of the aortic cusps, or both (22,24,28–30). A prolapsing aortic valve cusp can be diagnosed from right or left parasternal long-axis imaging planes. The aortic valve cusp extends into the right ventricular chamber and breaks the line that would define a smooth transition between the anterior aortic wall and the ventricular septum (22). This prolapse usually results in insufficiency, but the prolapse may exist for quite some time before aortic regurgitation develops (22,30). Most significant aortic regurgitation is associated with a large VSD but having a small restrictive VSD does not preclude concurrent considerable aortic insufficiency (22,28). Patients with VSD often have abnormal aortic valve motion such as asymmetric cusp movement or reduced excursion of a cusp. They may also have a cusp override the ventricular septum where the center of the cusp is aligned with the center of the ventricular septum (Figure 9.2). Both of these aortic valve abnormalities can be associated with aortic insufficiency but neither is highly specific for the existence of aortic regurgitation. Both are indicators for the likely development of aortic regurgitation however because of subsequent prolapse of the cusp (28).
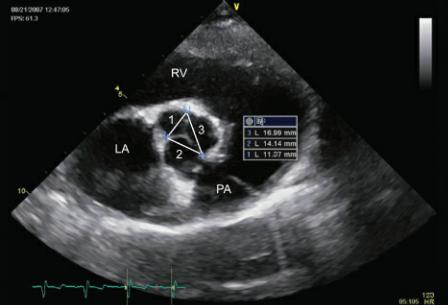
Aortic valve cusp size and ratio to each other has been evaluated in man. A ratio of right coronary cusp or noncoronary cusp width to left coronary cusp width greater than 1.2 that increases over time is an indicator that aortic insufficiency will probably progress to hemodynamically significant levels. The comparison is made to the left coronary cusp since it is usually the least affected cusp in ventricular septal defects while the right and noncoronary cusps are the ones that more often prolapse into the defect (Figure 9.9) (31).
Figure 9.9 A ratio of right coronary cusp or noncoronary cusp width to left coronary cusp width greater than 1.2 and that increases over time is an indicator that aortic insufficiency and will probably progress to hemodynamically significant levels. Here the ratio of right coronary cusp to left coronary cusp is 1.2. Plane = right parasternal transverse heart base view, RV = right ventricle, LA = left atrium, PA = pulmonary artery.
Diastolic mitral valve flutter, an increased E point to septal separation, diastolic septal vibration and diastolic aortic valve flutter are all M-mode features that may be present with aortic insufficiency (Figure 4.110, 5.60, 5.61) (11,13,21). The severity of aortic insufficiency should be evaluated with spectral and color-flow Doppler if they are available. This added volume load to the heart affects the prognosis and even in restrictive VSDs, the presence of a hemodynamically significant aortic insufficiency may lead to congestive heart failure (1,22,31). Analysis of aortic insufficiency is discussed in Chapters 4 and 5.
Aneurysmal dilation of the membranous septum into the right ventricular chamber is sometimes seen. A thin portion of the ventricular septum just proximal to the aortic valve will be seen prolapsing toward the right side of the heart (Figure 9.10). When it is perforate, the septal defect is usually seen in the ventral portion of the aneurysmal pocket and the shunted blood is directed posteriorly into the right ventricular chamber (32–37). This membranous ventricular septum aneurysm does not have to be perforate however and can be associated with spontaneous closure of a ventricular septal defect (Figure 9.10) (32,38,39). Spontaneous closure of a VSD is usually associated with the perimembranous form of defect. This has been reported in the dog by union of tissue from the septal leaflet of the tricuspid valve to the defect or from fibrous proliferation of tissue surrounding the defect (1,32,38). Chordae tendinae attaching to the aneurysmal dilation or fibrous adhesion over the VSD can sometimes be seen if the redundant tissue is associated with the septal leaflet of the tricuspid valve (32). Aortic insufficiency may be seen in association with this dilation but is usually mild in severity (32–35).
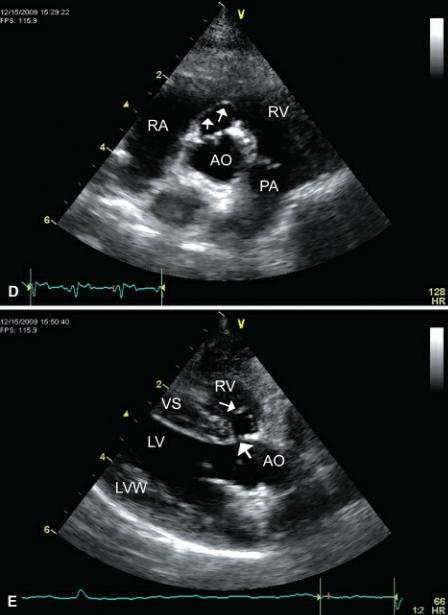
Figure 9.10 Sometimes an aneurysmal dilation of the membranous septum exists with ventricular septal defects. (A) A thin portion of the ventricular septum (black arrow) just proximal to the aortic valve is seen prolapsing toward the right side of the heart in this dog. The septal defect is quite small (white arrows). Plane = right parasternal long-axis outflow view. (B) On this transverse image at the heart base, the membranous septum prolapses (arrows) into the right ventricular chamber. (C) Although the aneurysm makes the defect appear quite large, color-flow Doppler reveals a small shunt (arrows). (D) This membranous ventricular septum aneurysm (arrows) is not perforate based upon color-flow Doppler interrogation and probably reflects spontaneous closure of the defect. Plane = right parasternal transverse heart base. (E) The same imperforate membranous aneurysm (small arrow) as in (D) seen from a long-axis outflow view. This ventricular septal defect (large arrow) may have been
perforate at one time. RV = right ventricle, RA = right atrium, VS = ventricular septum, LV = left ventricle, LA = left atrium, AO = aorta, TV = tricuspid valve, AOV = aortic valve, LVW = left ventricular wall.

Patients with VSD have eccentric enlargement with a dilated left ventricular diastolic dimension, normal wall thickness to chamber size ratios (suggesting adequate compensatory hypertrophy), and normal to increased systolic function (40).
Spectral and Color-Flow Doppler Evaluation
Most VSDs are easy to identify using echocardiography, but very small defects may require color Doppler examination to confirm their presence. It is in the assessment of their hemodynamic significance where Doppler ultrasound is especially useful. While color-flow Doppler can identify the defect and aid in assessing the size of a VSD, the hemodynamic significance of the defect is based on ventricular size, shunt ratios, and chamber pressures (41).
Color-flow Doppler finds most VSDs, but PW Doppler alone can also be utilized. Aliased systolic flow is seen with spectral and with color-flow Doppler if a VSD is present (Figures 9.1, 9.2, 9.4, 9.5, 9.6, 9.7). When the pulsed Doppler gate is placed along the ventricular septum on a tipped left ventricular outflow view, diastolic filling from the tricuspid valve may be recorded. Tricuspid inflow will be positive and upward just as VSD flow is. Tricuspid inflow however is typically not aliased and is present during diastole. The aliased color-flow signal should cross the ventricular septum and show
an area of flow convergence on the left ventricular side of the defect in most cases.
A restrictive ventricular septal defect is defined as one that does not elevate pulmonary vascular pressure. A pressure gradient will exist between the two ventricular chambers with a ratio of pulmonary to aortic pressure ratio of less than .3. Nonrestrictive VSDs have a pulmonary to aortic pressure ratio of greater than .66 (42). The velocity of blood flow through a small restrictive VSD should be high reflecting left ventricular pressure of greater than 100 mm Hg and right ventricular pressure of approximately 20 mm Hg. A pressure gradient of greater than 80 mm Hg is expected, and a velocity close to 5 meters per second should be recorded across the defect (Figure 9.11). Documenting velocities and pressure gradients consistent with restrictive flow suggests that the effect of the shunt is hemodynamically insignificant at the time of the exam (19).
Restrictive VSDs have high pressure gradients.
Pulmonary to aortic pressure ratios <.30 = restrictive VSD
<.66 = hemodynamically significant
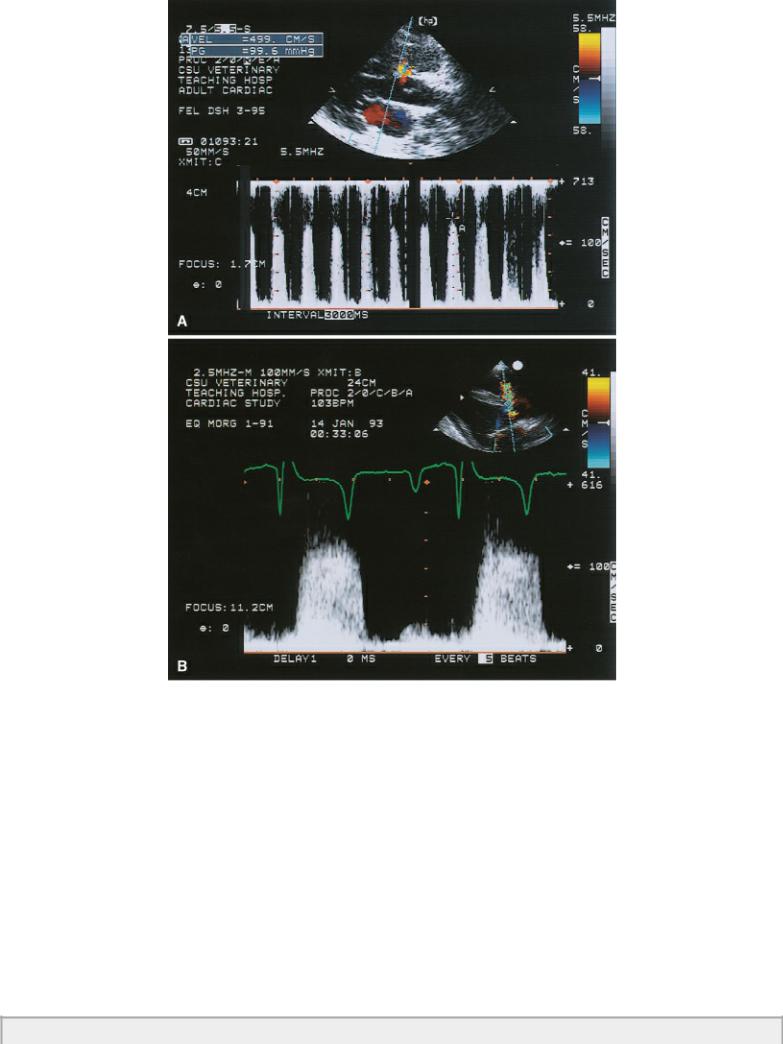
Figure 9.11 Both of these Doppler images show high velocity flow through ventricular septal defects. (A) A velocity of almost 5 m/sec and a calculated pressure gradient of 100 are consistent with a restrictive, hemodynamically insignificant ventricular septal defect. (B) The velocity of flow across the ventricular septal defect in this horse is approximately 4.5 m/sec reflecting normal leftand rightsided pressures.
Large VSDs allow the pressure between the right and left ventricles to equilibrate, and smaller pressure gradients will exist. The velocity of blood flow across the shunt will therefore be lower (Figure 9.12) (19). Velocity of blood flow will also be lower secondary a large aperture, which allows blood to flow through with less turbulence than if the defect was smaller. Therefore, lower gradients are indicative of larger defects, higher right ventricular pressures, and hemodynamically significant shunts. Obtaining a systemic blood pressure and subtracting the pressure gradient across the VSD from it will provide a good estimate of right-sided pressure in the absence of left ventricular outflow obstruction. In the absence of pulmonary stenosis, the right-sided pressure is equal to pulmonary artery systolic pressures, and the presence and degree of pulmonary hypertension can be assessed (43– 48). Pulmonary artery pressures of less than 30 mm Hg would not be of concern; pressures between 50 and about 80 or so suggest the presence of moderate pulmonary hypertension, while pressures above 80 or 90 mm Hg denote the existence of serious pulmonary hypertension. Dogs with calculated pressure gradients of 80 mm Hg or higher typically have a very good prognosis (18).
Low pressure gradients = large defects and/or pulmonary hypertension
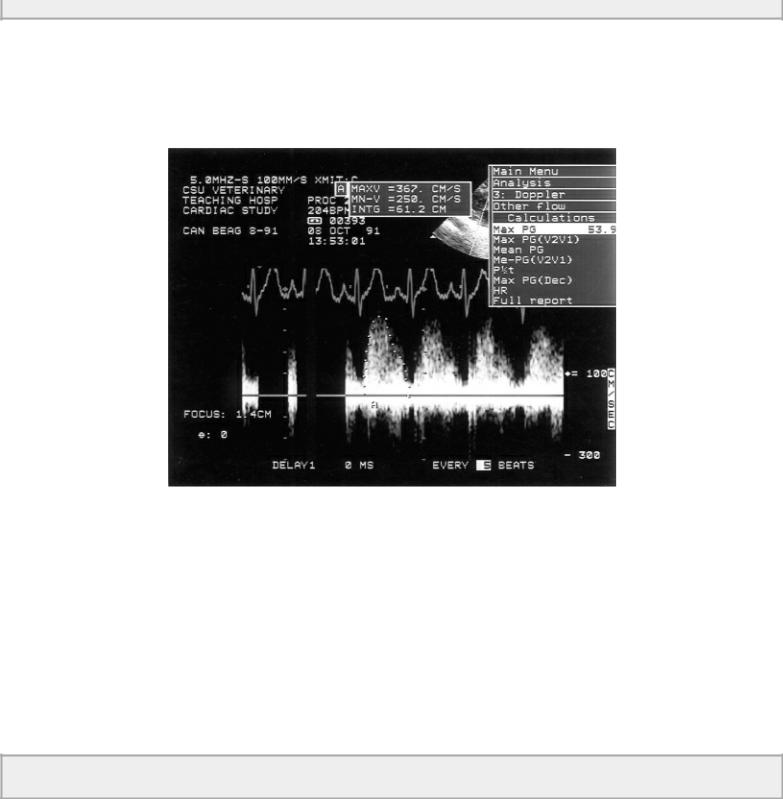
Figure 9.12 A low pressure gradient of 53.9 mm Hg across the ventricular septal defect in this dog is consistent with a large defect, which allows right and left ventricular pressures to equilibrate and/or the presence of pulmonary hypertension or stenosis. Right ventricular pressures are probably about 50 to 60 mm Hg.
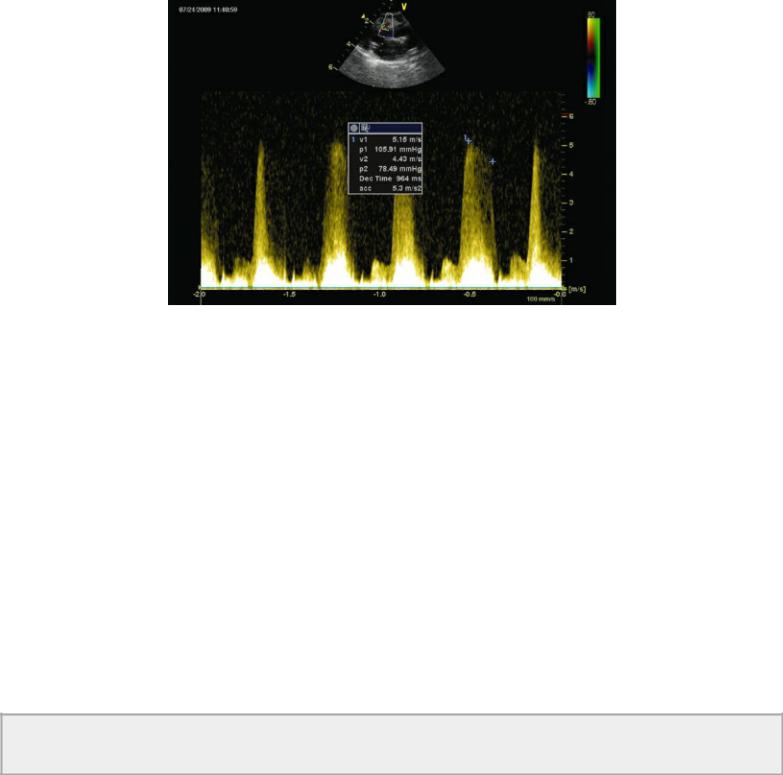
The normal flow profile representing flow across a VSD is plateau in shape. This reflects a pressure gradient from the right to left ventricle that does not change throughout the systolic time period. The peak velocity and pressure gradient of a flow profile that peaks early and declines throughout systole should be measured at end systole (Figure 9.13). This is more representative of the true pressure gradient between the two ventricles. In these patients peak left ventricular pressure is reached before peak right ventricular pressure, and measuring end systolic velocity of the shunt is a more accurate reflection of peak RV pressure. Using early peak velocity in these cases will underestimate right ventricular pressure (43,49). Right bundle branch block is also reported to cause an underestimation of right ventricular pressure, presumably because of asynchronous contraction and delayed elevations in RV pressure (50).
Use end systolic velocity in VSD flow profiles for the most accurate assessment of peak RV pressure.
Figure 9.13 The peak velocity and pressure gradient of a flow profile that peaks early and declines throughout systole should be measured at end systole. This is more representative of the true pressure gradient between the two ventricles. Here the peak pressure gradient is 105.9 mm Hg, while end systolic gradient is 78.49 mm Hg reflecting higher right ventricular pressure.
Recording flow velocity across a tricuspid regurgitant jet when present is another way to measure right ventricular pressure. The pressure gradient across the insufficient flow will reflect right ventricular pressure and in the absence of pulmonary stenosis will also reflect pulmonary vascular pressure. Similar estimates of right ventricular pressure when using both the tricuspid insufficiency if present and the VSD pressure gradient is a way to confirm and validate the assessment of RV pressure.
All of the shunted blood volume must enter the pulmonary artery. The velocity of blood flow within the artery will increase in direct proportion to the amount of excess volume flowing through the defect. This reflects the physical law of continuity that states that when all other factors are held constant, flow in equals flow out and velocity must increase between the two areas in order to maintain this relationship. Small shunt volumes will not elevate velocities to any great degree. When the pulmonary artery dilates secondary to the volume overload, flow velocity may not increase. The development of pulmonary hypertension will reduce the pressure gradient, which will decrease the velocity of the shunted blood as well as the amount of blood being shunted from left to right. Therefore, a VSD may be large but pulmonary flow velocity may not be high. The changes associated with pulmonary hypertension are described in Chapter 6. All causes of pulmonary hypertension create similar changes.
In the absence of pulmonic stenosis, the higher the pulmonary artery flow velocity the more significant the volume being shunted.
Right ventricular stroke volume can be calculated by obtaining flow velocity integrals from the pulmonary artery or mitral valve, both of which will reflect the volume flowing through the pulmonary system. The aortic flow velocity integral represents systemic volume. Multiplying these integrals by the cross-sectional area of the valve orifices allows volume to be determined and a shunt ratio (Qp : Qs) can be calculated. This is discussed in Chapter 4. Accurate planes through the measured areas, good Doppler tracings, and experience will increase the accuracy of calculating volumetric flow and shunt ratios. A ratio of greater than 2.0 is considered to have significant hemodynamic effects on the heart, and a ratio in excess of 2.5 warrants surgical correction of the defect in people. A ratio of less than 2 : 1 is usually considered to be restrictive in nature and not significant enough to warrant closure (40).
VSD—Qp : Qs
<2 : 1 = hemodynamically insignificant >2.5 : 1 = hemodynamically significant = surgical candidate in man
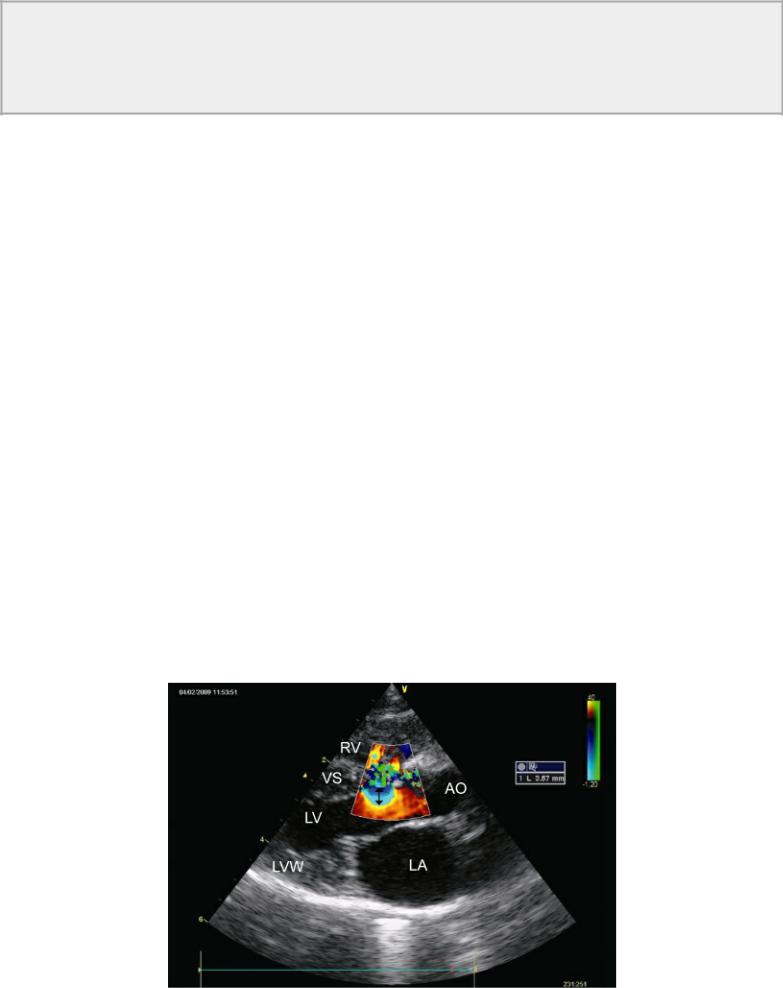
Analysis of proximal flow convergence (PISA) has been shown to be an effective way of assessing mitral regurgitant orifice size and regurgitant fractions and volumes. This method has also been used to assess shunt ratios (Qp : Qs) defect size and shunt volume in man, and shows significant correlation with catheterization methods in the presence of large VSDs((r = .90) (r = .93), (r = .90), respectively) (41). The largest isovelocity ring is identified at end systole to coincide with the highest pressure gradient (Figures 9.1, 9.2, 9.14). The radius is measured from the defect to the first aliased line on the left ventricular side of the defect, and the Nyquist limit is noted. Nyquist limits between 37 and 77 cm/sec are used. Peak velocity is recorded for the shunted blood, and the flow velocity integral is traced from flow profiles across the defect. Qp–Qs (l/min) is calculated from the following equation:
Equation 9.1 
where PISA is the radius of the isovelocity hemisphere, NL = Nyquist limit, FVI = flow velocity integral of VSD flow, HR = heart rate, Vmax = peak VSD velocity. The shunt ratio calculated with PISA correlates well with shunt ratios calculated by spectral Doppler (r = .96) but tended to underestimate true shunt fractions derived by catheterization methods and spectral Doppler (41,51,52). This method proved to be more accurate with large defects and can differentiate between large and small shunts (41,53).
Figure 9.14 Analysis of proximal flow convergence (PISA) is used to assess shunt ratios (Qp : Qs), defect size, and shunt volume of ventricular septal defects. The largest isovelocity ring (arrow) is identified and measured (3.57 mm) at end systole to coincide with the highest pressure gradient. See text for details. Plane = right parasternal long-axis left ventricular outflow view, RV = right ventricle, VS = ventricular septum, LV = left ventricle, LVW = left ventricular wall, LA = left atrium, AO = aorta.