

5. Data processing
For representation of the result of direct measurements of quantity x it is necessary:
1) Obtain the sequence of data x1, x2, x3, ..., xn (reduce to a Table of measurements).
2) Calculate the average value of measurand:
![]() .
(41)
.
(41)
3) Find an abmodality each measurement (in a Table of measurements):
![]() ;
;
![]() ;
... ;
;
... ;![]() .
(42)
.
(42)
4) Square each abmodality and summarize (in a Table of measurements):
![]()
![]()
![]() .
(43)
.
(43)
5) Find a statistical absolute error of measurements from Sdudent’s equation:
 .
(44)
.
(44)
where – confidence probability; n – number of measurements; t;n – Sdudent’s coefficient.
6) Find a device absolute error of measurements
![]() ,
(45)
,
(45)
- accuracy class of electrical measuring instrument, хmax – grid limit.
7) Find a total absolute error of measurements
Dx
=
![]() (46)
(46)
7) Calculate relative error of measurements:
 .
(47)
.
(47)
8) Final result is represented by a confidence interval and relative error:
![]() =
( …
± …
)0.95;
=
( …
± …
)0.95;
 =
… %.
(48)
=
… %.
(48)
For representation of the result of indirect measurements of quantity y it is necessary:
1) Calculate the average value of measurand <y> by formula from average values of known quantities <a>, <b>, <c>, for example:
 .
(49)
.
(49)
2) Calculate relative error of measurand y from relative errors of known quantities a , b , c by formula that should be gained accordingly to this example:
 ,
(50)
,
(50)
where a, b, c – absolute errors of known quantities; <a>, <b>, <c> – its average values.
3) Find an absolute error of measurand
Dy = <y>×dy . (51)
4) Final result should be represented by a confidence interval and relative error:
![]() =
( … ± …
)0.95;
=
( … ± …
)0.95;
![]() =
… %.
(52)
=
… %.
(52)
6. Work execution order and experimental data analysis
Mount the scheme of the Fig. 12, and connect into the bridge arm AB a resistor RX..
Write down into equipment table the values of parameters of resistor R1, resistor boxes R2 and R3, specifically – accuracy class bR1%, bR2% and bR3%.
Set a value of one-decade resistor box R2 in the bridge arm DC equal to R1, so the relation becomes R1/ R2=1.
Balance the bridge (I6=0) by changing a value of four-decade resistor box R3.
Write down the values R2, R3 into the table of measurements.
Make four more measurements for other values of relation R1 / R2, for example, 1/3; 1/5; 1/7 and 1/9.
By formula (40) to count n=5 times value of unknown resistance at various values R2 and R3. Write down the values RXi into the table of measurements.
To count an average value <RX> by formula (41), a deviation RXi each value of measurand RXi from the average value <RX> by formula (42), and the sum of squares of deviations from average
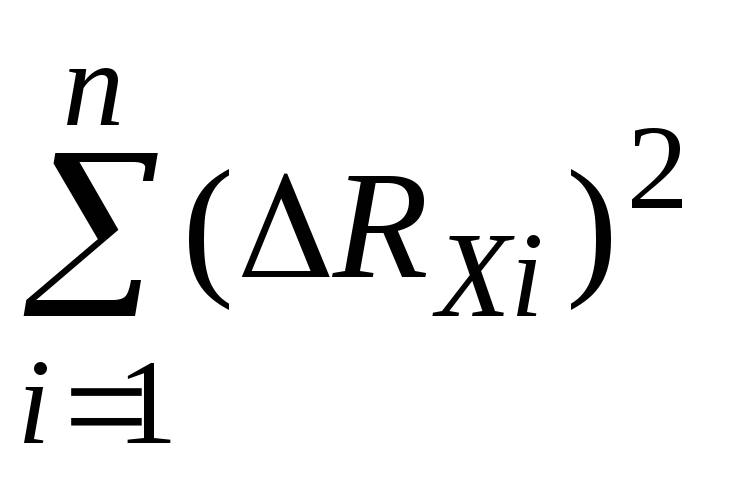 by formula (43).
Specify a value of confidence probability as =0,95 and number of measurements n=5, then obtain the value of Student coefficient as t 0,95 ; 5= 2,77.
Calculate a statistical absolute error of measurements RXST according to Student formula (44).
So far as unknown resistance is being counted by formula (40) using a values of three measuring instruments R1, R2, R3, then absolute device error RХDEV can be obtained as an error of indirect measurements by formula (51). Average value <RX> we obtain in p.8. Relative error of measurand DEV calculates according to (50) using the values of accuracy classes bR1%, bR2% and bR3% from equipment table:
 ...
...
Here indexes before the accuracy classes of devices R1, R2 and R3 are equals to one, because in the working formula (40) they have the first power.
Calculate a total absolute error of measurements RX according to (46).
Calculate a relative error of measurements RX according to (47).
Write down a final result as a confidence interval and relative error (48).
Conclude about what component of error (statistical or instrument) make the basic contribution to the full error of measurements.