

Narayanan V.K., Armstrong D.J. - Causal Mapping for Research in Information Technology (2005)(en)
.pdf220 Tegarden, Tegarden and Sheetz
Table 11. Givens-means-ends for consensus maps
Group |
Givens |
Means |
Ends |
Overall Group |
Leadership |
|
Growth |
Cognitive |
Leadership |
Communication |
External Image |
Faction 1 |
Mkt/Bus Development |
Customers |
Growth |
|
Organization |
Personnel Mgmt |
Quality |
|
|
|
Profitability |
Cognitive |
Communication |
Customers |
Growth |
Faction 2 |
Competitors |
Organization |
Mkt/Bus Development |
|
External Image |
Personnel Mgmt |
|
|
Leadership |
Profitability |
|
|
Products |
|
|
Cognitive |
Communication |
|
Growth |
Faction 3 |
Leadership |
|
Profitability |
|
Mkt/Bus Development |
|
|
|
Organization |
|
|
|
Personnel Mgmt |
|
|
Cognitive |
Communication |
Customers |
External Image |
Faction 4 |
Mkt/Bus Development |
Leadership |
Growth |
|
Organization |
Quality |
Personnel Mgmt |
|
Products |
|
Profitability |
3 and a means for Cognitive Faction 4. The Organization category was a given for Cognitive Factions 1, 3, and 4 and a means for Cognitive Faction 2. The GME analysis provides additional support for the existence of cognitive factions and the use of causal mapping to uncover them. We refer to the givens, means, and ends of the maps below where we discuss the similarities and differences among the maps.
Discussion
The above results demonstrated that there were higher levels of agreement within the cognitive factions than within the overall group and that there were differences between the cognitive factions. As such, the results provided support for using causal mapping to uncover cognitive diversity within a top management team. In this section, we describe the perceptions and beliefs within each cognitive faction as well as the differences between the cognitive factions.
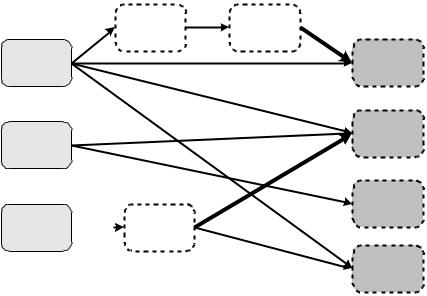
Figures 4 and 6 through 9 show the actual consensus causal maps for the overall group and the individual cognitive factions. The maps are drawn in a left to right order by Givens-Means-Ends. Givens are shown as a lightly shaded box drawn with a solid outline, Means are shown as an unshaded box drawn with a dashed outline, and Ends are shown as a darker shaded box drawn with a dashed outline. Positive causal relationships are shown with a solid arrow, while negative ones are shown with a dashed arrow. The width of the relationship line portrays the strength (1, 2, or 3) of the relationship.
The overall group consensus map (see Figure 4), only contains a single strong positive causal relationship. As such, there are no Means within this map. Based on the few categories contained within this map, it is obvious that there is a lack of agreement among the members of this strategic planning team.
Copyright © 2005, Idea Group Inc. Copying or distributing in print or electronic forms without written permission of Idea Group Inc. is prohibited.
Using Causal Mapping to Uncover Cognitive Diversity 221
The consensus map for Cognitive Faction 1 is shown in Figure 6. This faction was comprised of a board member and the president of the organization. As such, not surprisingly, this map shows that this faction believes that Leadership is a very important Given. In fact, the Leadership category causally affects five of the other categories either directly or indirectly: Communication, Customers, Quality, Growth, and Profitability. In fact, the only End that is not affected by Leadership is External Image. Additionally, Growth is a very important End, or goal, for this faction. This faction also believes that issues related to the Organization category, which was defined as “getting better organized, corporate structure, and organized to meet goals” (see Table 4), has a negative, or inverse, causal effect on Personnel Management which has a positive effect on Growth. This faction also believes that the Organization category has a negative or inverse relationship with Growth of the firm. This is due to the indirect relationship that Organization category has on the Growth category via the Personnel Management category. The causal effect from the Organization category to Growth is negative since Organization has negative direct effect on Personnel Management which, in turn has a positive direct effect on Growth. Therefore, if issues related to the Organization category increase, they will cause a decrease in Personnel Management which then will cause a decrease in Growth. This negative causal belief is counter to the other cognitive factions’ beliefs in which they feel that Organization has either a direct or an indirect positive relationship to Growth (see Figures 7 through 9).
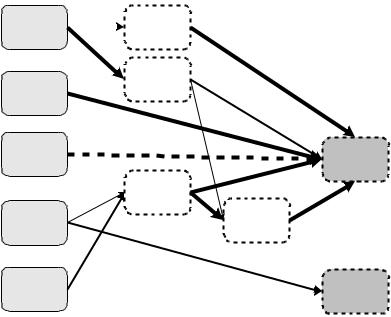
Figure 7 shows the consensus map for Cognitive Faction 2. This faction consisted of the VP of information technology, a business line in this firm, and the director of finance. This cognitive faction is the only one that included the Competitors category in their
Figure 6. Cognitive Faction 1 consensus map
Communication |
Customers |
Leadership |
Quality |
Marketing / |
Growth |
Business |
|
Development |
|
External Image
Organization |
|
|
|
|
|
|
|
|
|
Personnel |
|
|
|
|
|
|
|
|
|
Management |
|
|
|
|
|
|
|
|
|
|
|
Profitability
Copyright © 2005, Idea Group Inc. Copying or distributing in print or electronic forms without written permission of Idea Group Inc. is prohibited.
222 Tegarden, Tegarden and Sheetz
Figure 7. Cognitive Faction 2 consensus map
Communication |
|
Personnel |
|
Management |
|
|
|
Organization
Leadership
Competitors
Growth
Customers
External Image |
Profitability |
|
Marketing /
Products  Business
Development
consensus map. They believe that Competitor issues will negatively affect the Growth of the firm. They also have an internal and external causal theme that impacts Growth. The internal theme is driven by the Communication category and mediated by the Personnel Management and Organization categories. Based on this theme and the definition of the Communication category (see Table 4), it is obvious that this faction feels that internal organizational communication plays an important role in the growth of the firm. The external theme is driven by the External Image and Products categories and is mediated by the Customers and Profitability categories. This theme implies that for the firm to grow, the firm must increase their customers which will only occur if the firm’s external image is improved and the firm’s products are expanded. This external theme is unique to this faction.
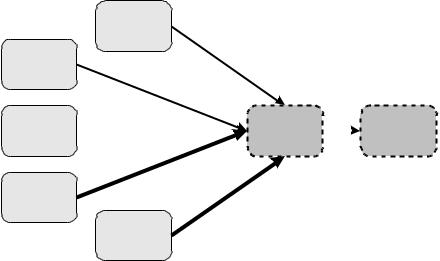
The consensus map for Cognitive Faction 3 (see Figure 8) is the simplest of the consensus maps. The members of this faction did not include five of the twelve categories identified by the strategic planning team. Table 8 shows that not only did this faction have the fewest nodes in their consensus map, they also had the fewest number of causal relationships, the smallest ratio of relationships to categories, and the smallest average cognitive centrality. Furthermore, this is the only faction whose map does not have any means. This faction was made up of three support function managers: VP of business development, director of marketing, and a human resource manager. Of the four factions, this one provides the least insight into what the firm needs to address and where the firm
Copyright © 2005, Idea Group Inc. Copying or distributing in print or electronic forms without written permission of Idea Group Inc. is prohibited.
Using Causal Mapping to Uncover Cognitive Diversity 223
Figure 8. Cognitive Faction 3 consensus map
Personnel
Management
Communication
Leadership |
|
Growth |
|
Profitability |
|
|
Organization
Marketing /
Business
Development
will go into the future. What we can infer from their consensus map is that they believe that the Givens (Personnel Management, Communication, Leadership, Organization, and Mkt/Bus Development) directly affect the Growth category. And, based on the strength of the relationships, they see issues related to the Organization and Mkt/Bus Development categories contributing the most to that Growth. Based on the membership of this faction, this should not be surprising. Based on the limited information contained in this map, it is very difficult to use it to help set the future direction of the firm. However, it can be used to reinforce ideas that are contained in the maps of the other cognitive factions. For example, the positive causal effect that Organization has on Growth, adds force to the similar belief contained in the consensus maps of Cognitive Factions 2 and 4 (see Figures 7 and 9).
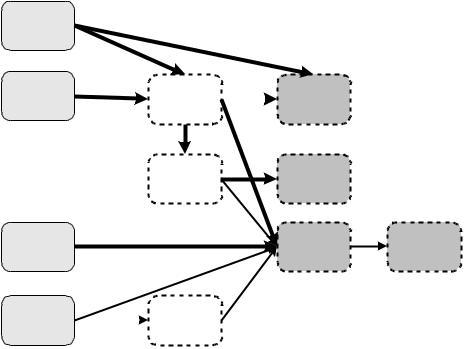
The consensus map for the final cognitive faction, Cognitive Faction 4, is shown in Figure 9. This faction included the CEO, VP and General Manager, VP of Logistics, and directors of logistics, technical services, and facility services—all of which are primary, traditional lines of business of the firm. This faction, like Cognitive Faction 2, has an internal and external set of causal themes. The internal theme shows that Communication issues indirectly affect the Growth of the firm via the Leadership and Quality categories. Interestingly, this is the only faction that did not see Leadership as a Given. Instead, Leadership only mediates the effect of the Communication and Organization issues have on the Growth of the firm. The external theme that this faction has identified is related
Copyright © 2005, Idea Group Inc. Copying or distributing in print or electronic forms without written permission of Idea Group Inc. is prohibited.
224 Tegarden, Tegarden and Sheetz
Figure 9. Cognitive Faction 4 consensus map
Communication
Organization |
Leadership |
|
Personnel |
|
|
Management |
|
|
|
|
Quality |
External Image |
|
Marketing / |
Growth |
|
Business |
Profitability |
|
Development |
|
|
Products |
|
Customers |
|
to the one identified by Cognitive Faction 2. In both cases, the Products category affects Growth via the Customers category. This again implies for Growth to occur for the firm, the Customer base must be increased which can be done by increasing the Product offerings. However, the two factions disagree as to the role that the External Image and Mkt/Bus Development categories play, one believes they are Givens, the other Ends.
By careful review of the different causal maps of the cognitive factions, it is clear that the different factions have different underlying belief structures. The identification of the similarities and differences among the cognitive factions allowed the uncovering of potentially important minority views of the form’s strategic position and future direction. Without the identification of the cognitive factions within the strategic planning team, these minority views may have been lost. As such, the identification and analysis of cognitive factions is useful as a beginning point in the negotiating and bargaining processes that are part of any strategic planning cycle.
This strategic planning team benefited from the information we uncovered regarding their different beliefs about where and how this company should grow. The issues identified from the factions in this study needed to be addressed by the planning team. It is our contention that the minority views uncovered through the identification and analysis of the cognitive factions would not have been heard if they had not been explicitly identified for the strategic planning team. While the political nature of top management teams
Copyright © 2005, Idea Group Inc. Copying or distributing in print or electronic forms without written permission of Idea Group Inc. is prohibited.

Using Causal Mapping to Uncover Cognitive Diversity 225
results in much bargaining and negotiation, the inclusion of strategic variables may not be the foundation of negotiation. Instead, resource constraints and control by individual managers become bargaining tools to gain a better position within the firm. In this case, the explicit uncovering of different beliefs regarding strategy increased the attention paid to the strategic aspects of the firm.
We also discovered, through discussion of the cognitive faction maps, that the planning team found this approach useful in identifying the key issues associated with their future direction. The friction between the different points of view was apparent throughout the planning retreat by all involved. However, until the cognitive faction maps were presented, it had remained below the surface. As such, the explicit representation through the maps facilitated the strategic planning team in reaching a better understanding of the different perspectives of their strategic situation. Again, the cognitive faction maps ensured that the minority views received (more) attention.
Summary
The use of causal mapping provides an efficient and effective way to identify idiosyncratic and shared knowledge among members of a top management team. By clustering the individual causal maps, based on their shared causal relationships, we were able to uncover a set of cognitive factions within the top management team. The number of cognitive factions represents the level of cognitive diversity within the team. Since our causal mapping approach forces the group to come to a common set of nodes or congregating labels before causal relationships are identified, clustering the maps is very straightforward. Furthermore, by forcing the group to identify the congregating labels, it enabled the creation of group maps to be created without researcher intervention, thus reducing the possibility of researcher bias.
We also provided a set of analyses that can be used to check the validity of the identified factions. We looked at the importance ratings (and their corresponding ranks) of the categories, the level of complexity of the causal maps, and the cognitive centrality (and their corresponding ranks) of the causal maps. We also compared the consensus maps using Givens-Means-Ends analysis. Finally, we compared the consensus maps based on the causal themes contained in them. The identification of the similarities within each cognitive faction and the differences between the cognitive factions is useful for a strategic planning facilitator to have as a beginning point for the typical negotiating and bargaining processes that are part of any strategic planning cycle.
The primary limitation for this approach to uncovering cognitive diversity is the requirement that the individual maps can only be merged once sufficient congregating labels have been identified. Depending on the causal mapping approach used, the identification of the congregating labels can be very labor intensive. By using the methodology incorporated in the GCMS, we were able to avoid this problem. However, once the congregating labels have been identified, and the individual maps have been recast using the congregating labels as the nodes in the causal maps, this approach is
Copyright © 2005, Idea Group Inc. Copying or distributing in print or electronic forms without written permission of Idea Group Inc. is prohibited.

226 Tegarden, Tegarden and Sheetz
straightforward. A second limitation of the reported research is that the results are based on a single top management team. As such, any generalization of the results must be done with care.
Our study did not show a relationship between demographic diversity and cognitive diversity. Even though many aspects of this strategic planning team were homogeneous, their belief structures were not. The assumption that demographic diversity measures cognitive diversity needs further investigation. We did find the cognitive factions to be related to the different functional areas of the organization. This relationship supports the view that divisions operating autonomously will have different experiences and decision contexts.
Further investigation into using causal mapping and cluster analysis to identify cognitive factions in top management teams as a way to uncover cognitive diversity is needed. Moreover, we believe that top management team research can benefit from cognitive diversity measurement that enables the researchers to directly measure relationships between team cognition with other organizational variables like structure, processes, and firm performance. Currently, we are investigating the use of our approach with other teams.
Finally, a more complete comparison of our approach with other approaches to uncover cognitive diversity is necessary. Specifically, how do the other collective cause mapping approaches affect the cognitive diversity of a group? We expect that researcher-driven approaches to either data capture or merging can reduce the diversity uncovered. For a strategic planning session, this may result in consensus too early in the planning process. With complex, diversified firms, the different perspectives of the factions can enhance the analysis of the firm’s situation.
Appendix: Description of the Group
Cognitive Mapping System3
The Group Cognitive Mapping System (GCMS) is a multi-user, client-server system that uses thick-client technology implemented in Java and SQL in conjunction with an Access database. The user interface for the data collection aspect of the system is implemented as a Java applet that runs within a WWW-browser. The data analysis portion of the system is implemented in SQL, C++, VBA, Excel, and SPSS. The researcher can either set up an ODBC connection from Excel or SPSS to the Access data base which allows the researcher to simply execute the appropriate analysis query or they can simply copy the results of a query in Access into an Excel table or SPSS data editor window and run the appropriate analysis tool.
Data Collection Tools
The design of the data collection aspect of the system is based on designs typically associated with group support systems (GSS). As such, the data collection part of the
Copyright © 2005, Idea Group Inc. Copying or distributing in print or electronic forms without written permission of Idea Group Inc. is prohibited.
Using Causal Mapping to Uncover Cognitive Diversity 227
system is organized around the idea of an agenda. Furthermore, all tools guarantee the anonymity of the participant. This helps alleviate any power-type relationships. The facilitator/researcher uses the agenda to control the deployment of the appropriate data collection tools. Currently, there are seven tools that directly support the cause map elicitation step in the methodology used in this study (see Figure 2 and Table 2). Additionally, there is a log-on tool that participants use to get access to the system. Each of the data collection tools is described below.
Concept Identification is supported with a distributed electronic brainstorming tool. In this tool, the subject is presented with a framing statement and is asked to type concepts into the system related to the framing statement. As they type their concepts in, the system distributes them to the screens of all other participants. In the case of a subject suffering from a mental block, the subject can also have the system display a stall diagram (see Figure 3). The stall diagram is essentially a graphical depiction of the framing statement.
Identify and Define Categories is supported using a tool that randomly chooses a participant and asks them to propose a category name and definition that can be used by all participants to categorize the concepts generated in the previous step. This tool provides the “definer” with the list of concepts in the order that they were generated. Once the definer creates a category and definition, the definer shares the proposed category and its definition with the other participants. The tool also includes a “chat room” type of facility that allows all participants to provide feedback on the proposed category and definition. Once the “group” is comfortable with the proposed category and definition, the definer saves them in the system. Next, the system chooses another participant to play the role of definer. This process goes on using a round-robin type of approach until the group is comfortable with the proposed set of categories.4
The Classify Concepts step was supported with a categorization tool in which the participants placed each concept into a single category that was defined in the previous step. This tool presents the list of concepts created in the first step, the categories and definitions created in the second step, and the list of concepts that the participant has placed in the current category (at the beginning, these lists are null). To categorize a concept, the participant chooses a concept and category and tells the system to place the concept in the category. It does not matter whether the participant chooses the category or concept first. When the participant chooses a category, both the definition of the category and the concepts currently placed in the category are displayed to the participant. Once the concept has been categorized, it is removed from the list of concepts to be categorized. Occasionally, a participant would like to reclassify a concept. The system supports this action by allowing the participant to remove the concept from a category by placing it back into the list of concepts to be categorized. At that point, the concept can be placed into any category.
Rank Categories is actually supported by two related tools: the Category Rating tool and the Category Rating Discussion tool. These tools support a Delphi-like process that allows the participants to rate the categories, discuss the category ratings, and then rerate the categories. The Category Rating tool provides the participant with the categories and their definitions along with a slider that allows them to rate each category on a scale of one (1) to nine (9). The tool displays the entire list of categories and their sliders
Copyright © 2005, Idea Group Inc. Copying or distributing in print or electronic forms without written permission of Idea Group Inc. is prohibited.

228 Tegarden, Tegarden and Sheetz
simultaneously. In this manner, the participant can perform both an absolute rating value, and by viewing the pattern of values displayed over the sliders, the participants can ensure that the individual category ratings are reasonable in a relative sense. As such, the tool supports both absolute and relative judgment (Miller, 1956). The Category Rating Discussion tool presents the individual participant ratings on their individual screen. Additionally, the tool displays the average group rating for each category. Again, this allows the participant to see the pattern of group rating values over the entire set of categories, by focusing on the sliders as a set, and to see how each category was rated by them and the group average, thus supporting a relative judgment model. Finally, the Category Rating Discussion tool provides a “chat room” type facility for the group to discuss the current rating values.
Relationship Identification, like Rank Categories, is supported by two related tools: a Relationship Identification tool and a Relationship Discussion tool. Using the Relationship Identification tool, the participants create their individual cause maps using the agreed upon, group-defined categories as nodes in their maps. The tool is set up in a manner that allows the participant to identify the origin category, the destination category, the type of causal relationship (positive or negative), and the strength of the causal relationship (strong:3, moderate:2, or slight:1). Once the participant has made these choices, the tool updates the evolving cause map and redraws it on the screen in a givens-means-end (GME) order. This always allows the participant to see the flow of causality in a left-to-right manner. The discussion tool allows the participants to discuss the current set of causal maps. To do this, the tool provides a chat-room type of facility to allow comments about the maps to be shared in an anonymous manner. The tool also provides a set of display options to allow the participants to see how their map compares to their fellow team members. The display options include:
•Showing individual maps only, collective maps, and/or both.
•Filtering of the maps based on their “strength” levels (3, 2, 1).
•Filtering the collective maps based on the level of agreement reached on the individual causal relationships identified, i.e., the percentage of participants agreed that the relationship existed.
The participants can also use the three options in combination. For example, they can choose to show both the collective and individual maps that portray relationships at least a 50% level of agreement and that the relationships have a strength level of 3.
Data Analysis Tools
The data analysis tools currently supported in the GCMS are divided into three categories: categorization analysis, importance rating and ranking analysis, and causal map analysis. In this section, we describe the tools used in identifying and evaluating cognitive factions. For the interested reader, we refer to Tegarden & Sheetz (2003) for a more complete description of the analysis tools supported.
Copyright © 2005, Idea Group Inc. Copying or distributing in print or electronic forms without written permission of Idea Group Inc. is prohibited.

Using Causal Mapping to Uncover Cognitive Diversity 229
From a cognitive faction analysis perspective, we have not used any of the categorization analysis tools supported by the GCMS. However, some of the unique tools supported include maps of attention (Huff, 1990), statistical level of agreement on categorization of concepts, parallel coordinate graph based analysis using concept generation order and participant concept categorizations (Inselberg, 1997), and association maps based on the participant’s concept categorizations. Most of the tools are implemented using the report generator in Access and SQL. The parallel coordinate graphs are implemented using SQL and Excel.
The GCMS currently supports three independent measures of category importance. In the current study, we described two of them: explicit importance ratings and cognitive centrality. The third that is supported is based on the concept categorizations. The more concepts placed in a category, the more focus on the issues contained in that category. To be able to compare across all three measures, each of the measures are converted to a rank-order scale. SQL queries are used to generate the data necessary to feed SPSS to perform the Kendall’s coefficient of concordance (W) computation to determine the level of agreement reached across participants for each measure and at the individual and group level, across the three measures.
Causal Map Analysis
There are many approaches used to analyze causal maps. In the context of cognitive factions, the GCMS supports map complexity computations, givens-means-ends (GME) analysis, the analysis of the level of agreement reached and the strength of relationships contained in the maps, and map similarity. The majority of the techniques are implemented as a set of SQL-based reports.
As described in the paper, there are different ways to compute the complexity of a causal map. The GCMS supports the computation of number of nodes, number of relationships, the ratio of relationships to nodes, and cognitive centrality. Also, using a graph theory program implemented in C++, the GCMS computes many graph theoretic measures (Harary, 1969). The GME, level of agreement, and relationship strength analyses is essentially identical to that described with the Relationship Discussion tool above. In addition to the tool, there are SQL-based reports that are available for the researcher to further analyze the maps.
From a map similarity perspective, the GCMS computes a similarity matrix that can be fed to SPSS for cluster analysis. At this point in time, communication between the GCMS and SPSS is one way. As such, once the clusters have been identified, the collective maps associated with each cluster must be manually identified in the GCMS before further analysis is possible. This is implemented through a set of SQL queries that places the participants into their relevant cluster (faction). Once this has been executed, the map analysis can proceed in the normal manner, i.e., each faction map is simply treated as either a collective map, for within faction analysis, or as an individual map, for between faction analysis.
Copyright © 2005, Idea Group Inc. Copying or distributing in print or electronic forms without written permission of Idea Group Inc. is prohibited.