

Narayanan V.K., Armstrong D.J. - Causal Mapping for Research in Information Technology (2005)(en)
.pdf210 Tegarden, Tegarden and Sheetz
Figure 3. Stall diagram
Government
Customers  IT Services
  Competitors
Firm
Year 1 |
Year 2 |
Year 3 |
Year 4 |
Year 5 |
Step 2: Identify and Define Categories
The purpose of this step was to identify and define a set of categories (congregating labels) that group the similar concepts identified in the previous step. Participants looked through the list of concepts to identify those that address a similar issue or idea. The participants then voluntarily proposed a category name and definition to the group. The facilitator recorded the proposed category name on a chalkboard. This continued until the group was satisfied with the group of the proposed categories. At no time did the facilitator provide any guidance as to the completeness or correctness of the group of categories suggested by the strategic planning team. The only types of comments by the facilitator were to ask whether the team wanted to add, delete, and/or merge categories. The facilitator, however, did not provide and suggestions as to what should be added deleted or merged. Since this step was not anonymous, the facilitator took great care to manage the power relationships that existed in this top management team2. This process continued until the group was satisfied with the list of categories and their definitions. This step is intended to allow the group to identify the sufficient congregating labels for identifying the causal maps.
Step 3: Classify Concepts
The purpose of this step was to allow the participants to deepen their shared understanding of the categories. In this step, the participants placed each concept into one of the categories defined in the previous step. Concepts that a participant did not feel belonged in one of the categories were placed into an Unknown category. This step was completed when all participants had placed the concepts into categories.
Copyright © 2005, Idea Group Inc. Copying or distributing in print or electronic forms without written permission of Idea Group Inc. is prohibited.

Using Causal Mapping to Uncover Cognitive Diversity 211
Step 4: Rank Categories
The purpose of this step is two-fold. First, to understand the relative importance of categories to the issues contained in the framing statement. Second, but equally important, this activity is to increase the shared understanding of the meanings of the categories for the participants, i.e., an attempt to ensure that the categories are indeed sufficient congregating labels. In this step, the participants rated the importance of each category to meeting the issues contained in the framing statement.
Step 5: Relationship Identification
Causal relationships are identified between categories. These relationships provide the final component of creating individual causal maps. Relationships are identified without viewing the relationships of other participants. In a causal map, an arrow indicates that a participant perceives that a change in the originating category affects the terminating category. To identify a causal relationship, the participant selects: (1) the origin category,
(2) the destination category, and (3) the direction (positive or negative) and amount of influence (strong:3, moderate:2, or slight:1) that the origin category has on the destination category. If the participant decides that they should not have included a relationship that is currently in their map, they may remove it. The participant repeats these steps until the participant is comfortable with the displayed map. At that time, the participant saves the map to the system. This activity is completed when all participants have saved their maps.
Collective Causal Map Derivation and Analysis
In our case, the process of deriving a collective causal map involves determining the number of participants that identified each possible relationship between the categories. This process is possible since the nodes of the derived collective maps have already been agreed upon by the group. As such, the system simply derives a series of collective causal maps from the individual maps by examining each of the possible relationships among the categories. The number of participants that identified the relationship and the average strength of the relationship are computed. The series of collective maps begins with a map containing only the relationships identified by all participants (a consensus map) and ends with a map containing relationships identified by any participant (a total map).
There are many techniques in the literature for analyzing causal maps. To begin with, in this study we analyze the complexity of the maps. A simple analysis of complexity is the number of nodes and links in the map and the ratio of links to nodes in the map. Simply put, the higher the ratio of links to nodes, the more complex the map (Eden, Ackermann & Cropper, 1992; Knoke & Kulkinski, 1982; Narayanan & Fahey, 1990). Cognitive centrality has also been used as a measure of the importance of a node in addressing the issues in the framing statement (Eden et al., 1992). As such, we converted the cognitive
Copyright © 2005, Idea Group Inc. Copying or distributing in print or electronic forms without written permission of Idea Group Inc. is prohibited.

212 Tegarden, Tegarden and Sheetz
centrality of each node into a rank ordering of importance for each participant. This is similar to the approach we used in converting the category ratings to rank orders.
Cognitive Faction Identification and Description
To identify the set of cognitive factions within the top management team, we used cluster analysis to group the individual participant maps together. To compute the similarity of one map to another, we computed Jaccard coefficients (Boyce, Meadow & Kraft, 1994) based on the shared causal relationships among the participants, i.e., the structural properties of the maps. The Jaccard coefficient was computed as:
#shared causal relationships in Map1and Map 2
#of causal relationships in Map1 + # of causal relationships in Map 2 − # shared causal relationships in Map1and Map 2
Since the nodes in the individual participant maps are identical, we only have to measure the similarity of the relationships contained in the individual causal maps. In this case, the more shared causal relationships, the greater the similarity is between the maps. For cognitive faction identification purposes, we ignored the strength of the relationships, e.g., if a positive relationship existed between two nodes in two different maps, but they had different strengths, we decided the two maps shared a causal relationship. However, we differentiated the relationships if they had different causal direction (positive vs. negative/inverse). Based on the computed Jaccard coefficients between every pair of individual maps, we clustered the maps together using Ward’s method. Ward’s method was chosen to attain increased coverage of cases, improved handling of outliers, and to minimize the effects of cluster overlap (Aldenderfer and Blashfield, 1984).
To provide further evidence of the cognitive factions uncovered, we used a set of analytical techniques, beyond that of cluster analysis, to provide independent justification of the identified cognitive factions. The analytical techniques included a productivity measure based on the number of concepts generated by the members of the respective cognitive factions. By looking at the productivity of each cognitive faction, we ensure that we are not simply clustering together the members of the team with similar levels of concept generation, e.g., those with a high-level of commitment to the process and those with a lower-level of commitment. We also used the techniques described previously with the overall group analysis: the complexity analysis, ratings, and cognitive centrality. In this case, we applied the techniques to the cognitive factions and compared the factions among themselves and to the overall group.
We also used Givens-Means-Ends (GME) analysis on the different cognitive faction consensus maps to demonstrate that each faction had different causal insights. GME analysis is an analytical technique that interprets the flow of causality as measured by the ratio of the number of inflows divided by the number outflows for the categories in the causal map (Bougon, Weick & Binkhorst, 1977; Eden et al., 1992; Weick & Bougon, 1986). Givens are identified by having more outflows than inflows of causal influence
Copyright © 2005, Idea Group Inc. Copying or distributing in print or electronic forms without written permission of Idea Group Inc. is prohibited.

Using Causal Mapping to Uncover Cognitive Diversity 213
Table 3. Sample concepts generated by participants
§Customer satisfaction is our number one strength
§Enhance our ability to attract and retain quality personnel
§Structure the company to support the coming growth
§Growth beyond 200M
§Give the stock actual value
§Develop a Human Resources Planning Process to develop new leaders
§Establish commercial client base
§Obtain capital for growth
§Never lose sight of our values and concern for our service and people
§Proportional growth within all three division/business areas
§Develop training programs to support management growth from within the company
§Provide great service to our customers
§Identify core competencies
(ratio < 1), means as having approximately the same number of inflows and outflows (ratio close to 1), and ends having more inflows than outflows (ratio > 1). Viewing the categories in increasing order of this ratio shows the direction of causality in a causal map (Bougon et al., 1977; Weick & Bougon, 1986). Givens represent the variables in the map that can be manipulated to influence the Ends, which represent the goals of the participants. The Means are moderators of the Given’s influence. GME analysis also can be used to identify causal themes contained in a causal map.
Results
This section is organized along the steps of the methodology used: causal map elicitation, collective causal map derivation and analysis, and cognitive faction identification and description. The results from each step are given.
Causal Map Elicitation
The causal map elicitation process elicited 153 concepts or about 12 concepts per participant. A sample of the generated concepts is given in Table 3. The top management team identified 12 categories. The categories and their definitions produced by the team members are given in Table 4.
The explicit importance ratings of the categories given by the top management team members were converted to rank orders and analyzed. The team members reached a moderate level of agreement on the rank ordering of the importance of each category (Kendall’s W = .514, X2 = 73.572, p = .000). Finally, using the categories identified, each member created an individual causal map.
Copyright © 2005, Idea Group Inc. Copying or distributing in print or electronic forms without written permission of Idea Group Inc. is prohibited.
214 Tegarden, Tegarden and Sheetz
Table 4. Participant identified categories and definitions
Category Name |
Definition |
Growth |
Of the company, customer base, revenues. |
Profitability |
ROI, stock value, fee, expectations. |
Communication |
Internal vertically and horizontally. |
Personnel Mgmt. |
Compensation, recruiting, HR, training, retention. |
Organization |
Getting better organized, corporate structure, organized to meet goals. |
External Image |
New logo, stakeholders, reputation, public image, name recognition. |
Products |
Information technology, services, solutions, expansion. |
Customers |
Anyone paying us money, internal functions. |
Marketing/BusDev |
Business development, strategic posturing, how to get customers. |
Leadership |
Accountability, ethics/corporate values, developing vision. |
Quality |
How you do the job, meet customer expectations, internal/external, compliance. |
Competitors |
Anyone who could take our work, internal component, anyone with work we want. |
Collective Causal Map Derivation and Analysis
The overall group consensus map for this strategic planning team only contained two categories (nodes) and a single causal relationship from Leadership to Growth giving a link to node ratio of .5 (See Figure 4). Obviously, the complexity of this map is nonexistent. On the other hand, the overall group total map contains all 12 categories and 119 causal relationships giving a link to node ratio of 9.9. As expected, the total map is substantially more complex. However, what was not expected is the degree of difference between the two maps. The consensus map only contains 17% of the categories and less than 1% of the actual causal relationships found in the total map. The average cognitive centrality is 1 and 6.7 for the consensus and total maps, respectively.
We also used cognitive centrality as a measure of the perceived importance of a node in addressing the issues in the framing statement. As in the ratings analysis, we converted the cognitive centrality of each node into a rank ordering of importance for each participant. In this case, the participants reached only a low level of agreement on the rank ordering of the importance of each category (Kendall’s W = .373, X2 = 53.406, p = .000). Based on the degree of differences uncovered between the consensus and total maps and the low level of agreement reached on the cognitive centrality based rank orderings, we concluded that further analysis was required to determine whether cognitive factions, i.e., subgroups of belief structures, existed or not.
Figure 4. Overall group consensus map
Leadership |
|
Growth |
|
||
|
Copyright © 2005, Idea Group Inc. Copying or distributing in print or electronic forms without written permission of Idea Group Inc. is prohibited.
Using Causal Mapping to Uncover Cognitive Diversity 215
Table 5. Cluster membership
|
Case |
5 Clusters |
|
4 Clusters |
|
3 Clusters |
|
1 |
|
|
1 |
|
1 |
1 |
|
|
2 |
|
|
2 |
|
2 |
2 |
|
|
|
|
|
|
|
|
3 |
|
|
3 |
|
3 |
|
|
|
|
|
|
3 |
|||
|
|
|
|
|
|
|
|
|
|
|
|
|
|
|
|
4 |
|
|
4 |
|
4 |
1 |
|
|
|
|
|
|
|
|
|
|
|
|
2 |
|
2 |
2 |
|
5 |
|
|
|
||||
|
|
|
|
|
|
|
|
6 |
|
|
2 |
|
2 |
|
|
|
|
|
|
2 |
|||
|
|
|
|
|
|
|
|
|
|
|
|
|
|
||
|
|
|
|
|
|
||
7 |
|
|
3 |
|
3 |
|
|
|
|
|
|
3 |
|||
|
|
|
|
|
|
|
|
|
|
|
|
|
|
|
|
8 |
|
|
5 |
|
3 |
3 |
|
|
|
|
|
|
|
|
|
9 |
|
|
5 |
|
3 |
|
|
|
|
|
3 |
||||
|
|
|
|
|
|
|
|
|
|
|
|
|
|
3 |
|
10 |
|
|
3 |
|
3 |
||
|
|
|
|
|
|
1 |
|
11 |
|
|
4 |
|
4 |
||
|
|
|
|
1 |
|
1 |
1 |
12 |
|
|
|
||||
|
|
|
|
|
|
|
|
13 |
|
|
3 |
|
3 |
3 |
|
|
|
|
|
|
|
|
|
Cognitive Faction Identification and Description
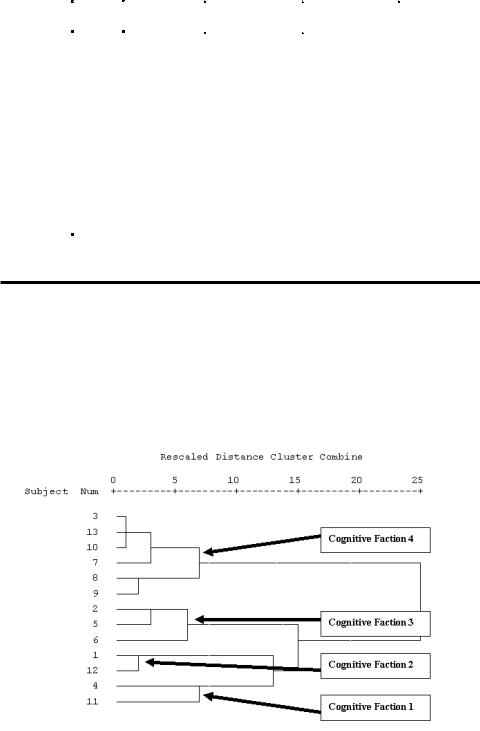
As described above, using the shared causal relationships, cluster analysis was used to identify the cognitive factions. In our case, we used the hierarchical cluster analysis in SPSS 12.0. The cluster analysis provided three potential sets of clusters: a three ([1,4,11,12], [2,5,6], [3,7,8,9,10,13]), four ([1,12], [2,5,6], [3,7,8,9,10,13], [4,11]), and five ([1,12], [2,5,6], [3,7,10,13], [4,11], [8,9]) cluster solution (See Table 5). The clusters were
Figure 5: Dendrogram using Ward Method
Copyright © 2005, Idea Group Inc. Copying or distributing in print or electronic forms without written permission of Idea Group Inc. is prohibited.
216 Tegarden, Tegarden and Sheetz
Table 6. Cognitive faction membership description
Cognitive Faction |
Company Function |
|
|
||
Number |
Executive |
Support |
|
Business |
Total |
1 |
2 |
0 |
|
0 |
2 |
2 |
0 |
1 |
|
1 |
2 |
3 |
0 |
3 |
|
0 |
3 |
4 |
1 |
1 |
|
3 |
5 |
Total |
3 |
5 |
|
4 |
12 |
identified based on the mathematical similarity computed using the Jaccard coefficient (Boyce et al., 1994). The higher the value of the coefficient, the more causal relationships shared among the team members. Using the dendogram in Figure 5, we chose to use four clusters based on the “closeness” or length of the line that merged similar groups together. A shorter line indicates that the Euclidian distance between two groups is smaller, indicating more similarity between the groups. For example, the shortness of the horizontal lines of participant numbers 3, 10, and 13 (at the top of the diagram) demonstrate that they share many causal relationships. Based on a visual inspection of the dendogram, we chose the four cluster solution. This was based on the length of the line that clusters participants 4 and 11 together. We decided that we would not allow any “weaker” clusters to be formed. As such, four cognitive factions were uncovered.
Demographic Analysis
A variety of demographic characteristics (age, experience, education) were compared across the four factions. None were significantly different across the factions. Even though the planning team’s ages ranged from 32 to 54 and job tenure at the company ranged from seven to 16 years, the differences were not associated with different belief structures. In addition, there was considerable homogeneity among the managers regarding education, gender and race. All but two of the managers had master’s degrees. The other two had bachelor’s degrees. All but one manager was male and all were Caucasian.
Table 7. Concept generation within groups
|
Overall |
|
Cognitive Factions |
|
|||
Measures |
Group |
1 |
|
2 |
3 |
|
4 |
Number of Group Members |
13 |
2 |
|
2 |
3 |
|
6 |
# Concepts Generated |
153 |
22 |
|
23 |
38 |
|
70 |
Avg # Concepts Generated per |
|
|
|
|
|
|
|
Category per Member |
.98 |
.92 |
|
.96 |
1.06 |
|
.97 |
Copyright © 2005, Idea Group Inc. Copying or distributing in print or electronic forms without written permission of Idea Group Inc. is prohibited.
Using Causal Mapping to Uncover Cognitive Diversity 217
The most distinguishing characteristic was type of functional area within the company reported in Table 6. We defined company functions as executive (CEO, President and board member), support functions (Director-HRM, Director-Marketing, Director-Fi- nance, and VP-Business Development), and business areas (VPs and Directors of IT, Logistics and Facilities Management). The president and board member define cognitive Faction 1. This represents two of the three top executives attending the strategic planning session. Cognitive Faction 2 is comprised of the VP of IT and the Director of Finance. IT represents the “newest” business division of the company. Cognitive Faction 3 consists of three support function managers and cognitive Faction 4 consists of logistics and transportation managers (the traditional line of business) as well as a top executive and a supporting general manager.
Description of Factions
When we look at each faction’s productivity, as measured by the number of concepts generated by the members of the factions, we find that all members generated about one concept per category (Table 7). This can be viewed as evidence that all faction members were about equally involved in the GCMS process. Next, we perform complexity, ratings, and cognitive centrality analysis for each of the cognitive factions and compare them among themselves and to the overall group. Following that, we present additional evidence that there are four cognitive factions by looking at clusters of categories, shared and idiosyncratic causal relationships, category analysis, and Givens-Means- Ends (GME) analysis for the different cognitive faction consensus maps.
Complexity Analysis
Table 8 presents the complexity measures for the consensus maps for the overall group and the cognitive factions. Visually inspecting Table 8 shows that the cognitive factions had a much higher level of agreement as to the number of nodes and relationships that existed in their consensus maps. Furthermore, there seems to be differences between the cognitive faction groups as to the ratio of links to nodes and average cognitive centrality of the consensus maps. This provides additional evidence that cognitive factions, i.e., subgroups of shared knowledge, existed within the top management team.
Table 8. “Consensus” map complexity
|
Overall |
|
Cognitive Factions |
|
|||
Measures |
Group |
1 |
|
2 |
3 |
|
4 |
Number of Nodes |
2 |
10 |
|
11 |
7 |
|
11 |
Number of Links |
1 |
11 |
|
14 |
6 |
|
13 |
Ratio of Links to Nodes |
0.5 |
1.1 |
|
1.3 |
.9 |
|
1.2 |
Avg Cognitive Centrality |
1 |
2 |
|
2.5 |
1.7 |
|
2.4 |
Copyright © 2005, Idea Group Inc. Copying or distributing in print or electronic forms without written permission of Idea Group Inc. is prohibited.

218 Tegarden, Tegarden and Sheetz
Table 9. Average category importance rating (and converted rank) by group
|
Overall |
|
|
|
Cognitive Factions |
|
|
|||
Category |
Group |
|
1 |
|
2 |
|
3 |
|
4 |
|
Growth |
8.31 |
(1) |
8.00 |
(3) |
6.50 |
(6) |
8.67 |
(1) |
8.83 |
(1) |
Leadership |
7.69 |
(2) |
7.50 |
(4) |
7.50 |
(2) |
7.00 |
(4) |
8.17 |
(2) |
Personnel Management |
7.69 |
(2) |
8.50 |
(1) |
7.00 |
(4) |
7.00 |
(4) |
8.00 |
(4) |
Mkt/Bus Development |
7.31 |
(4) |
8.50 |
(1) |
7.50 |
(3) |
6.67 |
(6) |
7.17 |
(5) |
Communication |
7.15 |
(5) |
7.00 |
(5) |
8.50 |
(1) |
8.00 |
(2) |
6.33 |
(7) |
Customers |
6.54 |
(6) |
5.50 |
(9) |
7.00 |
(4) |
6.33 |
(7) |
6.83 |
(6) |
Quality |
6.54 |
(6) |
7.00 |
(5) |
2.00 (10) |
6.00 |
(8) |
8.17 |
(2) |
|
Organization |
6.15 |
(8) |
6.00 |
(8) |
5.00 |
(7) |
8.00 |
(2) |
5.67 |
(9) |
Profitability |
5.69 |
(9) |
7.00 |
(5) |
5.00 |
(7) |
4.67 |
(9) |
6.00 |
(8) |
Products |
4.31 (10) |
5.00 (10) |
0.50 (11) |
4.00 (11) |
5.50 (10) |
|||||
External Image |
3.77 (11) |
3.00 (11) |
4.50 |
(9) |
4.33 (10) |
3.50 (11) |
||||
Competitors |
2.00 (12) |
1.00 (12) |
0.50 (11) |
1.00 (12) |
3.33 (12) |
|||||
|
|
|
|
|
|
|
|
|
|
|
Within Group |
|
|
|
|
|
|
|
|
|
|
Rank Order Agreement |
|
|
|
|
|
|
|
|
|
|
Kendall's W |
.514 |
|
.718 |
|
.823 |
|
.593 |
|
.620 |
|
X2 |
73.572 |
15.785 |
18.099 |
19.556 |
40.937 |
|||||
p |
.000 |
|
.149 |
|
.079 |
|
.052 |
|
.000 |
|
Importance Ratings and Cognitive Centrality Analysis
The top part of Table 9 shows the importance ratings for the overall group and the four cognitive factions. It is ordered by the overall group’s average importance ratings of categories shown in the second column in the table. The rating values in the table indicate there are differences among the factions and that the factions differ from the overall group. For example, Faction 2 ranks Communication as the most important category, while Faction 3 and 4 see Growth as the most important category. When we analyzed the factions for within group agreement, we found that the level of agreement (Kendall’s W) increased among the members of each faction in comparison to the level of agreement reached in the overall group. The increased values range from .593 (Faction 3) to .823 (Faction 2) compared to .514 for the overall group. However, due to the small size of each faction, the statistical significance of the level of agreement decreased. These results provide additional evidence that the beliefs of the individuals in the factions were more similar to each other than they were to the beliefs of the entire team or other combinations of the cognitive factions.
Table 10 displays the average cognitive centrality of each node (category) in the individual maps for the overall group and the cognitive factions. It is ordered by the overall group’s average cognitive centrality. A review of the table indicates that the cognitive factions disagree with one another and they all differ from the overall group. Furthermore, the within group agreement is greater for the factions than for the overall group. The level of agreement values ranged from .465 (Faction 4) to .716 (Faction 3) in comparison to .373 for the overall group. However, like the ratings, the statistical significance of the level of agreement decreased due to the small size of each faction. Like the ratings, these results provide additional evidence for the identified cognitive factions.
Copyright © 2005, Idea Group Inc. Copying or distributing in print or electronic forms without written permission of Idea Group Inc. is prohibited.

Using Causal Mapping to Uncover Cognitive Diversity 219
Table 10: Average cognitive centrality (and converted rank) by group
|
Overall |
|
|
Cognitive Factions |
|
|
||||
Category |
Group |
|
1 |
|
2 |
|
3 |
|
4 |
|
Growth |
12.31 |
(1) |
8.50 |
(1) |
10.00 |
(1) |
5.67 |
(3) |
16.00 |
(1) |
Personnel Management |
7.46 |
(2) |
7.50 |
(2) |
4.00 |
(5) |
6.67 |
(1) |
9.00 |
(7) |
Quality |
7.31 |
(3) |
5.50 |
(5) |
3.00 (10) |
3.33 |
(6) |
11.33 |
(2) |
|
Leadership |
7.08 |
(4) |
6.00 |
(3) |
3.50 |
(9) |
4.00 |
(4) |
10.17 |
(5) |
Mkt/Bus Development |
6.92 |
(5) |
6.00 |
(3) |
4.00 |
(5) |
2.67 |
(7) |
10.33 |
(4) |
Profitability |
6.92 |
(5) |
5.00 |
(6) |
5.00 |
(3) |
2.33 |
(8) |
10.50 |
(3) |
Communication |
6.77 |
(7) |
5.00 |
(6) |
4.00 |
(5) |
4.00 |
(4) |
9.67 |
(6) |
Customers |
6.15 |
(8) |
4.00 |
(8) |
6.50 |
(2) |
1.67 (10) |
9.00 |
(7) |
|
Organization |
5.77 |
(9) |
4.00 |
(8) |
4.50 |
(4) |
6.00 |
(2) |
6.67 (11) |
|
External Image |
5.62 (10) |
4.00 |
(8) |
4.00 |
(5) |
2.00 |
(9) |
8.50 (10) |
||
Products |
5.23 (11) |
2.00 11) |
2.50 (11) |
1.67 (10) |
9.00 |
(7) |
||||
Competitors |
3.08 (12) |
1.50 (12) |
2.00 (12) |
0.67 12) |
5.17 (12) |
|||||
|
|
|
|
|
|
|
|
|
|
|
Within Group |
|
|
|
|
|
|
|
|
|
|
Rank Order Agreement |
.373 |
|
.536 |
|
.660 |
|
.716 |
|
.465 |
|
Kendall's W |
|
|
|
|
|
|||||
X2 |
53.406 |
1.800 |
14.513 |
23.627 |
30.711 |
|||||
p |
.000 |
|
.379 |
|
.206 |
|
.014 |
|
.001 |
|
By reviewing the results reported in Tables 9 and 10, we see that the level of agreement within the factions on both the explicit importance ratings and the cognitive centrality of the categories are greater than what was reached by the overall group. This demonstrates that the members within the cognitive factions agreed with one another more than they agreed with members of the other cognitive factions. By reexamining the average rating and converted rank order of the importance of each category (see Table 9), we see that there is substantial disagreement between the cognitive factions. For example, the Growth category is the most important category for Cognitive Factions 3 and 4, while it is only the sixth ranked category for Cognitive Faction 2. Furthermore when inspecting Table 10, we see that not only does the rank ordering of the categories by cognitive centrality values differ between the cognitive factions, but we also see that the level of connectivity among the categories are different. For example, the causal maps for Cognitive Faction 4 are much more interconnected than the other cognitive factions.
Givens-Means-Ends Analysis
Both the overall group and cognitive faction maps can be evaluated using givens means ends (GME) analysis to determine the flow of causality through the map (Bougon et al., 1977; Eden et al., 1992; Weick & Bougon, 1986). Table 11 presents the Givens, Means, and Ends of the overall group’s and cognitive faction’s consensus maps. Again, there is little agreement among the cognitive factions. All cognitive factions only agreed to the Growth category as playing the role of an end, or goal. The other six common categories played different roles for different subsets of the cognitive factions. The Communication category was perceived as a given by Cognitive Factions 2, 3, and 4 and as a means by Cognitive Faction 1. The Leadership category was a given for Cognitive Factions 1, 2,
Copyright © 2005, Idea Group Inc. Copying or distributing in print or electronic forms without written permission of Idea Group Inc. is prohibited.