- •Study Skills Workshop
- •1.1 An Introduction to the Whole Numbers
- •1.2 Adding Whole Numbers
- •1.3 Subtracting Whole Numbers
- •1.4 Multiplying Whole Numbers
- •1.5 Dividing Whole Numbers
- •1.6 Problem Solving
- •1.7 Prime Factors and Exponents
- •1.8 The Least Common Multiple and the Greatest Common Factor
- •1.9 Order of Operations
- •THINK IT THROUGH Education Pays
- •2.1 An Introduction to the Integers
- •THINK IT THROUGH Credit Card Debt
- •2.2 Adding Integers
- •THINK IT THROUGH Cash Flow
- •2.3 Subtracting Integers
- •2.4 Multiplying Integers
- •2.5 Dividing Integers
- •2.6 Order of Operations and Estimation
- •Cumulative Review
- •3.1 An Introduction to Fractions
- •3.2 Multiplying Fractions
- •3.3 Dividing Fractions
- •3.4 Adding and Subtracting Fractions
- •THINK IT THROUGH Budgets
- •3.5 Multiplying and Dividing Mixed Numbers
- •3.6 Adding and Subtracting Mixed Numbers
- •THINK IT THROUGH
- •3.7 Order of Operations and Complex Fractions
- •Cumulative Review
- •4.1 An Introduction to Decimals
- •4.2 Adding and Subtracting Decimals
- •4.3 Multiplying Decimals
- •THINK IT THROUGH Overtime
- •4.4 Dividing Decimals
- •THINK IT THROUGH GPA
- •4.5 Fractions and Decimals
- •4.6 Square Roots
- •Cumulative Review
- •5.1 Ratios
- •5.2 Proportions
- •5.3 American Units of Measurement
- •5.4 Metric Units of Measurement
- •5.5 Converting between American and Metric Units
- •Cumulative Review
- •6.2 Solving Percent Problems Using Percent Equations and Proportions
- •6.3 Applications of Percent
- •6.4 Estimation with Percent
- •6.5 Interest
- •Cumulative Review
- •7.1 Reading Graphs and Tables
- •THINK IT THROUGH The Value of an Education
- •Cumulative Review
- •8.1 The Language of Algebra
- •8.2 Simplifying Algebraic Expressions
- •8.3 Solving Equations Using Properties of Equality
- •8.4 More about Solving Equations
- •8.5 Using Equations to Solve Application Problems
- •8.6 Multiplication Rules for Exponents
- •Cumulative Review
- •9.1 Basic Geometric Figures; Angles
- •9.2 Parallel and Perpendicular Lines
- •9.3 Triangles
- •9.4 The Pythagorean Theorem
- •9.5 Congruent Triangles and Similar Triangles
- •9.6 Quadrilaterals and Other Polygons
- •9.7 Perimeters and Areas of Polygons
- •THINK IT THROUGH Dorm Rooms
- •9.8 Circles
- •9.9 Volume
- •Cumulative Review
616 |
Chapter 7 Graphs and Statistics |
Solution
a. To find the mean, we add the measurements and divide by the |
|
3 |
4 |
|
|
|
|
|||
|
3.43 |
|
|
|
|
|||||
number of values, which is 8. |
|
3.25 |
3.38 |
|||||||
|
|
|
|
|
3.48 |
8 |
|
|||
|
3.43 3.25 3.48 3.39 3.54 3.48 3.23 3.24 |
27.04 |
||||||||
Mean |
|
3.39 |
24 |
|
||||||
|
|
|||||||||
|
|
|
8 |
|
|
|
|
|
|
|
|
|
27.04 |
|
3.54 |
3 |
0 |
||||
|
|
|
|
|||||||
|
|
In the numerator, do the addition. |
|
3.48 |
2 |
4 |
||||
|
|
|
3.23 |
|
|
|
64 |
|||
8 |
|
|
|
|
|
|||||
3.38 |
Do the division. |
|
3.24 |
|
64 |
|||||
|
|
|
|
|
|
|
||||
|
|
|
|
|
|
|
|
|
|
|
The mean is 3.38 cm.
b.To find the median, we first arrange the eight measurements in increasing order.
Smallest |
3.23 |
3.24 |
3.25 |
3.39 |
3.43 |
3.48 |
3.48 |
3.54 |
Largest |
|
|
|
|
|
|
|
|
|
|
Two middle measurements
Because there is an even number of measurements, the median is the average of the two middle values.
3.39 3.43 6.82 3.41 cm
2 2
c. Since the measurement 3.48 cm occurs most often (twice), it is the mode.
THINK IT THROUGH The Value of an Education
“Additional education makes workers more productive and enables them to increase their earnings.”
Virginia Governor, Mark R.Warner, 2004
As college costs increase, some people wonder if it is worth it to spend years working toward a degree when that same time could be spent earning money. The following median income data makes it clear that, over time, additional education is well worth the investment. Use the given facts to complete the bar graph.
Median Annual Earnings of Full-Time Workers (25 years and older) by Education
$70,000 |
$60,000 |
$50,000 |
$40,000 |
$30,000 |
$22,212 |
$20,000 |
$10,000 |
$0 |
Less than a |
|
High |
Some |
Associate Bachelor’s Master’s |
|||||
high school |
school |
college |
degree |
degree |
degree |
||||
diploma |
graduate |
|
|
|
|
|
|
|
|
$8,603 |
$2,815 |
$4,745 |
$12,618 |
$13,035 |
|||||
more |
more |
more |
more |
|
more |
Source: Bureau of Labor Statistics, Current Population Survey (2008)
ANSWERS TO SELF CHECKS
1. |
$1,540 |
2. 120 miles per day |
3. 2 incorrect answers 4. 2.75 5. 2 |
1 |
6. 80.5 |
7. |
4 8. |
mean: 5.11 oz; median: |
5.00 oz; mode: 4.95 oz |
2 |
|
|
|
|
S E C T I O N |
7.2 |
STUDY SET |
||||||
|
|
VOCABULARY |
|
||||||
|
|
|
|||||||
|
|
|
|||||||
|
Fill in the blanks. |
|
|
|
|||||
1. |
The |
|
|
(average) of a set of values is the sum of |
|||||
|
|
|
the values divided by the number of values in the set. |
||||||
2. |
The |
|
|
of a set of values written in increasing |
|||||
|
|
|
order is the middle value. |
||||||
3. |
The |
|
of a set of values is the single value that |
||||||
|
|
|
occurs most often. |
|
|||||
4. |
The mean, median, and mode are three measures of |
||||||||
|
|
|
|
|
tendency. |
|
CONCEPTS
5.Fill in the blank. The mean of a set of values is given by the formula
Mean the sum of the values
6.Consider the following set of values written in increasing order:
3 |
6 |
8 |
10 |
11 |
15 |
16 |
a.Is there an even or an odd number of values?
b.What is the middle number of the list?
c.What is the median of the set of values?
7.Consider the following set of values written in increasing order:
4 |
5 |
5 |
6 |
8 |
9 |
9 |
15 |
a.Is there an even or odd number of values?
b.What are the middle numbers of the set of values?
c.Fill in the blanks:
Median 2 2
8. Consider the following set of values:
1 |
6 |
8 |
6 |
10 |
9 |
10 |
2 |
6 |
a.What value occurs the most often? How many times does it occur?
b.What is the mode of the set of values?
7.2 Mean, Median, and Mode |
617 |
GUIDED PRACTICE
Find the mean of each set of values. See Example 1.
9. |
3 |
4 |
7 |
7 |
|
8 |
|
11 |
16 |
|
|
|
10. |
13 |
|
15 |
17 |
|
17 |
|
15 |
13 |
|
|
|
11. |
5 |
9 |
12 |
35 |
|
37 |
45 |
60 |
77 |
|
||
12. |
0 |
0 |
3 |
4 |
|
7 |
|
9 |
12 |
|
|
|
13. |
15 |
|
7 |
12 |
19 |
|
27 |
17 |
19 |
35 |
20 |
|
14. |
45 |
|
67 |
42 |
|
35 |
|
86 |
52 |
91 |
102 |
|
15. |
4.2 |
|
3.6 |
7.1 |
5.9 |
8.2 |
|
|
|
|||
16. |
19.1 |
12.8 |
16.5 |
20.0 |
|
|
|
Find the median of each set of values. See Example 5.
17. |
29 |
|
|
5 |
|
|
1 |
|
9 |
11 |
|
17 |
2 |
|
||||||||
18. |
20 |
|
|
4 |
|
|
3 |
|
2 |
9 |
|
|
8 |
|
1 |
|
|
|||||
19. |
7 |
5 |
4 |
7 |
|
|
3 |
|
6 |
7 |
4 |
1 |
||||||||||
20. |
0 |
0 |
3 |
4 |
|
|
0 |
|
0 |
3 |
4 |
5 |
||||||||||
21. |
15.1 |
44.9 |
|
|
19.7 |
|
13.6 |
|
17.2 |
|||||||||||||
22. |
22.4 |
22.1 |
|
|
50.5 |
|
22.3 |
|
22.2 |
|||||||||||||
23. |
1 |
|
|
|
999 |
|
|
|
16 |
|
|
1 |
|
|
5 |
|
|
|||||
100 |
|
1,000 |
|
|
15 |
|
|
3 |
|
8 |
|
|
||||||||||
24. |
1 |
|
|
17 |
|
|
7 |
|
|
|
29 |
|
|
11 |
|
|
|
|||||
30 |
|
|
30 |
|
30 |
|
30 |
|
30 |
|
|
|
Find the median of each set of values. See Example 6.
25. |
8 |
|
10 |
|
16 |
63 |
6 |
|
7 |
|
|
|
|
|
||||||||||
26. |
7 |
|
2 |
|
|
11 |
5 |
|
|
4 |
|
17 |
|
|
|
|
|
|
||||||
27. |
39 |
1 |
|
50 |
41 |
51 |
47 |
|
|
|
||||||||||||||
28. |
47 |
18 |
35 |
29 |
|
27 |
16 |
|
|
|
||||||||||||||
29. |
1.8 |
1.7 |
|
|
2.0 |
|
|
9.0 |
|
2.1 |
2.3 |
2.1 |
2.0 |
|||||||||||
30. |
5.0 |
1.3 |
|
|
5.0 |
|
|
2.3 |
|
4.3 |
5.6 |
3.2 |
4.5 |
|||||||||||
31. |
1 |
|
|
11 |
|
|
13 |
|
2 |
|
3 |
|
7 |
|
|
|
|
|
||||||
5 |
|
5 |
|
5 |
|
|
5 |
5 |
|
5 |
|
|
|
|
|
|||||||||
32. |
1 |
|
2 |
|
|
7 |
|
11 |
|
|
13 |
|
29 |
|
|
|
|
|||||||
|
|
|
|
|
|
|
|
|
|
|
|
|
|
|
|
|
|
|
|
|
|
|
|
|
9 |
|
9 |
|
|
9 |
|
9 |
|
|
9 |
|
9 |
|
|
|
|
618 |
Chapter 7 Graphs and Statistics |
Find the mode (if any) of each set of values. See Example 7.
33. |
3 |
|
5 |
7 |
3 |
|
5 |
|
4 |
6 |
|
7 |
2 |
|
3 |
1 |
4 |
||||||
34. |
12 |
12 |
|
17 |
|
17 |
12 |
13 |
17 |
|
12 |
|
|
||||||||||
35. |
6 |
|
|
7 |
6 |
4 |
3 |
6 |
|
7 |
|
||||||||||||
36. |
0 |
|
3 |
0 |
2 |
|
7 |
|
0 |
6 |
|
0 |
3 |
|
4 |
2 |
0 |
||||||
37. |
23.1 |
22.7 |
23.5 |
22.7 |
|
34.2 |
|
22.7 |
|
||||||||||||||
38. |
21.6 |
19.3 |
1.3 |
19.3 |
|
1.6 |
|
9.3 |
2.6 |
|
|||||||||||||
39. |
1 |
|
|
1 |
|
1 |
|
2 |
|
1 |
2 |
|
1 |
|
|
1 |
|
|
5 |
|
1 |
|
|
2 |
|
3 |
3 |
|
2 |
5 |
|
2 |
|
|
3 |
|
|
||||||||||
40. |
5 |
|
9 |
12 |
|
35 |
37 |
45 |
|
60 |
|
|
|
|
|
|
|
APPLICATIONS
41.SEMESTER GRADES Frank’s algebra grade is based on the average of four exams, which count equally. His grades are 75, 80, 90, and 85.
a.Find his average exam score.
b.If Frank’s professor decided to count the fourth exam double, what would Frank’s average be?
42.HURRICANES The table lists the number of major hurricanes to strike the mainland of the United States by decade. Find the average number per decade.
Round to the nearest one.
Decade |
Number |
Decade |
Number |
|
|
|
|
1901–1910 |
4 |
1951–1960 |
8 |
1911–1920 |
7 |
1961–1970 |
6 |
1921–1930 |
5 |
1971–1980 |
4 |
1931–1940 |
8 |
1981–1990 |
5 |
1941–1950 |
10 |
1991–2000 |
5 |
|
|
|
|
Source: National Hurricane Center
43.FLEET MILEAGE An insurance company’s sales force uses 37 cars. Last June, those cars logged a total of 98,790 miles.
a.On average, how many miles did each car travel that month?
b.Find the average number of miles driven daily for each car.
44.BUDGETS The Hinrichs family spent $519 on groceries last April.
a.On average, how much did they spend on groceries each day?
b.The Hinrichs family has five members. What is the average spent for groceries for one family member for one day?
45.CASH AWARDS A contest is to be part of a promotional kickoff for a new children’s cereal. The prizes to be awarded are shown.
a.How much money will be awarded in the promotion?
b.How many cash prizes will be awarded?
c.What is the average cash prize?
Coloring Contest
Grand prize: Disney World vacation plus $2,500
Four 1st place prizes of $500
Thirty-five 2nd place prizes of $150
Eighty-five 3rd place prizes of $25
46.SURVEYS Some students were asked to rate their college cafeteria food on a scale from 1 to 5. The responses are shown on the tally sheet. Find the average rating.
Poor |
|
Fair |
|
Excellent |
1 |
2 |
3 |
4 |
5 |
|
|
|
|
|
|
|
|
|
|
47.CANDY BARS The prices (in cents) of the different types of candy bars sold in a drug store are: 50, 60, 50, 50, 70, 75, 50, 45, 50, 50, 60, 75, 60, 75, 100, 50, 80, 75, 100, 75.
a.Find the mean price of a candy bar.
b.Find the median price for a candy bar.
c.Find the mode of the prices of the candy bars.
48.COMPUTER SUPPLIES Several computer stores reported differing prices for toner cartridges for a laser printer (in dollars): 51, 55, 73, 75, 72, 70, 53, 59, 75.
a.Find the mean price of a toner cartridge.
b.Find the median price for a toner cartridge.
c.Find the mode of the prices for a toner cartridge.
49.TEMPERATURE CHANGES Temperatures were recorded at hourly intervals and listed in the table below. Find the average temperature of the period from midnight to 11:00 A.M.
Time |
Temperature |
Time |
Temperature |
|
|
|
|
12:00 A.M. |
53 |
12:00 noon |
71 |
1:00 |
54 |
1:00 P.M. |
73 |
2:00 |
57 |
2:00 |
76 |
3:00 |
58 |
3:00 |
77 |
4:00 |
59 |
4:00 |
78 |
5:00 |
59 |
5:00 |
71 |
6:00 |
61 |
6:00 |
70 |
7:00 |
62 |
7:00 |
64 |
8:00 |
64 |
8:00 |
61 |
9:00 |
66 |
9:00 |
59 |
10:00 |
68 |
10:00 |
53 |
11:00 |
71 |
11:00 |
51 |
|
|
|
|
50.AVERAGE TEMPERATURES Find the average temperature for the 24-hour period shown in the table in Exercise 49.
For Exercises 51–54, find the semester grade point average for a student that received the following grades. Round to the nearest hundredth, when necessary.
51. |
Course |
Grade |
Credits |
|
|
|
|
|
MATH 210 |
C |
5 |
|
ACCOUNTING 175 |
A |
3 |
|
HEALTH 090 |
B |
1 |
|
JAPANESE 010 |
D |
4 |
|
|
|
|
52. |
Course |
Grade |
Credits |
|
|
|
|
|
NURSING 101 |
D |
3 |
|
READING 150 |
B |
4 |
|
PAINTING 175 |
A |
2 |
|
LATINO STUDIES 090 |
C |
3 |
|
|
|
|
53. |
Course |
Grade |
Credits |
|
|
|
|
|
PHOTOGRAPHY |
D |
3 |
|
MATH 020 |
B |
4 |
|
CERAMICS 175 |
A |
1 |
|
ELECTRONICS 090 |
C |
3 |
|
SPANISH 130 |
B |
5 |
|
|
|
|
|
7.2 Mean, Median, and Mode |
619 |
|||
|
|
|
|
||
54. |
Course |
Grade |
Credits |
|
|
|
|
|
|
|
|
|
ANTROPOLOGY 050 |
D |
3 |
|
|
|
STATISTICS 100 |
A |
4 |
|
|
|
ASTRONOMY 100 |
C |
1 |
|
|
|
FORESTRY 130 |
B |
5 |
|
|
|
CHOIR 130 |
C |
1 |
|
|
|
|
|
|
|
|
55.EXAM AVERAGES Roberto received the same score on each of five exams, and his mean score is 85. Find his median score and the mode of his scores.
56.EXAM SCORES The scores on the first exam of the students in a history class were 57, 59, 61, 63, 63, 63, 87, 89, 95, 99, and 100. Kia got a score of 70 and claims that “70 is better than average.” Which of the three measures of central tendency is she better than: the mean, the median, or the mode?
57.COMPARING GRADES A student received scores of 37, 53, and 78 on three quizzes. His sister received scores of 53, 57, and 58. Who had the better average? Whose grades were more consistent?
58.What is the average of all of the integers from 100 to 100, inclusive?
59.OCTUPLETS In December 1998, Nkem Chukwu gave birth to eight babies in Texas Children’s Hospital. Find the mean and the median of their birth weights listed below.
Ebuka (girl) |
24 oz |
Odera (girl) |
11.2 oz |
Chidi (girl) |
27 oz |
Ikem (boy) |
17.5 oz |
Echerem (girl) |
28 oz |
Jioke (boy) |
28.5 oz |
Chima (girl) |
26 oz |
Gorom (girl) |
18 oz |
|
|
|
|
60.COMPARISON SHOPPING A survey of grocery stores found the price of a 15-ounce box of Cheerios cereal ranging from $3.89 to $4.39, as shown below. What are the mean, median, and mode of the prices listed?
$4.29 $3.89 $4.29 $4.09 $4.24 $3.99
$3.98 $4.19 $4.19 $4.39 $3.97 $4.29
620Chapter 7 Graphs and Statistics
61.EARTHQUAKES The magnitudes of 2008’s major earthquakes are listed below. Find the mean (round to the nearest tenth) and the median.
Date |
Location |
Magnitude |
|
|
|
Jan. 5 |
Queen Charlotte |
6.6 |
|
Islands Region |
|
Jan. 10 |
Off the coast of |
6.4 |
|
Oregon |
|
Feb. 20 |
Simeulue, Indonesia |
7.4 |
Feb. 24 |
Nevada |
6.0 |
Feb. 25 |
Kepulauan Mentawai |
7.0 |
|
Region, Indonesia |
|
March 21 |
Xinjiang-Xizang |
7.2 |
|
Border Region |
|
April 9 |
Loyalty Islands |
7.3 |
May 12 |
China |
7.9 |
June 13 |
Eastern Honshu, |
6.9 |
|
Japan |
|
July 19 |
Honshu, Japan |
7.0 |
Oct. 6 |
Kyrgyzstan |
6.6 |
Oct. 11 |
Russia |
6.3 |
Oct. 29 |
Pakistan |
6.4 |
Nov. 16 |
Indonesia |
7.3 |
Dec. 20 |
Japan |
6.3 |
|
|
|
Source: Incorporated Research Institutions for Seismology
62.FUEL EFFICIENCY The ten most fuel-efficient cars in 2009, based on manufacturer’s estimated city and highway average miles per gallon (mpg), are shown in the table below.
a.Find the mean, median, and mode of the city mileage.
b.Find the mean, median, and mode of the highway mileage.
Model |
mpg city/hwy |
|
|
Toyota Prius |
50/49 |
Honda Civic Hybrid |
40/45 |
Honda Insight |
40/43 |
Ford Fusion Hybrid |
41/36 |
Mercury Milan Hybrid |
41/36 |
VW Jetta TDI |
30/41 |
Nissan Altima Hybrid |
35/33 |
Toyota Camry Hybrid |
33/34 |
Toyota Yaris |
29/36 |
Toyota Corolla |
26/35 |
|
|
Source: edmonds.com
63.SPORT FISHING The report shown below lists the fishing conditions at Pyramid Lake for a Saturday in January. Find the median and the mode of the weights of the striped bass caught at the lake.
Pyramid Lake—Some striped bass are biting but are on the small side. Striking jigs and plastic worms. Water is cold: 38°. Weights
of fish caught (lb): 6, 9, 4, 7, 4, 3, 3, 5, 6, 9, 4, 5, 8, 13, 4, 5, 4, 6, 9
64.NUTRITION Refer to the table below.
a.Find the mean number of calories in one serving of the meats shown.
b.Find the median.
c.Find the mode.
NUTRITIONAL COMPARISONS
Per 3.5 oz. serving of cooked meat
Species |
Calories |
|
|
Bison |
143 |
Beef (Choice) |
283 |
Beef (Select) |
201 |
Pork |
212 |
Chicken (Skinless) |
190 |
Sockeye Salmon |
216 |
|
|
Source: The National Bison Association
WRITING
65.Explain how to find the mean, the median, and the mode of a set of values.
66.The mean, median, and mode are used to measure the central tendency of a set of values. What is meant by central tendency?
67.Which measure of central tendency, mean, median, or mode, do you think is the best for describing the salaries at a large company? Explain your reasoning.
68.When is the mode a better measure of central tendency than the mean or the median? Give an example and explain why.
REVIEW
Translate to a percent equation (or percent proportion) and then solve to find the unknown number.
69.52 is what percent of 80?
70.What percent of 50 is 56?
71.6623% of what number is 28?
72.56.2 is 16 13% of what number?
73.5 is what percent of 8?
74.What number is 52% of 350?
75.Find 7 14% of 600.
76.12% of what number is 5,000?
Chapter 7 Summary and Review
STUDY SKILLS CHECKLIST
Know the Definitions
Before taking the test on Chapter 7, make sure that you have memorized the definitions of mean, median, and mode. Put a checkmark in the box if you can answer “yes” to the statement.
□I know that the mean of a set of values is often referred to as the average.
□I know that the mean of a set of values is given by the formula:
sum of the values Mean number of values
□I know that the median of a set of values is the middle value when they are arranged in increasing order.
□I know how to find the median of a set of values if there is an odd number of values.
2 4 5 8 10 13 14
Median Middle value
□I know how to find the median of a set of values if there is an even number of values.
2 |
4 |
5 |
8 |
10 |
13 |
14 |
16 |
8 values |
|
|
|
⎬ ⎭ |
|
|
|
|
|
|
Median 8 10 |
9 |
|
|
|
|||
|
|
|
|
2 |
|
|
|
|
□I know that the mode of a set of values is the value that occurs most often.
□I know that a set of values may have one mode, or more than one mode.
2 |
8 |
5 |
8 |
10 |
8 14 |
mode: 8 |
2 |
8 |
5 |
8 |
2 8 |
2 |
two modes: 2, 8 |
C H A P T E R 7 SUMMARY AND REVIEW
S E C T I O N 7.1 Reading Graphs and Tables
DEFINITIONS AND CONCEPTS
To read a table and locate a specific fact in it, we find the intersection of the correct row and column that contains the desired information.
EXAMPLES
SALARY SCHEDULES Find the annual salary for a teacher with a master’s degree plus 15 additional units of study who is beginning her 4th year of teaching.
Teacher Salary Schedule
|
Step |
BA |
BA+15 |
BA+30 |
BA+45 |
MA |
MA+15 |
MA+30 |
|
|
|
|
|
|
|
|
|
|
|
1 |
37,295 |
38,362 |
39,416 |
40,480 |
41,556 |
42,612 |
43,669 |
|
|
|
|
|
|
|
|
|
|
|
|
2 |
38,504 |
39,581 |
40,652 |
41,728 |
42,812 |
43,879 |
44,952 |
|
|
|
|
|
|
|
|
|
|
|
|
3 |
39,716 |
40,802 |
41,885 |
42,973 |
44,066 |
45,147 |
46,234 |
|
|
|
|
|
|
|
|
|
|
|
|
|
4 |
40,926 |
42,021 |
43,120 |
44,220 |
45,321 |
46,417 |
47,514 |
|
|
5 |
42,135 |
43,240 |
44,356 |
45,465 |
46,577 |
47,682 |
48,795 |
|
|
|
|
|
|
|
|
|
|
|
6 |
44,458 |
45,567 |
46,683 |
47,782 |
48,897 |
50,010 |
51,113 |
|
|
|
|
|
|
|
|
|
|
|
|
7 |
46,780 |
47,891 |
49,003 |
50,115 |
51,226 |
52,330 |
53,438 |
|
|
|
|
|
|
|
|
|
|
|
|
The annual salary is $46,417. It can be found by looking on the fourth row (labeled Step 4) in the 6th column (labeled MA + 15).
622 |
Chapter 7 Summary and Review |
|
|
|
|
|
|
|
A bar graph presents data using vertical or |
CANCER DEATHS Refer to the bar graph below. How many more |
|
horizontal bars. A horizontal axis and vertical |
deaths were caused by lung cancer than by colon cancer in the United |
|
axis serve to frame the graph and they are |
States in 2007? |
|
scaled in units such as years, dollars, minutes, |
|
U.S. Cancer Deaths, 2007 |
pounds, and percent. |
|
|
|
200,000 |
|
|
deathsof |
|
|
150,000 |
|
|
|
|
|
Number |
100,000 |
|
50,000 |
|
|
|
|
|
|
0 Colon Breast Prostate Liver Kidney Lung |
|
|
Source: Lung Cancer Alliance |
|
From the graph, we see that there were about 160,000 deaths caused by |
|
|
lung cancer and about 50,000 deaths from colon cancer. To find the |
|
|
difference, we subtract: |
|
|
160,000 – 50,000 = 110,000 |
|
There were about 110,000 more deaths caused by lung cancer than |
|||||||||||||||||||||||
|
deaths caused by colon cancer in the United States in 2007. |
|||||||||||||||||||||||
|
|
|||||||||||||||||||||||
To compare sets of related data, groups of two |
SEAT BELTS Refer to the double-bar graph below. How did the |
|||||||||||||||||||||||
(or three) bars can be shown. For double-bar or |
percent of male high school students that rarely or never wore seat |
|||||||||||||||||||||||
triple-bar graphs, a key is used to explain the |
belts change from 2001 to 2007? |
|
|
|
|
|
|
|
|
|
|
|
|
|
||||||||||
meaning of each type of bar in a group. |
|
|
Risk Behaviors in High School Students |
|||||||||||||||||||||
|
|
|
||||||||||||||||||||||
|
2001 |
|
|
|
|
|
|
|
|
|
|
|
|
|
|
|
|
|
|
|
|
|
|
|
|
|
|
|
|
|
|
|
|
|
|
|
|
|
|
|
|
|
|
|
|
|
|
|
|
|
|
|
|
|
|
|
|
|
|
|
|
|
|
|
|
|
|
|
|
|
|
|
|
|
|
|
|
|
|
|
|
|
|
|
|
|
|
|
|
|
|
|
|
|
|
|
|
|
|
|
Year |
|
|
|
|
|
|
|
|
|
|
|
|
|
|
|
|
|
|
|
|
|
Male |
|
|
|
|
|
|
|
|
|
|
|
|
|
|
|
|
|
|
|
|
|
|
|
|||
|
2007 |
|
|
|
|
|
|
|
|
|
|
|
|
|
|
|
|
|
|
|
|
|
||
|
|
|
|
|
|
|
|
|
|
|
|
|
|
|
|
|
|
|
|
|
|
Female |
||
|
|
|
|
|
|
|
|
|
|
|
|
|
|
|
|
|
|
|
|
|
|
|
||
|
|
|
|
|
|
|
|
|
|
|
|
|
|
|
|
|
|
|
|
|
|
|
|
|
|
|
|
|
|
|
|
|
|
|
|
|
|
|
|
|
|
|
|
|
|
|
|
|
|
|
4% |
|
8% |
|
12% |
16% |
|
20% |
|
|||||||||||||||
|
|
Percent that rarely or never wear seat belts |
||||||||||||||||||||||
|
Source: The World Almanac, 2003, 2009 |
|
|
|
|
|
|
|
|
|
||||||||||||||
|
From the graph, we see that in 2001 about 18% of male high school |
|||||||||||||||||||||||
|
students rarely or never wore seat belts. By 2007, the percent was about |
|||||||||||||||||||||||
|
14%, a decrease of 18% 14%, or 4%. |
|
|
|
|
|
|
|
|
|
||||||||||||||
|
|
|||||||||||||||||||||||
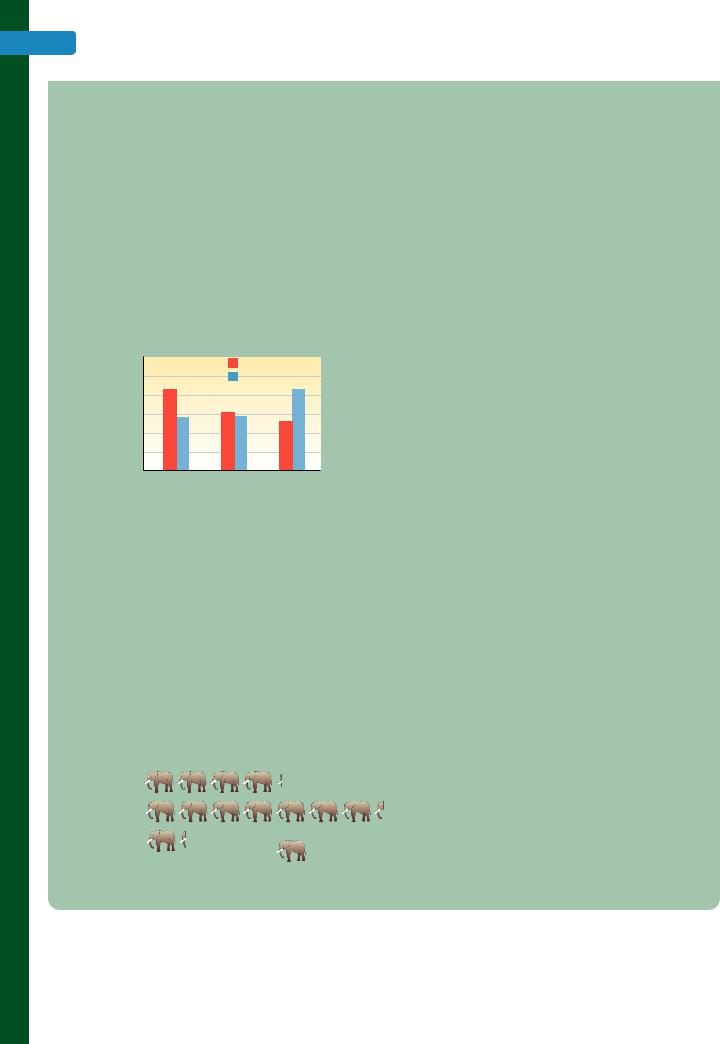
A pictograph is like a bar graph, but the bars |
MEDICAL SCHOOLS Refer to the pictograph below. In 2008, how |
|||||||||||||||||||||||
are made from pictures or symbols. A key tells |
many students were enrolled in California medical schools? |
|||||||||||||||||||||||
the meaning (or value) of each symbol. |
|
|
Total Medical School Enrollment |
|
|
|
|
|||||||||||||||||
|
|
|
|
|
|
|
||||||||||||||||||
|
|
|
|
|
|
|
|
by State, 2008 |
|
|
|
|
|
|
|
|
|
California
Missouri
Virginia
= 1,000 medical students
|
|
|
|
|
|
|
|
|
|
Chapter 7 |
Summary and Review |
623 |
|||||
|
|
|
|
|
|
|
|
|
|
|
|
|
|
|
|
||
|
|
|
|
|
|
|
|
|
|
|
|
|
|
|
|
||
|
The California row contains 4 complete symbols and almost all of |
|
|
||||||||||||||
|
another.This means that there were 4 1,000, or 4,000 medical students, |
|
|
||||||||||||||
|
plus approximately 900 more. In 2008, about 4,900 students were |
|
|
||||||||||||||
|
enrolled in California medical schools. |
|
|
|
|
|
|
||||||||||
|
|
|
|
|
|
|
|
|
|
||||||||
In a circle graph, regions called sectors (they |
CHECKING |
E-MAIL The |
circle |
|
|
|
4 or 5 |
|
|
||||||||
look like slices of pizza) are used to show what |
graph to the right shows the results of |
|
|
|
5% |
|
|
||||||||||
part of the whole each quantity represents. |
a survey of adults who were asked |
|
One |
6 or more |
|
|
|||||||||||
|
5% |
|
|
||||||||||||||
|
how many personal e-mail addresses |
|
|
|
|||||||||||||
|
|
address |
|
|
|||||||||||||
|
they regularly check. What percent of |
|
|
|
|||||||||||||
|
42% |
|
|
||||||||||||||
|
the adults surveyed check 4 or more |
|
|
|
2 or 3 |
|
|
||||||||||
|
|
|
|
|
|
||||||||||||
|
e-mail addresses regularly? |
|
|
|
|
|
|
|
|
||||||||
|
|
|
|
|
|
|
addresses |
|
|
||||||||
|
|
|
|
|
|
|
|
|
|
|
|
|
|
|
48% |
|
|
|
|
|
|
|
|
|
|
|
|
|
|
|
Source: Ipsos for Habeas |
|
|
||
|
We add the percent of the responses for 4 or 5 e-mail addresses and the |
|
|
||||||||||||||
|
percent of the responses for 6 or more e-mail addresses: |
|
|
||||||||||||||
|
5% + 5% = 10% |
|
|
|
|
|
|
|
|
|
|
|
|
||||
|
|
Thus, 10% of the adults surveyed check 4 or more e-mail addresses |
|
|
|||||||||||||
|
regularly. |
|
|
|
|
|
|
|
|
|
|
|
|
|
|
||
|
Use the survey results to predict the number of adults in a group of |
|
|
||||||||||||||
|
5,000 that would check only one e-mail address regularly. |
|
|
||||||||||||||
|
In the survey, 42% said they check only one e-mail address. We need to |
|
|
||||||||||||||
|
find: |
|
|
|
|
|
|
|
|
|
|
|
|
|
|
||
|
|
|
|
|
|
|
|
|
|
|
|
|
|
|
|
|
|
|
|
What |
|
|
|
|
|
|
|
|
|
|
|
|
|
|
|
|
|
number |
|
is |
|
|
|
of |
|
|
|
|
|
|
|||
|
|
42% |
5,000? |
|
|
|
|
||||||||||
|
|
|
|
|
|
|
|
|
|
|
|
|
|
|
|
|
|
|
|
x |
|
|
42% |
|
|
5,000 |
|
Translate. |
|
|
|||||
|
|
|
x 0.42 5,000 |
|
|
|
|
|
|
Write 42% as a decimal. |
|
|
|||||
|
|
|
x 2,100 |
|
|
|
|
|
|
Do the multiplication. |
|
|
|||||
|
According to the survey, about 2,100 of the 5,000 adults would check |
|
|
||||||||||||||
|
only one e-mail address regularly. |
|
|
|
|
|
|
||||||||||
|
|
|
|
||||||||||||||
A line graph is used to show how quantities |
SNOWBOARDING The line graph below shows the number of |
|
|
||||||||||||||
change with time. From such a graph, we can |
people who participated in snowboarding in the United States for the |
|
|
||||||||||||||
determine when a quantity is increasing and |
years 2000–2007. |
|
|
|
|
|
|
|
|
|
|
|
|
||||
when it is decreasing. |
|
|
|
|
|
|
Number of people who participated |
|
|
||||||||
|
|
|
|
|
|
|
|
|
in snowboarding in the U.S.
|
7.0 |
|
|
|
|
|
|
|
|
6.0 |
|
|
|
|
|
|
|
|
5.0 |
|
|
|
|
|
|
|
Millions |
4.0 |
|
|
|
|
|
|
|
3.0 |
|
|
|
|
|
|
|
|
|
|
|
|
|
|
|
|
|
|
2.0 |
|
|
|
|
|
|
|
|
1.0 |
|
|
|
|
|
|
|
|
2000 |
2001 |
2002 |
2003 |
2004 |
2005 |
2006 |
2007 |
|
|
|
|
Year |
|
|
|
Source: National Ski & Snowboard Retailers Association
624 |
Chapter 7 Summary and Review |
|
|
|
|
|
|
|
When did the popularity of snowboarding seem to peak?
The years with the highest participation were 2003 and 2004.
Between which two years was there the greatest decrease in the number of snowboarding participants?
The line segment with the greatest “fall” as we read left to right is the segment connecting the data points for the years 2005 and 2006. Thus, the greatest decrease in the number of snowboarding participants occurred between 2005 and 2006.
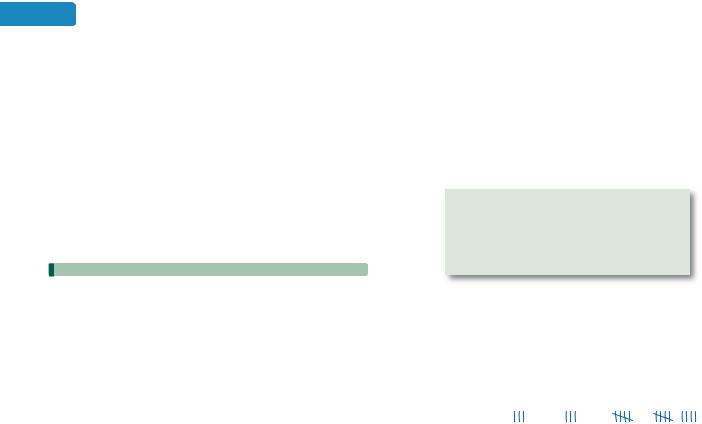
Two quantities that are changing with time can |
SKATEBOARDING Refer to the line graphs below that show the |
|||||||||||
be compared by drawing both lines on the same |
results of a skateboarding race. |
|
|
|
|
|
|
|
|
|||
graph. |
|
|
|
|
|
|
|
|
|
|
|
|
|
Finish |
|
|
|
|
|
|
|
|
|
||
|
traveled |
|
|
|
|
|
|
|
|
|
||
|
Distance |
|
|
|
|
|
|
Skateboarder 1 |
||||
|
|
|
|
|
|
|
|
|
|
|||
|
Start |
|
|
|
|
|
|
|
|
Skateboarder 2 |
||
|
|
|
|
|
|
|
|
|
||||
|
|
|
|
|
|
|
|
|
|
|
|
|
|
|
|
|
|
|
|
|
|
|
|||
|
A |
B C D |
||||||||||
|
|
Observations:
•Since the red graph is well above the blue graph at time A, skateboarder 1 was well ahead of skateboarder 2 at that stage of the race.
•Since the red graph is horizontal from time A to time B, skateboarder 1 had stopped.
•Since the blue graph crosses the red graph at time B, at that instant, the skateboarders are tied for the lead.
•Since the blue graph crosses the dashed finish line at time C, which is sooner than time D, skateboarder 2 won the race.
A histogram is a bar graph with these features: |
SLEEP A group of parents of |
|
|
|
|
|
|
||||||
1. |
The bars of the histogram touch. |
junior |
high |
students |
|
were |
|
120 |
|
|
|
|
|
surveyed and asked to estimate |
|
100 |
|
|
93 |
|
|||||||
2. |
Data values never fall at the edge of a |
Frequency |
|
42 |
|
||||||||
the number of hours that their |
80 |
|
|
|
|||||||||
|
|
|
|
|
|||||||||
|
bar. |
|
|
|
|
|
|||||||
|
children |
slept |
each night. The |
|
60 |
|
|
|
50 |
||||
|
|
|
|
|
|
||||||||
3. |
The widths of the bars are equal and |
results |
are |
displayed |
in |
the |
|
|
|
|
|||
|
40 |
|
|
|
|
||||||||
|
represent a range of values. |
histogram |
to |
the right. How |
|
|
|
|
|
||||
|
|
20 |
15 |
|
|
|
|||||||
|
|
many children sleep 6 to 9 hours |
|
|
|
|
|||||||
|
|
|
|
|
|
|
|||||||
|
|
|
|
|
|
|
|
||||||
|
|
a night? |
|
|
|
|
|
|
3.5 |
5.5 |
7.5 |
9.5 |
11.5 |
|
|
|
|
|
|
|
|
|
|
Hours of sleep |
|
||
|
|
The bar with edges 5.5 and 7.5 corresponds to the 6 to 7 hour range.The |
|||||||||||
|
|
height of that bar indicates that 42 children sleep 6 to 7 hours. The bar |
|||||||||||
|
|
with edges 7.5 and 9.5 corresponds to the 8 to 9 hour range. The height |
|||||||||||
|
|
of that bar indicates that 93 children sleep 8 to 9 hours. The total |
|||||||||||
|
|
number of children sleeping 6 to 9 hours is found using addition: |
|||||||||||
|
|
42 + 93 = 135 |
|
|
|
|
|
|
|
|
|||
|
|
135 of the junior high children sleep 6 to 9 hours a night. |
|
|
A frequency polygon is a special line graph formed from a histogram by joining the center points at the top of each bar. On the horizontal axis, we write the coordinate of the middle value of each class interval. Then we erase the bars.
Chapter 7 Summary and Review |
625 |
Frequency polygon
|
120 |
|
Frequency |
100 |
|
80 |
||
|
60
40
20
4.5 6.5 8.5 10.5
Hours of sleep
REVIEW EXERCISES
Refer to the table below to answer the following questions.
1.WINDCHILL TEMPERATURES
a.Find the windchill temperature on a 10°F day when a 15-mph wind is blowing.
b.Find the windchill temperature on a –15°F day when a 30-mph wind is blowing.
2.WIND SPEEDS
a.The windchill temperature is 25°F, and the actual outdoor temperature is 15°F. How fast is the wind blowing?
b.The windchill temperature is 38°F, and the actual outdoor temperature is –5°F. How fast is the wind blowing?
Determining the Windchill Temperature
Wind |
|
|
Actual temperature |
|
|
|||
|
|
|
|
|
|
|
|
|
speed |
20°F |
15°F |
10°F |
5°F |
0°F |
–5°F |
–10°F |
–15°F |
|
|
|
|
|
|
|
|
|
5 mph |
16° |
12° |
7° |
0° |
5° |
10° |
15° |
21° |
10 mph |
3° |
3° |
9° |
15° |
22° |
27° |
34° |
40° |
15 mph |
5° |
11° |
18° |
25° |
31° |
38° |
45° |
51° |
20 mph |
10° |
17° |
24° |
31° |
39° |
46° |
53° |
60° |
25 mph |
15° |
22° |
29° |
36° |
44° |
51° |
59° |
66° |
30 mph |
18° |
25° |
33° |
41° |
49° |
56° |
64° |
71° |
35 mph |
20° |
27° |
35° |
43° |
52° |
58° |
67° |
74° |
|
|
|
|
|
|
|
|
|
As of 2008,the United States had the most nuclear power plants in operation worldwide, with 104. The following bar graph shows the remainder of the top ten countries and the number of nuclear power plants they have in operation.
3.How many nuclear power plants does Korea have in operation?
4.How many nuclear power plants does France have in operation?
5.Which countries have the same number of nuclear power plants in operation? How many?
6.How many more nuclear power plants in operation does Japan have than Canada?
Number of Nuclear Power Plants in Operation
France |
|
|
|
|
|
|
Japan |
|
|
|
|
|
|
Russian Federation |
|
|
|
|
|
|
Republic of Korea |
|
|
|
|
|
|
United Kingdom |
|
|
|
|
|
|
Canada |
|
|
|
|
|
|
Germany |
|
|
|
|
|
|
India |
|
|
|
|
|
|
Ukraine |
|
|
|
|
|
|
0 |
10 |
20 |
30 |
40 |
50 |
60 |
Source: International Atomic Energy Agency
626 |
Chapter 7 Summary and Review |
In a workplace survey, employed adults were asked if they would date a co-worker. The results of the survey are shown below. Use the double-bar graph to answer the following questions.
7.What percent of the women said they would not date a co-worker?
8.Did more men or women say that they would date a co-worker? What percent more?
9.When asked, were more men or more women unsure if they would date a co-worker?
10.Which of the three responses to the survey was given by approximately the same percent of men and women?
Responses to the Survey:
Would you date a co-worker?
60% |
|
|
Men |
|
|
|
43% |
|
43% |
||
50% |
|
Women |
|||
40% |
31% |
|
|||
28% |
29% |
26% |
|||
30% |
|||||
20% |
|
|
|
|
|
10% |
|
|
|
|
|
|
Yes |
No |
Not sure |
Source: Spherion Workplace Survey
Refer to the pictograph below to answer the following questions.
11.How many animals are there at the San Diego Zoo?
12.Which of the zoos listed has the most animals? How many?
13.How many animals would have to be added to the Phoenix Zoo for it to have the same number as the San Diego Zoo?
14.Find the total number of animals in all three zoos.
America’s Best Zoos
Number of Animals
San Diego Zoo
Columbus Zoo, Ohio
Phoenix Zoo
= 1,000 animals
Refer to the circle graph below to answer the following questions.
15.What element makes up the largest percent of the body weight of a human?
16.Elements other than oxygen, carbon, hydrogen, and nitrogen account for what percent of the weight of a human body?
17.Hydrogen accounts for how much of the body weight of a 135-pound woman?
18.Oxygen and carbon account for how much of the body weight of a 200-pound man?
Elements in the Human Body
(by weight)
3% |
|
Nitrogen |
Other elements |
10% |
|
Hydrogen |
|
18% |
|
Carbon |
65% |
|
|
|
Oxygen |
Source: General Chemistry Online
Refer to the line graph on the next page to answer the following questions.
19.How many eggs were produced in Nebraska in 2001?
20.How many eggs were produced in North Carolina in 2008?
21.In what year was the egg production of Nebraska equal to that of North Carolina? How many eggs?
22.What was the total egg production of Nebraska and North Carolina in 2005?
23.Between what two years did the egg production in North Carolina increase dramatically?
24.Between what two years did the egg production in Nebraska decrease dramatically?
25.How many more eggs did North Carolina produce in 2008 compared to Nebraska?
Source: USA Travel Guide
26.How many more eggs did Nebraska produce in 2000 compared to North Carolina?
Total Egg Production
|
3,300 |
North Carolina |
|
Nebraska |
|
|
|
|
|
3,200 |
|
|
3,100 |
|
eggs |
3,000 |
|
|
|
|
Million |
2,900 |
|
2,800 |
|
|
|
|
|
|
2,700 |
|
|
2,600 |
|
|
2,500 |
|
|
|
2000 2001 2002 2003 2004 2005 2006 2007 2008 |
|
|
Year |
Source: U.S. Department of Agriculture
A survey of the weekly television viewing habits of 320 households produced the histogram in the next column.Use the graph to answer the following questions.
27.How many households watch between 1 and 5 hours of TV each week?
28.How many households watch between 6 and 15 hours of TV each week?
Chapter 7 Summary and Review |
627 |
29.How many households watch 11 hours or more each week?
Survey of Hours of TV Watched Weekly
|
110 |
|
|
|
|
|
|
90 |
|
|
|
|
|
Frequency |
70 |
|
|
|
|
|
50 |
|
|
|
|
|
|
30 |
|
|
|
|
|
|
|
|
|
|
|
|
|
|
10 |
|
|
|
|
|
|
0.5 |
5.5 |
10.5 |
15.5 |
20.5 |
25.5 |
Hours of TV watched by the household
30.Create a frequency polygon from the histogram shown above.
|
110 |
|
|
90 |
|
Frequency |
70 |
|
50 |
||
|
||
|
30 |
|
|
10 |
3.0 8.0 13.0 18.0 23.0
Hours of TV watched by the household
S E C T I O N 7.2 Mean, Median, and Mode
|
DEFINITIONS AND CONCEPTS |
EXAMPLES |
|
|
|
|
|
|
|
|
|
|
|||||
|
It is often beneficial to use one number to |
Find the mean of the following set of values: |
|
|
|
||||||||||||
|
represent the “center” of all the numbers in a |
6 |
8 |
3 |
5 |
9 |
8 |
10 |
7 |
8 |
5 |
|
|
|
|||
|
set of data. There are three measures of central |
|
|
|
|||||||||||||
|
|
|
|
|
|
|
|
|
|
|
|
|
|
|
|||
|
tendency: mean, median, mode. |
To find the mean, we divide the sum of the values by the number of |
|||||||||||||||
|
The mean of a set of values is given by the |
values, which is 10. |
|
|
|
|
|
|
|
|
|||||||
|
|
|
|
|
|
|
|
|
|
|
|
|
|
|
|||
|
formula |
6 8 3 5 9 8 10 7 8 5 |
69 |
|
|||||||||||||
|
Mean |
sum of the values |
|
|
|
|
|
|
|
10 |
|
|
|
|
10 |
|
|
|
number of values |
|
|
|
|
|
|
|
|
|
|
|
|
6.9 |
|||
|
|
|
|
Thus, 6.9 is the mean. |
|
|
|
|
|
|
|
|
|||||
|
|
|
|
|
|
|
|
|
|
|
|
|
|
|
|
|
|
|
|
|
|
|
|
|
|
|
|
|
|
|
|
|
|
|
|
628 |
Chapter 7 Summary and Review |
|
|
|
|
|
|
|
When a value in a set appears more than once, that value has a greater “influence” on the mean than another value that only occurs a single time. To simplify the process of finding the mean, any value that appears more than once can be “weighted” by multiplying it by the number of times it occurs.
To find the weighted mean of a set of values:
1.Multiply each value by the number of times it occurs.
2.Find the sum of the products from step 1.
3.Divide the sum from step 2 by the total number of individual values.
A student’s grade point average (GPA) can be found using a weighted mean.
Some schools assign a certain number of credit hours to a course while others assign a certain number of units.
To find the median of a set of values:
1.Arrange the values in increasing order.
2.If there is an odd number of values, the median is the middle value.
3.If there is an even number of values, the median is the mean (average) of the middle two values.
The mode of a set of values is the single value that occurs most often.
GPAs Find the semester grade point average for a student that received the following grades. (The point values are A = 4, B = 3, C = 2, D = 1, and F = 0.)
Course |
Grade |
Credits |
|
|
|
Algebra |
A |
5 |
History |
C |
3 |
Art |
D |
4 |
|
|
|
Multiply the number of credits for each course by the point value of the grade received. Add the results (as shown in blue) to get the total number of grade points. To find the total number of credits, add as shown in red.
Course |
Grade |
Credits |
Weighted grade points |
||||||
|
|
|
|
|
|
|
|
|
|
Algebra |
A |
|
5 |
|
4 |
5 |
→ |
20 |
|
History |
C |
|
3 |
|
2 |
3 |
→ |
6 |
|
Art |
D |
|
4 |
|
1 |
4 |
→ |
4 |
|
Totals |
|
|
12 |
|
|
|
|
30 |
|
|
|
|
|
|
|
|
|
|
|
To find the GPA, we divide.
GPA |
30 |
|
The total number of grade points |
||||||||||
|
|
|
|
The total number of credits |
|||||||||
12 |
|
||||||||||||
|
|
|
|
||||||||||
|
|
2.5 Do the division. |
|
|
|||||||||
The student’s semester GPA is 2.5. |
|
||||||||||||
To find the median of |
|
|
|
|
|
|
|||||||
6 |
8 |
3 |
5 |
|
9 |
8 |
10 |
7 |
8 |
5 |
|||
arrange them in increasing order: |
|
||||||||||||
Smallest |
|
|
|
|
|
|
|
|
|
|
|
|
Largest |
|
3 |
5 |
5 |
|
6 |
|
|
|
8 |
8 |
9 10 There are 10 values. |
||
|
|
7 |
8 |
|
|||||||||
|
|
|
|
|
|
|
|
|
|
|
|
|
|
Middle two values
Since there are an even number of values, the median is the mean (average) of the two middle values:
7 8 |
|
15 |
7.5 |
|
|
|
|
|||
|
|
2 |
2 |
|
|
|
|
|||
Thus, 7.5 is the median. |
|
|
|
|
||||||
To find the mode of |
|
|
|
|
|
|||||
6 |
8 |
3 |
5 |
9 |
8 |
10 |
7 |
8 |
5 |
we find the value that occurs most often.
6 |
8 |
3 |
5 |
9 |
8 |
10 |
7 |
8 |
5 |
|
|
|
|
|
|
|
|
|
|
3 times
Since 8 occurs the most times, it is the mode.
|
|
|
|
|
|
|
|
|
Chapter 7 Summary and Review |
629 |
||
|
|
|
|
|
|
|
|
|||||
|
|
|
|
|
|
|
|
|||||
When a collection of values has two modes, it is |
The collection of values |
|
|
|
|
|
|
|||||
called bimodal. |
1 |
2 |
3 |
3 |
4 |
5 |
6 |
6 |
7 |
8 |
|
|
|
|
|
||||||||||
|
has two modes: 3 and 6. |
|
|
|
|
|
|
|||||
|
|
|
|
|
|
|
|
|
|
|
|
|
REVIEW EXERCISES
31.GRADES Jose worked hard this semester, earning grades of 87, 92, 97, 100, 100, 98, 90, and 98. If he needs a 95 average to earn an A in the class, did he make it?
32.GRADE SUMMARIES The students in a mathematics class had final averages of 43, 83, 40, 100, 40, 36, 75, 39, and 100. When asked how well her students did, their teacher answered, “43 was typical.” What measure was the teacher using: mean, median, or mode?
33.PRETZEL PACKAGING Samples of SnacPak pretzels were weighed to find out whether the package claim “Net weight 1.2 ounces” was accurate. The tally appears in the table. Find the mode of the weights.
Weights of
SnacPak Pretzels
Ounces Number
0.91
1.06
1.118
1.223
1.32
1.40
34.Find the mean weight of the samples in Exercise 33.
35.BLOOD SAMPLES A medical laboratory technician examined a blood sample under a microscope and measured the sizes (in microns) of the white blood cells. The data are listed below. Find the mean, median, and mode.
7.8 |
6.9 |
7.9 |
6.7 |
6.8 |
8.0 |
7.2 |
6.9 |
7.5 |
36. |
SUMMER READING A paperback version of the |
||||||||||
|
classic Gone With the Wind is 960 pages long. If a |
||||||||||
|
student wants to read the entire book during the |
||||||||||
|
month of June, how many pages must she average |
||||||||||
|
per day? |
|
|
|
|
|
|
|
|
|
|
37. |
WALK-A-THONS Use the data in the table |
|
|
||||||||
|
to find the mean (average) donation to a charity |
||||||||||
|
walk-a-thon. |
|
|
|
|
|
|
|
|
|
|
|
|
|
|
|
|
|
|
|
|
|
|
|
Donation amount |
$5 |
|
$10 |
$20 |
|
$50 |
|
$100 |
||
|
|
|
|
|
|
|
|
|
|
|
|
|
Number received |
20 |
|
65 |
25 |
|
5 |
|
10 |
||
|
|
|
|
|
|
|
|
|
|||
38. |
GPAs Find the semester grade point average for a |
||||||||||
|
student that received the grades shown below. |
|
|
||||||||
|
Round to the nearest hundredth. (Assume the |
||||||||||
|
following standard point values for the letter grades: |
||||||||||
|
A = 4, B = 3, C = 2, D = 1, and F = 0.) |
|
|
|
|
|
|||||
|
|
|
|
|
|
|
|||||
|
|
Course |
Grade |
Credits |
|
|
|||||
|
|
|
|
|
|
|
|
|
|
||
|
|
Chemistry |
|
A |
|
5 |
|
|
|
||
|
|
Sociology |
|
C |
|
3 |
|
|
|
||
|
|
Economics |
|
D |
|
4 |
|
|
|
||
|
|
Archery |
|
A |
|
1 |
|
|
|
||
|
|
|
|
|
|
|
|
|
|
|
|
630 |
|
|
|
|
|
|
|
|
|
C H A P T E R 7 |
|
|
TEST |
|
|||||
Fill in the blanks. |
|
|
|
|
|
||||
1. a. |
A horizontal or vertical line used for reference in |
||||||||
|
a bar graph is called an |
|
. |
||||||
b. |
The |
|
|
(average) of a set of values is the sum |
|||||
|
of the values divided by the number of values in |
||||||||
|
the set. |
|
|
|
|
|
|||
c. |
The |
|
|
|
of a set of values written in |
||||
|
increasing order is the middle value. |
||||||||
d. |
The |
|
|
of a set of values is the single value |
|||||
|
that occurs most often. |
|
|||||||
e. |
The mean, median, and mode are three measures |
||||||||
|
of |
|
|
tendency. |
|
2.WORKOUTS Refer to the table below to answer the following questions.
Number of Calories Burned While Running for One Hour
Running |
|
Body Weight |
|
|
|
|
|
speed (mph) |
130 lb |
155 lb |
190 lb |
|
|
|
|
5 |
472 |
563 |
690 |
6 |
590 |
704 |
863 |
7 |
679 |
809 |
992 |
8 |
797 |
950 |
1,165 |
9 |
885 |
1,056 |
1,294 |
|
|
|
|
Source: nutristrategy.com
a.How many calories will a 155-pound person burn if she runs for one hour at a rate of
5 mph?
b.In one hour, how many more calories will a 190-pound person burn if he runs at a rate of 7 mph instead of 6 mph?
c.At what rate does a 130-pound person have to run for one hour to burn approximately 800 calories?
3.MOVING Refer to the bar graph in the next column to answer the following questions.
a.Which piece of furniture shown in the graph requires the greatest number of feet of bubble wrap? How much?
b.How many more feet of bubble wrap is needed to wrap a desk than a coffee table?
c.How many feet of bubble wrap is needed to cover a bedroom set that has a headboard, a dresser, and two end tables?
Amount of Bubble Wrap Needed to Wrap
Pieces of Furniture When Moving
Bed headboard |
|
|
|
|
|
|
|
Coffee table |
|
|
|
|
|
|
|
Desk |
|
|
|
|
|
|
|
Dresser |
|
|
|
|
|
|
|
End table |
|
|
|
|
|
|
|
Chair (living room) |
|
|
|
|
|
|
|
Love seat |
|
|
|
|
|
|
|
Rocker |
|
|
|
|
|
|
|
20 |
40 |
60 |
80 |
100 |
120 |
140 |
160 |
|
|
Feet of bubble wrap |
|
|
Source: transitsystems.com
4.CANCER SURVIVAL RATES Refer to the graph below to answer the following questions.
a.What was the survival rate (in percent) from breast cancer in 1976?
b.By how many percent did the cancer survival rate for breast cancer increase by 2006?
c.Which type of cancer shown in the graph has the lowest survival rate?
d.Which type of cancer has had the greatest increase in survival rate from 1976 to 2006? How much of an increase?
Five-Year Survival Rates
|
|
99.7% |
|
1976 |
|
100% |
89.1% |
|
2006 |
||
|
|
|
|||
90% |
|
|
|
||
75% |
|
|
|
|
|
80% |
67% |
65.2% |
|
|
|
70% |
|
|
|||
60% |
|
|
50% |
|
|
50% |
|
|
|
|
|
|
|
|
|
|
|
40% |
|
|
|
|
|
30% |
|
|
|
|
15.6% |
20% |
|
|
|
13% |
|
10% |
|
|
|
||
|
|
|
|
|
|
|
Breast |
Prostate |
Colon |
Lung |
Source: SEER Cancer Statistics Review
5.ENERGY DRINKS Refer to the pictograph below to answer the following questions.
Sugar Content in Energy Drinks and Coffee
(12-ounce serving)
Monster Energy Drink
Big Red Energy Drink
Starbucks Tall Caffè Mocha
= 10 grams sugar
Source: energyfiend.com
a.How many grams of sugar are there in 12 ounces of Big Red?
b.For a 12-ounce serving, how many more grams of sugar are there in Monster Energy Drink than in Starbucks Tall Caff´e Mocha?
6.FIRES Refer to the graph below to answer the following questions.
a.In 2007, what percent of the fires in the United States were vehicle fires?
b.In 2007, there were a total of 1,557,500 fires
in the United States. How many were structure fires?
Where Fires Occurred, 2007
Vehicle
fires
Outside fires
Structure 49% fires
34%
Source: U.S. Fire Administration
7.NYPD Refer to the graph in the next column to answer the following questions.
a.How many uniformed police officers did the NYPD have in 1987?
b.When was the number of uniformed police officers the least? How many officers were there at that time?
c.When was the number of uniformed police officers the greatest? How many officers were there at that time?
Chapter 7 Test |
631 |
d.Find the decrease in the number of uniformed police officers from 2000 to 2003.
New York City Police Department
Number of Uniformed Police Officers
|
45 |
|
|
40 |
|
Thousands |
35 |
|
30 |
||
|
||
|
25 |
|
|
20 |
’87 ’90 ’95 ’00 ’05 ’08 Year
Source: New York Times, July 17, 2009
8.BICYCLE RACES Refer to the graph below to answer each of following questions about a two-man bicycle race.
a.Which bicyclist had traveled farther at time A?
b.Explain what was happening in the race at time B.
c.When was the first time that bicyclist 2 stopped to rest?
d.Did bicyclist 2 ever lead the race? If so, at what time?
e.Which bicyclist won the race?
Ten-Mile Bicycle Race
Finish |
|
|
|
traveled |
|
|
|
Distance |
|
|
Bicyclist 1 |
|
|
Bicyclist 2 |
|
Start |
|
|
|
A |
B C |
D |
Time |
632 |
Chapter 7 Test |
9.COMMUTING TIME A school district collected data on the number of minutes it took its employees to drive to work in the morning. The results are presented in the histogram below.
a.How many employees have a commute time that is in the 7-to-10-minute range?
b.How many employees have a commute time that is less than 10 minutes?
c.How many employees have a commute that takes 15 minutes or more each day?
School District Employees’ Commute
|
40 |
|
|
35 |
|
|
|
|
|
|
|
|
|
|
|
Frequency |
30 |
|
|
|
28 |
|
|
|
|
22 |
|
|
20 |
|
|
20 |
|
|
|
|
|
||
|
|
|
|
|
|
||
10 |
8 |
|
|
|
|
9 |
|
|
|
|
|
|
|||
|
|
|
|
|
|
||
|
|
|
|
|
|
|
|
|
2.5 |
6.5 |
10.5 |
14.5 |
18.5 |
22.5 |
26.5 |
Morning commute time (min)
10.VOLUNTEER SERVICE The number of hours served last month by each of the volunteers at a homeless shelter are listed below:
4 6 8 2 8 10 11 9 5 12 5 18 7 5 1 9
a.Find the mean (average) of the hours of volunteer service.
b.Find the median of the hours of volunteer service.
c.Find the mode of the hours of volunteer service.
11.RATING MOVIES Netflicks, a popular online DVD rental system, allows members to rate movies using a 5-star system. The table below shows a tally of the ratings that a group of college students gave a movie. Find the mean (average) rating of the movie.
Number of Stars |
Comments |
Tally |
|
Loved it |
III |
|
Really liked it |
IIII |
|
Liked it |
IIII |
|
Didn’t like it |
IIII I |
|
Hated it |
II |
|
|
|
12.GPAs Find the semester grade point average for a student who received the following grades. Round to the nearest hundredth.
Course |
Grade |
Credits |
|
|
|
WEIGHT TRAINING |
C |
1 |
TRIGONOMETRY |
A |
3 |
GOVERNMENT |
B |
2 |
PHYSICS |
A |
4 |
PHYSICS LAB |
D |
1 |
|
|
|
13.RATINGS The seven top-rated cable television programs for the week of March 30–April 5, 2009, are given below. What are the mean, median, and mode of the viewer data?
Show/day/time/network |
Millions of viewers |
|
|
WCW Raw, Mon. 10 P.M., USA |
5.39 |
WCW Raw, Mon. 9 P.M., USA |
4.99 |
NCIS, Tue. 7 P.M., USA |
4.25 |
NCIS, Wed. 7 P.M., USA |
4.25 |
NCIS, Mon. 7 P.M., USA |
4.04 |
Penguins of Madagascar, |
4.02 |
Sun. 10 A.M., Nickelodeon |
|
The O’Reilly Factor, |
3.93 |
Wed. 8 P.M., Fox |
|
|
|
Source: Bay Ledger News Zone |
|
14.REAL ESTATE In May of 2009, the median sales price of an existing single-family home in the United States was $172,900. Explain what is meant by the median sales price. (Source: National Association of Realtors)