

thin_section_microscopy
.pdfRaith, Raase, Reinhardt – January 2011
Guide to Thin Section Microscopy |
Double refraction |
Sequence of interference colours: As retardation varies, the interference colour changes. The colour spectrum starts with black (retardation = 0) followed by grey, white, yellow and orange to intensive colours of red, blue, green, yellow orange, red, which repeats itself towards higher retardation while becoming paler (Fig. 4.2.3-7; Michel-Levy colour chart). The full colour sequence is subdivided into orders using the particularly distinct red tones (in steps of 551 nm, respectively).
When using the interference colour for mineral determination, it should be noted that retardation does not only depend on birefringence, but also on the thickness d of the sample (' = d * (nz' - nx')). In order to relate interference colours directly to birefringence of anisotropic minerals, the thickness of the sample must be constant. Thin sections are therefore prepared with a standard thickness of 25 resp. 30 µm.
Determination of birefringence using the interference colour: Birefringence is an important property of anisotropic minerals and is crucial for mineral determination. However, the amount of birefringence of a specific mineral depends on the orientation of the section. In optically uniaxial minerals it varies from zero in the section perpendicular to the optic axis (direction of optical isotropy), to a maximum value (|ne-no|) in sections parallel to the optic axis. In optically biaxial minerals it varies from zero in sections perpendicular to one of the two optic axes, to a maximum value (nz-nx) in the section parallel to the optic plane. For this reason, the grains of each anisotropic mineral show different interference colours in thin section dependent on their crystallographic orientation (Fig. 4.2.3-8). For routine mineral identification, only the maximum birefringence (nz-nx) values are of interest. Therefore, the grains with the highest interference colour must be identified in thin section. With the help of interference colour and thin section thickness (e.g. 25 µm), the birefringence value can be read from the Michel-Levy chart (Fig. 4.2.3-8).
Figure 4.2.3-8: Left: (A) Variation of interference colour in differently oriented forsterite grains; (B) to (D) Decreasing interference colours at wedging-out edges of sections of forsterite grains that have different orientation in thin section. Right: Determination of birefringence using crystal thickness and interference colour; example of forsterite grain (D).
75
Guide to Thin Section Microscopy |
Double refraction |
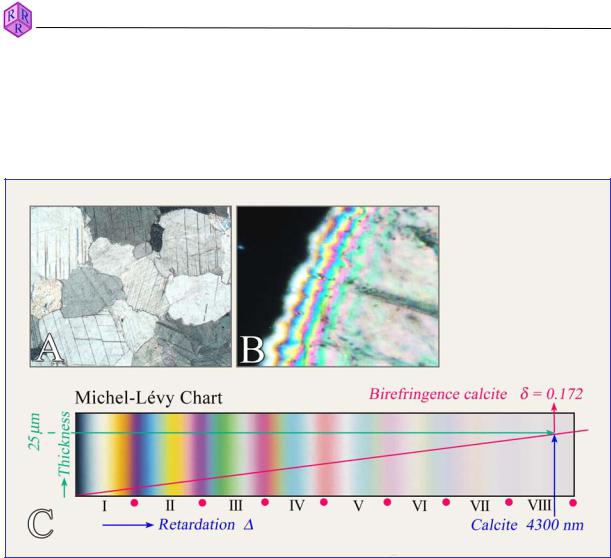
The determination of interference colours may be difficult in highly birefringent minerals (such as carbonates: so-called high-order white). Wedge-shaped grain boundaries provide a means to observe the colour spectrum, in relation to decreasing crystal thickness, down to first-order black (Fig. 4.2.3-9A,B).
Figure 4.2.3-9: A. Calcite grains in a thin section of marble appear in high-order white (+Pol). B. The wedge-shaped margin of a calcite grain shows a spectrum of decreasing interference colours from the interior plateau to the outer edge as the crystal thickness decreases from 25 to 0 µm. Five colour orders can be recognised using the red bands as a reference. C. A calcite grain cut exactly parallel to the c axis would show an 8th order white at a standard thickness of 25 µm. (Colour spectrum photograph supplied by Dr. Olaf Medenbach, Bochum).
Raith, Raase, Reinhardt – January 2011
76
Guide to Thin Section Microscopy |
Double refraction |
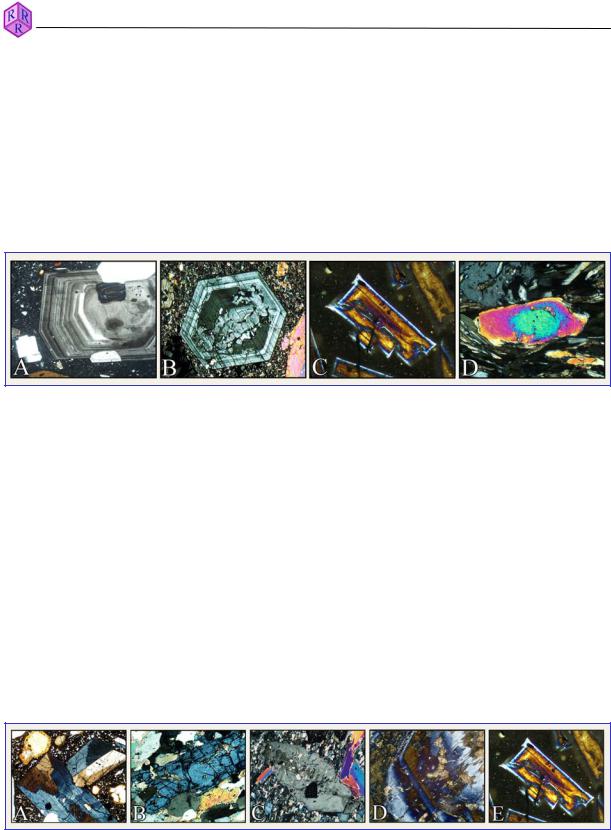
Interference colour and zoning of minerals: In minerals with extensive solid solution, the optical properties vary with chemical composition, including birefringence. Chemical zoning in crystals can then be recognised from the conspicuous zoning of the interference colour. Particularly impressive examples are plagioclases and titanaugites with oscillatory zoning, as found in certain volcanic rocks, zoned melilite in slags, and epidote in metamorphic rocks (Fig. 4.2.3-10).
The interference colours of coloured minerals may be masked significantly as they overlap with the minerals' own colour.
Figure 4.2.3-10: Zoning of interference colour in plagioclase (A), titanaugite (B), melilite
(C) and epidote (D).
Growth zoning with oscillatory variations in composition characterises the volcanic plagioclase and augite. Melilite has a higher gehlenite component at the rim compared to the core. The decrease of interference colours towards the edge of the epidote grain indicates decreasing Fe3+ contents during grain growth.
Anomalous interference colours: The interference colours of certain minerals deviate from the normal colour scheme. Instead of the grey to white colours in the first order of the interference colour spectrum, leather brown, ink blue to grey-blue colours are observed (Fig. 4-2-3-11). Such "anomalous" interference colours are generated by a strong dispersion of birefringence, which means that the latter attains distinctly different values for different wavelengths (colours). In the melilite example, the value of birefringence becomes zero for wavelengths in the range orange-yellow-green. Hence, these colours are not contributing to the interference colour (cf. Fig. 4.2.3-7).
Raith, Raase, Reinhardt – January 2011
Figure 4.2.3-11: Examples of anomalous interference colours: A. Titanaugite (sector structure and oscillatory zoning); B. Clinozoisite; C. Zoisite; D. Vesuvianite; E. Melilite
(continuous zoning wth åkermanite-rich core and gehlenite-rich rim).
B C D
77

Guide to Thin Section Microscopy |
Double refraction |
|
|
|
|
Raith, Raase, Reinhardt – January 2011
Figure 4.2.3-12: Anomalous interference colours in chlorite and melilite. Anomalous blue or leather-brown interference colours occur in solid solutions with birefringence values close to zero. The higher birefringent members of the solid solution series show normal light grey to creamy white interference colours of the first order.
78
Guide to Thin Section Microscopy |
Double refraction |
|
|
|
|
Raith, Raase, Reinhardt – January 2011
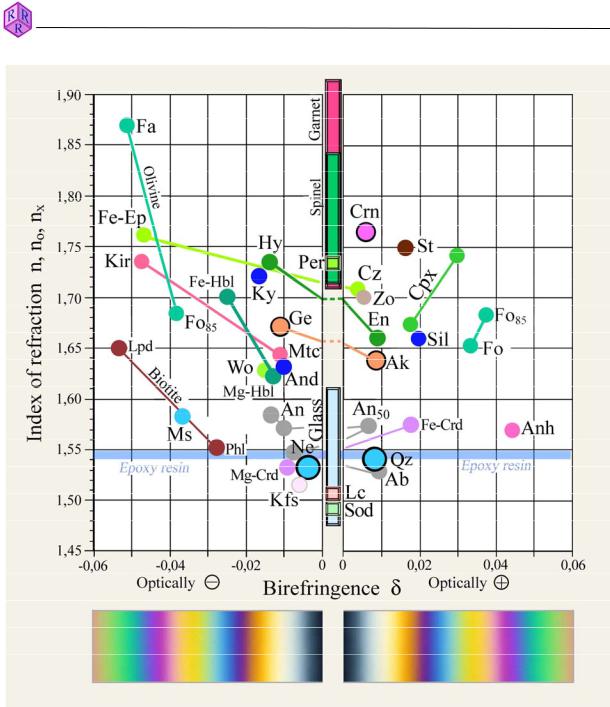
Figure 4.2.3-13: Diagram showing refractive index versus birefringence for rock-forming minerals.
Optic class and sign (uniaxial – biaxial; positive – negative), if unknown, must be determined with conoscopic methods. Bold circles mark the optically uniaxial minerals. Glasses and cubic minerals are optically isotropic (G = 0).
Mineral abbreviations after Whitney & Evans (American Mineralogist, 95, 185-187, 2010).
79
Raith, Raase, Reinhardt – January 2011
Guide to Thin Section Microscopy |
Extinction |
4.2.4 Extinction positions in birefringent crystal sections Vibration direction and extinction character
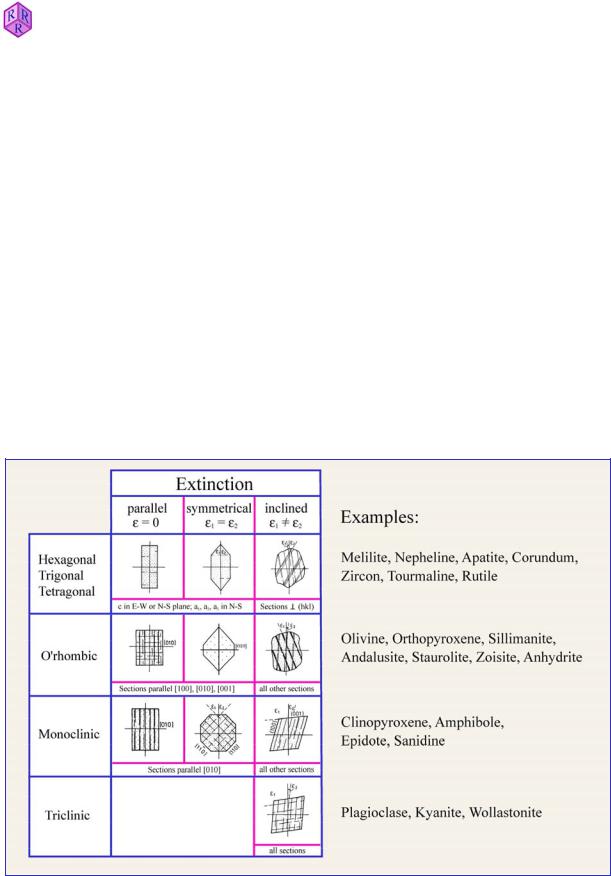
In optically anisotropic crystals, crystal symmetry, and in low-symmetry solid solutions also composition, controls the form and spatial orientation of the indicatrix (Figs. 4.1.2-4,5). The regular spatial relationships imply that the orientation of vibration directions with respect to morphological elements (crystal faces, crystal edges, cleavage planes, twin planes) is fixed in birefringent crystal sections. The resulting extinction behaviour allows a distinction between minerals of higher symmetry (hexagonal, trigonal, tetragonal and orthorhombic) and those of lower symmetry (monoclinic, triclinic) (Fig. 4.2.4-1). Three general types of extinction can be distinguished:
Straight extinction: the vibration directions lie parallel to the morphological reference directions (H = 0°).
Symmetrical extinction: the vibration directions bisect the angle between two equivalent morphological reference directions (H1 = H2).
Inclined extinction: the vibration directions form any angle (H 0°, 90°) with morphological reference directions.
Figure 4.2.4-1: Crystal symmetry and extinction behaviour. The orientation of the crystals shown here corresponds to the extinction position. The cross in each figure indicates the two polarizer directions resp. the crosshairs.
80

Raith, Raase, Reinhardt – January 2011
Guide to Thin Section Microscopy |
Extinction |
Extinction angle
The angle between a vibration direction and the morphological reference element (crystal edge, cleavage) in a crystal section is referred to as the extinction angle. Extinction angles are useful for the characterisation of monoclinic and triclinic minerals.
Example clinopyroxene: The monoclinic members of the pyroxene group show a correlation between extinction angle H, measured between vibration direction Z (nz) and the trace of (100) in a crystal section parallel to (010), and chemical composition, i.e. the type of clinopyroxene (Fig. 4.2.4-2). The angle can be expressed as H = Z ȁ c.
Figure 4.2.4-2: Extinction angle in clinopyroxenes
A: Relation between composition and extinction angle İ = Z ȁ c in crystal sections parallel to (010) for some important members of the clinopyroxene group. The c-direction corresponds to the traces of (100) crystal faces or the traces of the {110} cleavage. B: Method of determining the extinction angle. Reading I: position of reference morphological element parallel to the N-S line of the crosshairs. Reading II: extinction position.
Practical hints: The precise determination of extinction angles requires specific crystal orientations. In the case of clinopyroxene, these are crystal sections with the highest interference colour (cf. Fig. 4.2.1-10). The extinction angle is determined in the same way as measuring angles between morphological planes (e.g., cleavage planes), whereby the polarizers must be exactly oriented in E-W resp. N-S direction. The measurement is done in two steps (Figs. 4.2.4-2B): (1) Rotation of the morphological reference direction (trace of a crystal face or cleavage) into N-S direction (= N-S line of the crosshairs) and reading the angle value I from the vernier on the microscope stage; (2) rotation of the vibration direction into N-S direction (which is equivalent to the extinction position of the crystal section) and reading the angle value II at the vernier. The difference between the values is the extinction angle H.
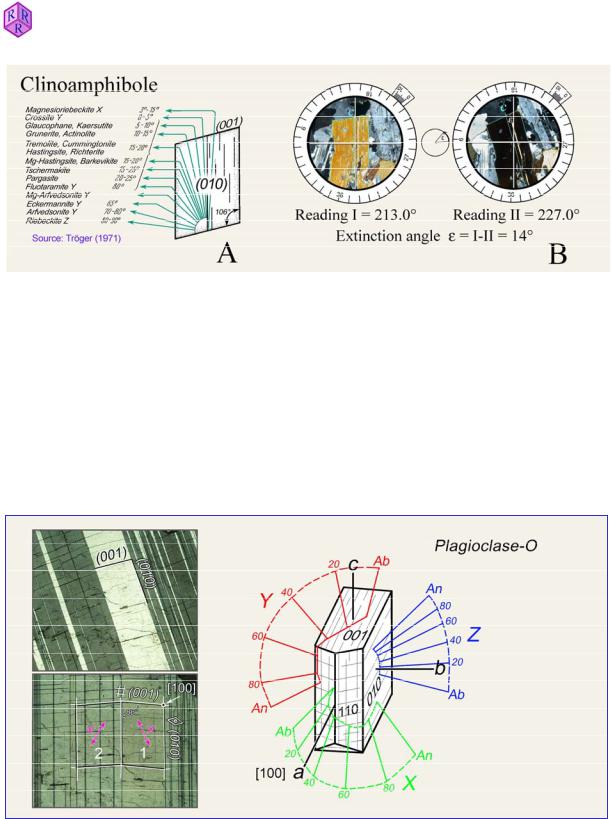
Example clinoamphibole: The monoclinic members of the amphibole group show a correlation between extinction angle H, measured between vibration directions Z, Y or X and the trace of (100) in a crystal section parallel to (010), and chemical composition, i.e. the type of clinoamphibole (Fig. 4.2.4-3A). The measurement of the extinction angle is shown in Fig. 4.2.4-3B and is carried out in the same way as for clinopyroxene.
81
Raith, Raase, Reinhardt – January 2011
Guide to Thin Section Microscopy |
Extinction |
|
|
|
|
Figure 4.2.4-3: Extinction angle in clinoamphiboles
A: Relation between composition and extinction angle H = X,Y,Z ȁ c in crystal sections parallel to (010) for some important members of the clinoamphibole group; B: Method of determining the extinction angle.
Example plagioclase: In plagioclase solid solutions, the orientation of the indicatrix in relation to the axes a, b and c of the triclinic crystal varies, dependent on anorthite content and the degree of Al/Si ordering. The vibration directions of the pair of waves change accordingly in crystal sections of defined orientation. At a constant degree of ordering, the vibration directions depend on anorthite content alone (Fig. 4.2.4-4A).
Figure 4.2.4-4A: Relation between indicatrix orientation and anorthite content in plagioclase with maximum Al-Si order (from slowly cooled plutonic and metamorphic rocks). The anorthite content of plagioclase solid solutions in such rocks can be determined reasonably well by measuring the extinction angle H. H is the angle between the vibration direction X' and the trace of (010) in a section orthogonal to the direction [100] (Method of Rittmann, 1929).
82
Raith, Raase, Reinhardt – January 2011
Guide to Thin Section Microscopy |
Extinction |
|
|
|
|
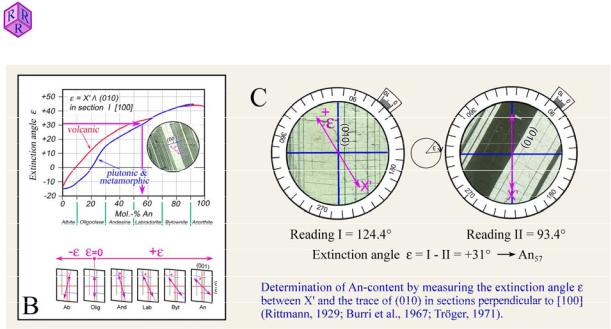
Figure 4.2.4-4B,C: Extinction angle İ in plagioclase crystal sections A [100]
Practical hints: The determination of anorthite content by measuring the extinction angle H ("zone method" of Rittmann 1929; Burri et al., 1967) requires crystal sections that are oriented exactly orthogonal to [100]. In such crystal sections, the (010) interfaces of albite twins as well as the (001) cleavage traces occur as sharply defined, thin lines (Fig. 4.2.4- 4A,C). They form an acute angle of 86°. Wider (010) lamellae relating to the Carlsbad twin law do not show (001) cleavage traces. If the (010) traces are rotated into N-S direction, the two sets of albite twin lamellae show identical interference colours if the grain is appropriately oriented (Fig. 4.2.4-4C). Carlsbad twins display a different interference colour if placed in this position. In order to distinguish albite lamellae from the common pericline twin lamellae oriented nearly parallel to (001), one of the two twin lamellae sets is rotated out of the extinction position anticlockwise by 45°, and the first-order red plate is inserted. Increase of interference colours albite twins; decrease of interference colours pericline lamellae.
The measurement of the anorthite content involves two steps (Fig. 4.2.4-4C): (1) Rotation of the morphological reference direction ((010) twin plane) into N-S orientation (= N-S line of the ocular crosshairs) and reading of the angle value I from the vernier of the microscope stage; (2) rotation of the vibration direction X' into N-S orientation (which corresponds to the extinction position of one set of twin lamellae) and reading of the angle value II at the vernier. The difference of both angle values equates to the extinction angle H. (3) In order to obtain the sign of the extinction angle H, it must be checked whether X' lies in the acute or in the obtuse angle between the morphological reference directions (010) and (001) inside the respective twin lamellae. Since the observed twin set is in extinction, it is advisable to insert the first-order red plate. If X' lies in the obtuse angle (An0-20), H is negative; if X' lies in the acute angle (An20-100), H is positive (Fig. 4.2.4-4B).
For the example shown (plagioclase from Lindenfels Gabbro, Germany), the measured extinction angle of 31° indicates an anorthite content of 57 mole% (Fig. 4.2.4-4B).
83

Guide to Thin Section Microscopy |
Extinction |
Optical character of the extinction directions
If a birefringent crystal section is in extinction position, the vibration directions Z' and X‘ are parallel to the N-S and E-W directions of the crosshairs (cf. Fig. 4.2.3-5). For a variety of applications it may be important to know which direction corresponds to the higher, respectively lower, refractive index:
x Determination of mineral colour in a specific vibration direction (cf. Ch. 4.2.1).
xDetermination of optical sign of optically uniaxial minerals which are elongate in c direction or platy having the basal plane ({001}, {0001}) as the dominant crystal face.
x Determination of sign of elongation (l) of acicular to columnar, platy or flaky minerals in elongate crystal sections.
For a distinction between vibration directions Z' and X‘, compensator plates are used. These are anisotropic crystal plates of constant or variable retardation with known orientation of the X and Z wave vibration directions (D = nx and J = nz). The vibration direction of the Z wave (J = nz) is engraved in the metal casing of the compensators. Commonly used compensators (Fig. 4.2.4-5):
The first-order red plate (lambda plate, Ȝ plate, sensitive tint plate) consists of a quartz or gypsum plate that is cut parallel to the optic axis, about 62 Pm thick, which shows a firstorder red interference colour in diagonal position (' = 551 nm).
The lambda/4 (lambda quarter) plate consists of a thin quartz or mica plate which shows a grey interference colour in diagonal position (' = 130-150 nm, depending on manufacturer).
The quartz wedge consists of a wedge-shaped quartz plate with the long axis parallel to the optic axis. In diagonal position, this quartz wedge shows interference colours ranging across four orders (' = 0 to 2200 nm).
Most commonly, the compensators are inserted diagonally into the microscope tube below the analyzer. The wave corresponding to nz (J or Z’) vibrates in NE-SW direction, the wave corresponding to nx (D or X’) in NW-SE direction.
Raith, Raase, Reinhardt – January 2011
Figure 4.2.4-5: Compensators – first-order red plate (O plate), lambda/4 plate and quartz wedge
84