

thin_section_microscopy
.pdfRaith, Raase, Reinhardt – January 2011
Guide to Thin Section Microscopy |
Conoscopy |
Skiodrome sphere
For the optically uniaxial mineral species, a net of longitudinal and latitudinal circles, which has rotational symmetry, forms the surface of the sphere (Fig. 4.2.5-3). The meridians (longitudes) represent the vibration directions of the E-waves and the circles of latitude the O-waves. The optic axis A is the rotation axis of the net.
For the optically biaxial mineral species, the spherical surface consists of an arrangement of two sets of cross-cutting ellipses with orthorhombic symmetry (Fig. 3.2.5-4). The optic axes A1 and A2 emerge at the common foci of the ellipses. The symmetry planes of the net correspond to the principal sections ZX, ZY and YX.
Skiodrome net (projected)
For practical reasons, the part of the surface of the skiodrome sphere that is captured in the conoscopic cone of light rays as it emerges from a crystal sections is projected onto the thin section plane (Fig. 4.2.5-3,4). The skiodrome nets and the corresponding interference figures for diagnostically important orientations of optically uniaxial and biaxial minerals are presented in Figs. 4.2.5-5 to 8.
Interference figure
In the interference figure, those domains are in extinction in which the vibration directions of the waves are parallel to the polarizer and analyzer directions. [Analogy to the orthoscopic extinction position: light entering the crystal in such directions will vibrate exclusively E-W and hence will be blocked by the analyzer; N-S vibrating waves are not generated!]. The domains of extinction are called "isogyres". Their geometry is dependent on the optical symmetry and the orientation of the crystal, and it may change as the microscope stage is turned.
The domains in which the vibration directions of the waves deviate from the polarizer and analyzer directions appear in different brightness and different interference colours. [Analogy to the orthoscopic diagonal position: the light entering the birefringent crystal plate in such directions is split into two sets of orthogonally vibrating waves, which interfere afterwards in the analyzer]. Curved lines of equal colour (or equal retardation ') are called "isochromes". Their geometry depends on the optical symmetry and the orientation of the crystal (Fig. 4.2.5- 5,7). The range of the colour spectrum, i.e. the number of isochromes, is determined by the birefringence values, the thickness of the crystal plate [' = d * (nz' – nx')] and the aperture of the objective (Fig. 4.2.5-6 to 8).
95

Raith, Raase, Reinhardt – January 2011
Guide to Thin Section Microscopy |
Conoscopy |
|
|
|
|
Figure 4.2.5-3: Skiodrome sphere and projections for optically uniaxial crystals.
On the skiodrome sphere the vibration directions of the orthogonally vibrating O- and E- waves are fixed for all ray propagation directions. The O-waves (red) vibrate always latitudinally, the E-waves (blue) vibrate longitudinally. Projections of the 3-D skiodrome net onto the plane of view are most useful for the interpretation of interference figures which result from different orientations of the uniaxial crystal. The figure shows such projections for crystal sections orthogonal to, oblique to, and parallel to the optic axis (resp. c-axis) of the crystal.
96

Raith, Raase, Reinhardt – January 2011
Guide to Thin Section Microscopy |
Conoscopy |
|
|
|
|
Figure 4.2.5-4: Skiodrome sphere and projections for optically biaxial crystals.
On the skiodrome sphere, the vibration directions of the orthogonally vibrating waves are fixed for all ray propagation directions. The net shows two sets of cross-cutting ellipses. The two optic axes A1,2 emerge at the common foci of the ellipses. Vibration directions with the principal refractive indices nz, ny and nx lie within the XY, ZX and ZY principal sections and are shown here in blue, red and green, respectively. For the investigation of optic sign and optic axial angle 2V, interference figures of crystal sections orthogonal to the acute bisectrix (Z or X, for 2V<45°) or perpendicular to one of the optic axes (A1,2, for 2V>45°) are most useful.
97

Raith, Raase, Reinhardt – January 2011
Guide to Thin Section Microscopy |
Conoscopy |
4.2.5.3 Optically uniaxial minerals
For the optically uniaxial mineral species a net of meridional and latitudinal circles, which has rotational symmetry, forms the spherical surface of the skiodrome (Fig. 4.2.5-3). The meridians represent the vibration directions of the E-waves and the circles of latitude the O- waves. The optic axis A is the rotation axis of the net.
Crystal sections perpendicular to the optic axis A are recognised in orthoscopic view by their isotropic behaviour. In conoscopic view, these sections show a characteristic interference figure which is a black cross. The isogyres become broader towards the margin of the field of view, and the four sectors are filled by concentric coloured circles. The optic axis forms the centre (melatope) of the cross (Figs. 4.2.5-3,5,6). If the microscope stage is turned, the interference figure does not change.
Interpretation of the interference figure
The vibration directions of the O- and E-waves are orthogonal to each other and are arranged concentrically around the optic axis. In the N-S and E-W directions of the interference figure, the vibration directions coincide with the polarizer and analyzer directions. In these directions only E-W vibrating waves pass the crystal plate (O-waves along the N-S isogyre; E-waves along the E-W isogyre), but these will be blocked by the analyzer. Due to the rotational symmetry of the indicatrix (and the skiodrome net) and the particular orientation of the crystal plate (viewing direction parallel to the optic axis), the interference figure does not move or change if the stage is rotated.
The increase of the interference colours towards the edge of the field of view is caused by the increase of the retardation ' of the O-waves and E-waves from the centre [G = 0 in the direction of the optic axis] to the periphery, whereby the potential range of visible colours is limited by the mineral-specific maximum birefringence perpendicular to the optic axis. [G = |ne – no|]. The circular arrangement of isochromes is a result of the rotational symmetry of the indicatrix and the specific crystal orientation perpendicular to the optic axis. The range of the colour spectrum (i.e, the number of isochromes) depends on birefringence and crystal plate thickness [' = d * (ne' – no)] as well as on the numerical aperture of the objective. For example, in a thin section of 25µm thickness, the interference figure of highly birefringent calcite (G = 0.172) comprises about six orders of interference colour, while quartz (G = 0.009) shows first-order colours only (Fig. 4.2.5-6).
In crystal sections oblique to the optic axis A, the isogyre cross shifts towards the periphery of the field of view and moves in a circular fashion if the microscope stage is rotated. The distance of the melatope to the centre of the field of view reflects the tilt angle between the optic axis and the microscope axis. The E-W and N-S portions of the isogyre cross move through the field of view without rotation (Fig. 4.2.5-5B,C).
Crystal sections parallel to the optic axis show maximum birefringence in orthoscopic view. The conoscopic interference figure shows a broad black cross which, at minimal rotation of the stage, quickly opens up ("flash figure"). Due to their similarity with interference figures of optically biaxial minerals, interference figures of such orientations have no practical significance.
98

Raith, Raase, Reinhardt – January 2011
Guide to Thin Section Microscopy |
Conoscopy |
|
|
|
|
|
|
|
|
Figure 4.2.5-5: Interference figures of optically uniaxial minerals.
Upper section: Skiodrome presentations and interference figures for differently oriented crystal sections of a uniaxial crystal. The vibration directions are shown in red (O-wave) and blue (E-wave).
Lower section: Modification of interference figures for crystal orientations B, C and D during a 90° rotation of the microscope stage.
99

Raith, Raase, Reinhardt – January 2011
Guide to Thin Section Microscopy |
Conoscopy |
Determining the optic sign of uniaxial minerals
For the determination of optic sign, crystal sections are required that are either isotropic or show very low interference colours in orthoscopic view. The conoscopic interference figure will then show a more or less centred, dark isogyre cross.
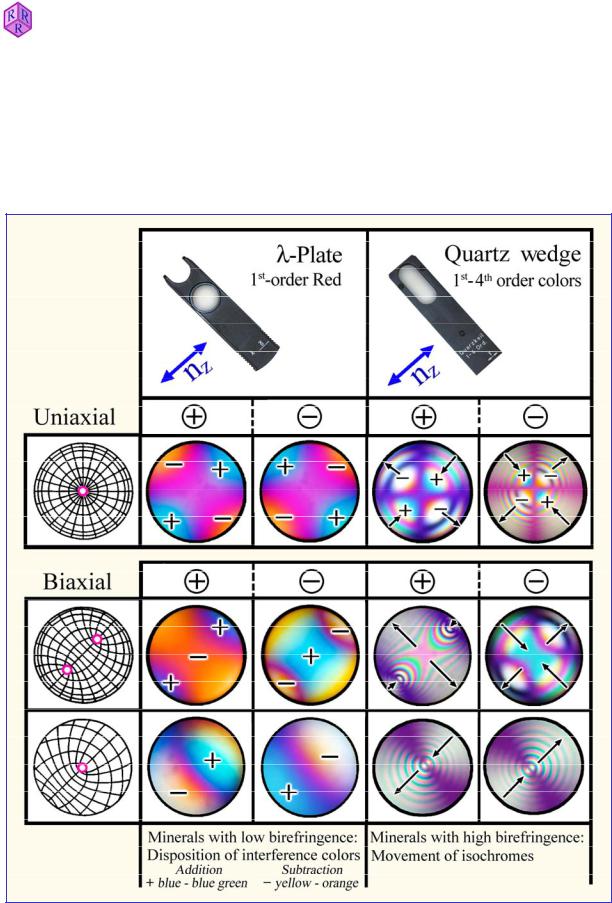
If the first-order red plate is inserted, the cross will appear in 1st-order red, while the four quadrants display two different sequences of interference colours, depending on the vibration direction of the E- and O-waves. Two cases have to be distinguished:
Case A: In quadrants I and III the interference colours increase by one order (= addition), while in quadrants II and IV the interference colours decrease by one order (= subtraction). Thus, ne' > no, and hence the optic sign of the minerals is positive (Fig. 4.2.5-6).
Case B: In quadrants I and III the interference colours decrease by one order (= subtraction), while in quadrants II and IV the interference colours increase by one order (= addition). Thus, ne' < no, and hence the optic sign of the minerals is negative (Fig. 4.2.5-6,9).
The interference figure in high-birefringent minerals shows multiple isochromes. In order to distinguish clearly between cases A and B, it is suggested to use the quartz wedge instead of the first-order red plate. When inserting the quartz wedge, the isochromes in the four quadrants shift in a characteristic way (Fig. 4.2.5-6,9).
Figure 4.2.5-6: Determination of the optic sign of a uniaxial crystal.
The distinction between positive and negative optic sign is made in sections perpendicular to the optic axis by observing the addition and subtraction phenomena caused by insertion of the first-order red plate.
100

Raith, Raase, Reinhardt – January 2011
Guide to Thin Section Microscopy |
Conoscopy |
4.2.5.4 Optically biaxial minerals
The skiodrome sphere of optically biaxial mineral species shows an arrangement of overlapping ellipses that possesses an orthorhombic symmetry (Fig. 3.2.5-4). The optic axes A1 and A2 emerge at the common foci of the ellipses. They enclose the axial angle 2V which can attain mineral-specific values between 0° and 90°. The bisector (acute bisectrix) of 2V is either Z (2Vz < 90° = optically positive) or X (2Vx < 90° = optically negative). The symmetry plane of the net corresponds to the principal sections ZX (= optic axial plane), ZY and YX of the indicatrix.
Crystal sections orthogonal to the acute bisectrix (at small 2V) or orthogonal to one of the optic axes provide the diagnostically least ambiguous interference figures. As opposed to the interference figure of optically uniaxial crystals, the isogyres change their shape as the stage is rotated (Fig. 4.2.5-7A).
Interference figures of crystal sections oriented orthogonal to the acute bisectrix (2V < 60°).
In extinction positions (orthoscopic view), the axial plane is oriented either N-S or E-W. In this position, the conoscopic image shows a black cross, with one isogyre being wider than the other. The thinner one represents the optic axial plane and appears tighter at the emerging points of the optic axes (melatopes). When examining highly birefringent minerals, multiple isochromes can seen to surround the two melatopes (Fig. 4.2.5-7).
When turning the stage 45° into the diagonal position, the isogyre cross opens to form two hyperbolas which, depending on the sense of rotation, come to lie in quadrants I and III or in II and IV. The optic axes emerge in the inflection points of the hyperbolas. By rotating the stage 360°, the isogyres separate and converge, corresponding to the change between brightimage and extinction position in the orthoscopic mode of view (Fig. 4.2.5-7). With an increase in optic axial angle, the distance between the two hyperbola-shaped isogyres increases, while their curvature decreases (Fig. 4.2.5-7).
Interference figures of crystal sections oriented orthogonal to an optic axis (2V > 60°).
The determination of the optic sign of minerals with a large optic axial angle requires crystal sections orthogonal to one of the two optic axes, or sections in which the viewing direction does not deviate significantly from the optic axis orientation. Such crystal sections appear in orthoscopic mode either isotropic or show low interference colours. The interference figure shows a more or less curving isogyre, with the optic axis emerging from the inflection point. As the stage is rotated, the isogyre rotates through the field of view (Fig.4.2.5-7). [Conversely, the isogyres of optically uniaxial minerals move parallel to the polarizeranalyzer directions (E-W and N-S), Fig. 4.2.5-5]. The blue and also red fringes of the isogyres, as seen in Figs. 4.2.5-7 and 4.2.5-8 (mica), are caused by dispersion of the optic axes, which means that the position of the optic axes varies with the wavelength of light. Such colour fringes must not be confused with isochromes.
101

Raith, Raase, Reinhardt – January 2011
Guide to Thin Section Microscopy |
Conoscopy |
|
|
|
|
|
|
|
|
Figure 4.2.5-7: Interference figures of optically biaxial minerals.
Top: Modification of the interference figure of a crystal section orthogonal to the acute bisectrix during rotation of the microscope stage. Normal positions at 0° and 90°; diagonal positions at 45° and 135°.
Middle: Variation in interference figures of optically biaxial crystals depending on orientation, 2V and rotation position of the microscope stage. Shown are sequences corresponding to a rotation of 0 to 90°. Bxa – acute bisectrix, Bxo – obtuse bisectrix.
Bottom: Relation between 2V and isogyre curvature for crystal sections perpendicular to an optic axis.
102

Raith, Raase, Reinhardt – January 2011
Guide to Thin Section Microscopy |
Conoscopy |
Determining the optic sign of biaxial minerals
For the determination of the optic sign, crystal sections with lowest-possible interference colours should be selected. For minerals with low 2V, acute bisectrix figures are also suitable (Fig. 4.2.5-8). Appropriate grains will show low, but not zero birefringence in orthoscopic mode. In general, it is sufficient to see one optic axis (melatope) within the field of view (Fig. 4.2.5-9). Ideally, the point of maximum curvature (melatope) of the isogyre should lie in the centre of the field of view, such that the direction of curvature can be seen clearly. The convex side of the hyperbola points to the acute bisectrix, the concave side to the obtuse bisectrix.
For the observation of the change of interference colour when a compensator is inserted, the isogyres should be positioned such that the optic axial plane is in diagonal, NE-SW orientation. In this orientation, the concave sides of the isogyres point NE and SW, or either direction, if only a single isogyre is in the field of view. After inserting the first-order red plate, the isogyres appear in 1st-order red, while the interference colours in between the isogyres change in accordance with the optic sign of the mineral (Fig. 4.2.5-8):
Case A: On the convex sides of the isogyres subtraction occurs (1st-order orange-yellow close to the melatope), while the concave domains show addition (2nd-order blue close to the melatope). The acute bisectrix is Z; the optic sign of the minerals is therefore positive (Fig. 4.2.5-8).
Figure 4.2.5-8: Determination of the optic sign of a biaxial crystal.
The optic sign can be determined in sections perpendicular to the acute bisectrix or perpendicular to one of the two optic axes. The distinction between positive and negative optic sign is made by observing the addition and subtraction phenomena resulting from insertion of the first-order red plate. The isogyres of the mica show distinct blue fringes of their concave side due to dispersion of the optic axes.
103
Raith, Raase, Reinhardt – January 2011
Guide to Thin Section Microscopy |
Conoscopy |
Case B: On the convex sides of the isogyres addition occurs (2nd-order blue), while the concave domains show subtraction (1st-order orange-yellow). The acute bisectrix is X; the optic sign of the minerals is therefore negative (Fig. 4.2.5-8).
When studying high-birefringent minerals, it is suggested that the quartz wedge is used instead of the first-order red plate. When inserting the quartz wedge, the isochromes in the four quadrants migrate in a characteristic way (Fig. 4.2.5-9).
Figure 4.2.5-9: Determination of the optic sign of anisotropic minerals.
104