

thin_section_microscopy
.pdfGuide to Thin Section Microscopy |
Colour and pleochrosim |
|
|
|
|
Figure 4.2.1-10: Determination of the colours in the principal vibration directions Z, Y and X of an optically biaxial mineral, using glaucophane, Na2(Mg,Fe2+)3 (Al,Fe3+)2[Si8O22](OH)2, as an example.
Raith, Raase, Reinhardt – January 2011
65
Raith, Raase, Reinhardt – January 2011
Guide to Thin Section Microscopy |
Light refraction: relief |
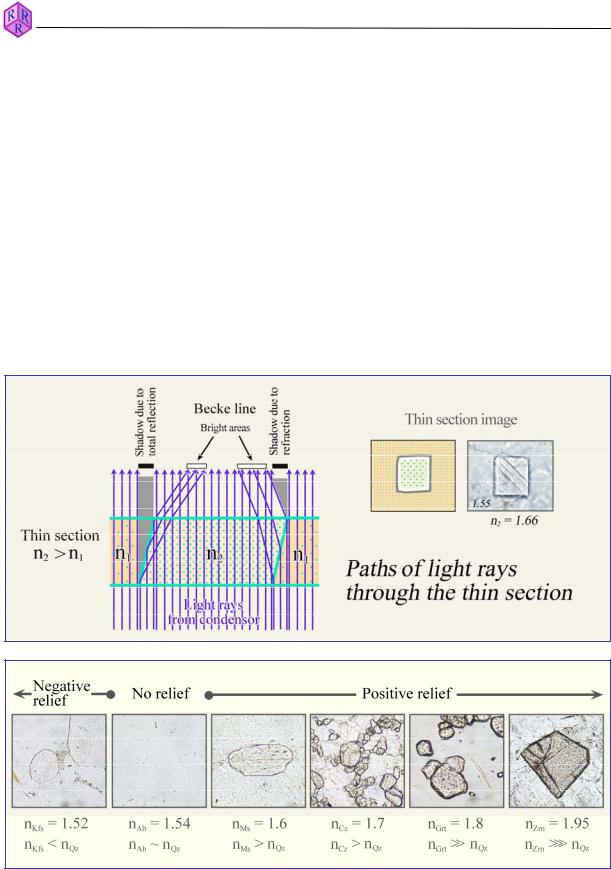
4.2.2 Light refraction (relief, chagrin, Becke line)
Refractive indices are important characteristics for identifying minerals. Their values cannot be determined directly in thin section, but must be estimated from a comparison with the embedding medium (epoxy resin; n about 1.54) or with minerals of known refractive indices, using light refraction effects. Criteria for doing this are relief, chagrin and the Becke line.
Relief
Mineral grains that have higher or lower refractive indices than their immediate surroundings show distinct contours and appear to lie higher or lower than the adjacent materials. The relief is a result of refraction and internal total reflection of light rays at the interface between the mineral grain and its surroundings. The higher the difference between the respective refractive indices, the more pronounced are grain outline and relief. Both disappear if the refractive indices of adjacent materials are identical (Fig. 4.2.2-1).
Figure 4.2.2-1: Generation of relief by refraction of light rays at grain boundaries. The lower sequence shows, from left to right, grains of K-feldspar (Kfs), albite (Ab), muscovite (Ms), clinozoisite (Cz), garnet (Grt) and zircon (Zrn) in quartz (n = 1,55).
66
Raith, Raase, Reinhardt – January 2011
Guide to Thin Section Microscopy |
Light refraction: chagrin |
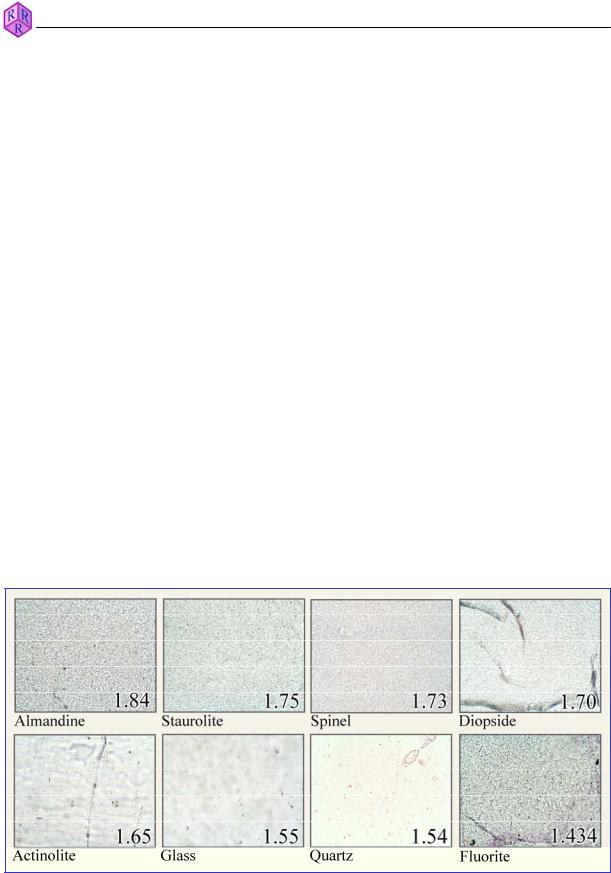
Chagrin (surface roughness)
The upper and lower surfaces of minerals in thin section (in polished sections only the lower surface) show relief due to minute roughness, unevenness and cracks. If the minerals have higher or lower refractive indices than the embedding medium (epoxy resin, n = 1.54), refraction and reflection of light rays will occur at this micro-relief. As a result, the grain surfaces display a finely pitted structure in the microscope, which is referred to as chagrin (French for grained leather). The larger the difference of the refractive indices between mineral and epoxy resin, the more pronounced is the chagrin as the proportion of totally reflected and scattered light increases (Fig. 4.2.2-2).
Practical hints: The chagrin contrast may be modified by changing the illumination conditions: (1) putting the auxiliary condenser lens into the light path and opening the aperture diaphragm decrease the chagrin effect; (2) closing the aperture diaphragm and swinging out the condenser lens increases the effect. For an estimation of the light refraction of an unknown mineral using the chagrin contrast, the illumination conditions and magnification should be kept constant (i.e., small aperture by closing the aperture diaphragm; 20x objective).
Furthermore, it should be noted that the chagrin contrast is generally low in polished microprobe sections, as light scattering is only occurring at the rougher lower surface of the minerals.
Note also that a clouding due to finely disseminated mineral and fluid inclusions can give an impression of higher relief than the host material actually has.
Figure 4.2.2-2: Chagrin in relation to the refractive index of a mineral.
67

Raith, Raase, Reinhardt – January 2011
Guide to Thin Section Microscopy |
Light refraction: Becke Line |
Becke Line
At the boundary between two substances of different refractive index (crystal–epoxy resin, crystal–glass, crystal–crystal) a bright fringe, the Becke Line, is observed at high magnification. When closing the aperture diaphragm, this fringe may show colours, particularly if the minerals show a small difference in refractive index but a large difference in dispersion. The Becke Line is named after Friedrich Becke (1855-1931).
If this phase boundary is defocused by raising or lowering the stage slightly, the light fringe moves from one phase into the adjacent one: When lowering the stage it moves into the higher refractive substance, and when raising the stage into the lower-refractive substance. An explanation of this phenomenon is given in Fig. 4.2.2-3, left-hand side.
The intensity of the Becke Line decreases as the difference in refractive indices between the adjacent substances decreases. It disappears completely if the indices are identical. Differences in the refractive indices in the order of 0.001 to 0.002 can still be recognised. On the other hand, the Becke Line is obscured at high differences in refractive index by the strong chagrin.
Practical hints: For observation of the Becke Line, a steeply inclined, but not vertical, clean boundary between two phases must be chosen. Suitable are also broken-off grain boundaries bordering on epoxy resin (in break-outs or at the thin section edge). The phase boundary is then viewed with sufficiently high magnification (20x objective), the contrast is optimised by closing the aperture diaphragm, and the sense of movement of the Becke Line is studied by raising and lowering the stage slightly (Fig 4.2.2-3, right-hand side).
Figure 4.2.2-3: Generation of the Becke Line (left); movement of the Becke Line at the quartz-glass interface as a result of raising or lowering the stage.
68

Guide to Thin Section Microscopy |
Double refraction |
4.2.3 Double refraction
In non-cubic, optically anisotropic crystals, light propagates in all directions as two sets of orthogonally vibrating plane-polarized waves, except for directions parallel to an optic axis. The two waves have different velocities (and correspondingly different refractive indices nz' and nx‘).
The specific relation between crystal symmetry and indicatrix in each mineral species defines the orientation of the polarization plane and the refractive index of the two waves (Ch. 4.1.2; Figs. 4.1.2-4,5). For every crystal section seen in thin section these parameters can be derived from the ellipse created by the intersection of the indicatrix and the thin section plane (Fig. 4.2.3-1).
Raith, Raase, Reinhardt – January 2011
Figure 4.2.3-1: Relationship between crystal section, crystal orientation and indicatrix orientation using melilite as an example.
69
Raith, Raase, Reinhardt – January 2011
Guide to Thin Section Microscopy |
Double refraction |
4.2.3.1 Observation without analyzer (plane-polarized light mode)
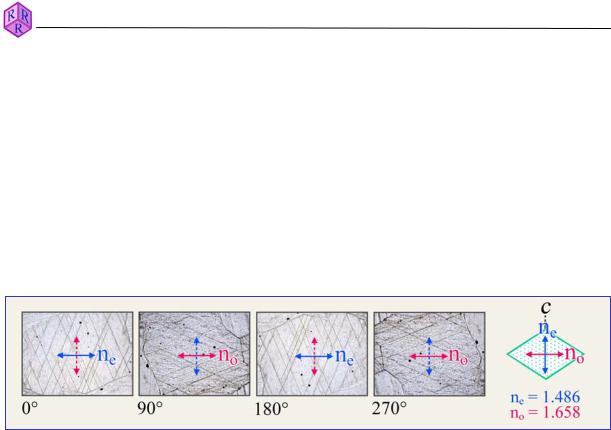
In plane-polarized light, anisotropic minerals can only be distinguished from isotropic minerals if characteristic grain shapes are observed (e.g., elongate or platy habit), if the grains display relief changes such as chagrin contrast as the stage is turned (only in minerals with large differences in nz' and nx'), or if the absorption colour changes with changing orientation (pleochroism).
The birefringence (G) of minerals is commonly not large enough to create distinct chagrin effects, with the exception of carbonates. Fig. 4.2.3-2 shows the striking change of chagrin in calcite due to its extreme birefringence (G = |no-ne| = 0.172).
Figure 4.2.3-2: Change of chagrin in calcite during a 360° rotation of the stage. Crystal section parallel to c axis. Shown are the four positions where the vibration directions of the two waves in the crystal coincide exactly with the polarizer directions. In these positions, only the E-W vibrating wave is passing through the crystal. The large difference between the refractive indices of the O- and E-waves causes the change in relief (ne = 1.486; no = 1.658).
The majority of minerals show no or very little pleochroism. Exceptions include tourmaline, members of the amphibole group, Fe-Ti-rich biotites as well as less common minerals such as piemontite, sapphirine, dumortierite, yoderite and lazulite (Fig. 4.2.1-3).
Pleochroic minerals of tetragonal, hexagonal and trigonal symmetry show two characteristic absorption colours parallel to the vibration directions of the E- and O-waves (dichroism). Crystal sections normal to the crystallographic c-axis (= optic axis) only show the absorption colour of the O-wave as the stage is rotated. Crystal sections parallel to the c-axis show an alternation between the absorption colour of the E-wave (E-W orientation of c) and the O- wave (N-S orientation of c) every 90° during stage rotation (Ch. 4.2.1, Figs. 4.2.1-4,5).
Pleochroic minerals of orthorhombic, monoclinic and triclinic symmetry show three characteristic absorption colours parallel to the principal indicatrix axes X, Y and Z (pleochroism). Crystal sections normal to one of the two optic axes show the absorption colour of the Y vibration direction as the stage is rotated. An identification of the absorption colours in the X, Y and Z directions requires specific crystal sections (Ch. 4.2.1, Figs. 4.2.1– 7-10).
70
Raith, Raase, Reinhardt – January 2011
Guide to Thin Section Microscopy |
Double refraction |
4.2.3.2 Observation with analyzer inserted (crossed-polarizers mode)
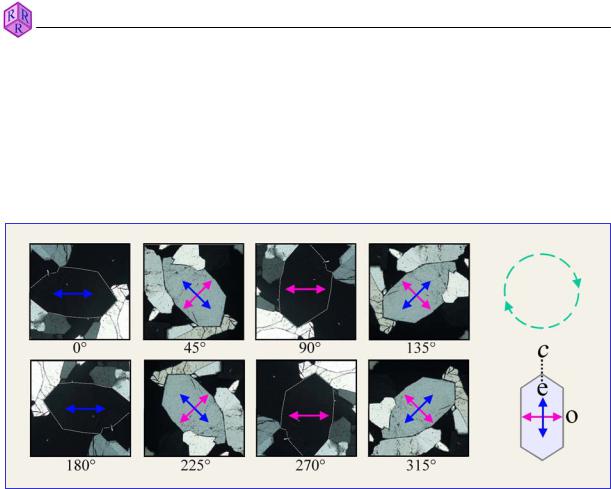
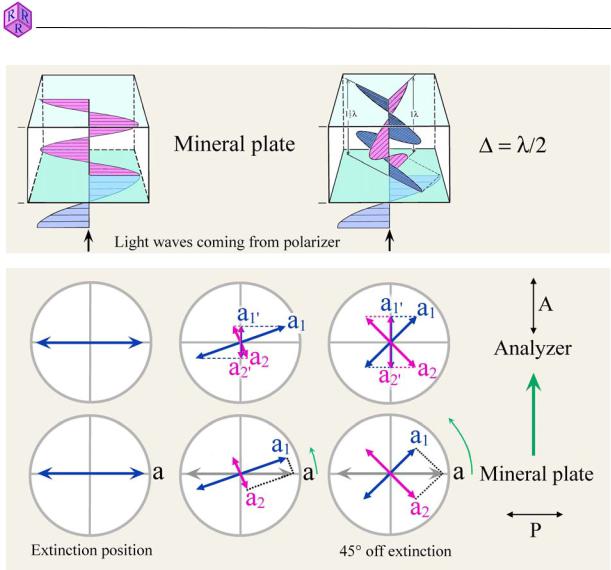
Extinction behaviour: The rotation of a birefringent crystal section between crossed polarizers involves a periodic change between a bright image and a dark image. A full rotation of the stage involves four extinction positions separated by 90° and four bright images in between (Fig. 4.2.3-3). The four orientations of maximum brightness are also referred to as diagonal positions.
Figure 4.2.3-3: Extinction positions and diagonal positions of a quartz grain during a 360° rotation of the stage.
In the extinction position the E-W vibrating waves leaving the polarizer are exactly parallel to one of the two possible vibration directions of the crystal (Fig. 4.2.3-3). Hence, the waves are not split up and pass the mineral without any change in vibration direction as E-W vibrating waves which propagate with the velocity specific to that direction in the crystal. Taking the optically uniaxial quartz as an example, either the E- or the O-waves with the refractive indices ne' resp. no are parallel to the polarizer. In the general case of an anisotropic mineral, the waves are those that relate to the refractive indices nz' and nx'. After leaving the crystal, the E-W vibrating waves are blocked by the N-S-oriented analyzer, and the crystal appears black.
If the crystal is rotated out of the extinction position, the E-W vibrating waves leaving the polarizer are split up in the crystal into two diagonally vibrating waves with refractive indices ne' and no resp. nz' and nx' in the general case of an anisotropic mineral (Fig. 4.2.3-3,4).
71
Guide to Thin Section Microscopy |
Double refraction |
|
|
|
|
|
|
|
|
Raith, Raase, Reinhardt – January 2011
Figure 4.2.3-4: Vector construction for light intensities as the mineral is rotated from the extinction position into a 45° diagonal position.
As both waves propagate in the crystal with different velocities (and correspondingly different refractive indices nz' and nx'), a specific phase shift is created by the time the light reaches the upper crystal surface (retardation '). The amount of retardation is determined by two factors: (1) by the difference between the two wave velocities, or expressed differently, by the birefringence value (G = nz' - nx') of the crystal section, (2) by the thickness (d) of the crystal plate in the thin section. This is expressed by ' = d * (nz' - nx').
After leaving the crystal, both waves reach the analyzer with retardation '. The two waves have the same wavelength as the light below the crystal, but have a smaller amplitude (a1 and a2) and reach the analyzer with a certain phase shift (Fig. 4.2.3-4; in this example, the phase shift is O/2). The amplitude (intensity) of these waves is only dependent on the orientation of the vibration plane in relation to polarizer and analyzer. The minimum corresponds to the extinction position and the maximum value is reached in a diagonal position, 45° from the extinction position.
72
Guide to Thin Section Microscopy |
Double refraction |
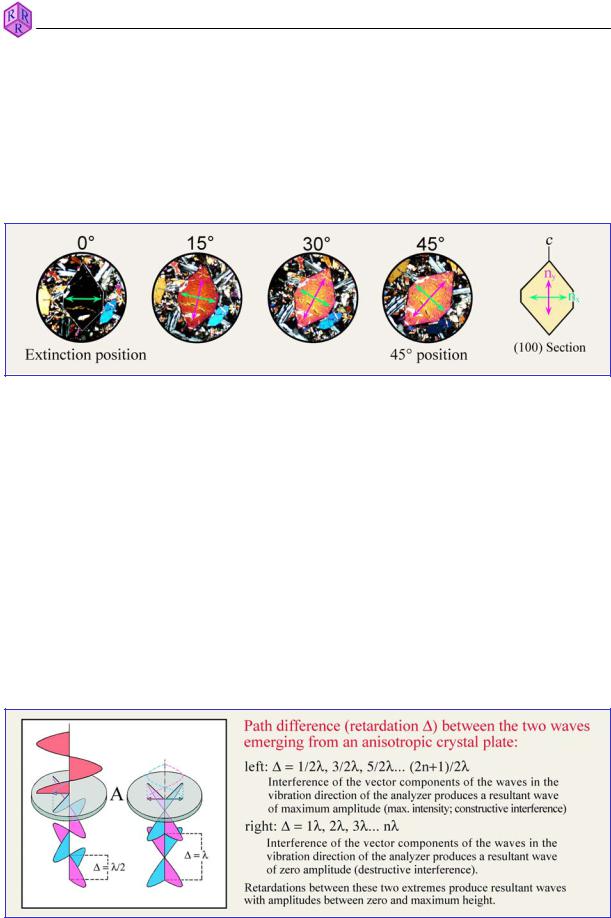
Interference colours: During observation in white light, crystal sections show interference colours, except in their extinction positions (Fig. 4.2.3-5). These result from interference of the two waves in the analyzer, whereby the various colours of the white light spectrum are amplified, diminished, or even obliterated, depending on the retardation attained in the specific crystal section (Fig. 4.2.3-6). From the modification of the distribution of spectral intensities, a mixed colour (interference colour) is generated that deviates from white. Increasing retardation correlates with a characteristic sequence of interference colours (Fig. 4.2.3-7).
Figure 4.2.3-5: Interference colour of a forsterite crystal as the stage is rotated from the extinction position into a 45° diagonal position. The interference colour does not change, but its intensity does.
The waves that enter the analyzer are brought to interference as they are reduced to their N-S components (Fig. 4.2.3-4). Only the amount of retardation (' = d * (nz' - nx')) controls whether the pair of waves obliterate themselves or generate a resulting wave with decreased or increased amplitude (Fig. 4.2.3-6). Precisely speaking, if white light is used, an infinite number of wave couplets leave the sample crystal, each being a pair of waves with identical Ȝ. All these wave couplets are constrained in their vibration directions to the two orthogonal directions defined by the crystal's orientation. Each wave couplet is reduced in the analyzer to a single wave with a N-S vibration direction. Thus, the condition for interference (vibration in a single plane and identical velocity) is realised in the analyzer. The extent of constructive or destructive interference varies between all the wave couplets, dependent on the relation between Ȝ and ǻ (cf. Fig. 4.2.3-6). Any specific retardation (expressed in nm) produces a characteristic and unique wavelength spectrum and wave amplitude pattern that defines a specific interference colour.
Raith, Raase, Reinhardt – January 2011
Figure 4.2.3-6: Interference of waves in the analyzer; for clarity of presentation the analyzer direction is shown here in E-W orientation (modified after Patzelt, 1985).
73

Guide to Thin Section Microscopy |
Double refraction |
Raith, Raase, Reinhardt – January 2011
Figure 4.2.3-7: Sequence of interference colours, Michel-Lévy colour chart.
74