

thin_section_microscopy
.pdfRaith, Raase, Reinhardt – January 2011
Guide to Thin Section Microscopy |
Extinction |
In order to distinguish between the extinction directions X' and Z' (with corresponding refractive indices nx' and nz‘), the mineral grain is put exactly in an extinction position and then rotated anticlockwise by 45r into a diagonal position (Fig. 4.2.4-6). Some modern microscopes have a device attached to the stage that can be activated in extinction position such that every 45r rotation is indicated by a mechanical click.
In diagonal position, the mineral displays its characteristic interference colour in maximum brightness. In this position, the originally E-W vibrating wave is now vibrating NE-SW (in quadrants I and III); the originally N-S vibrating wave is now oriented NW-SE (in quadrants II and IV).
Two different optical orientations of the mineral are possible in diagonal position (Fig. 4.2.4- 6):
I. The NE-SW vibrating wave is the slower wave; its refractive index is nz'. The NW-SE vibrating wave is the faster wave; its refractive index is nx'.
II. The NE-SW vibrating wave is the faster wave; its refractive index is nx'. The NW-SE vibrating wave is the slower wave; its refractive index is nz'.
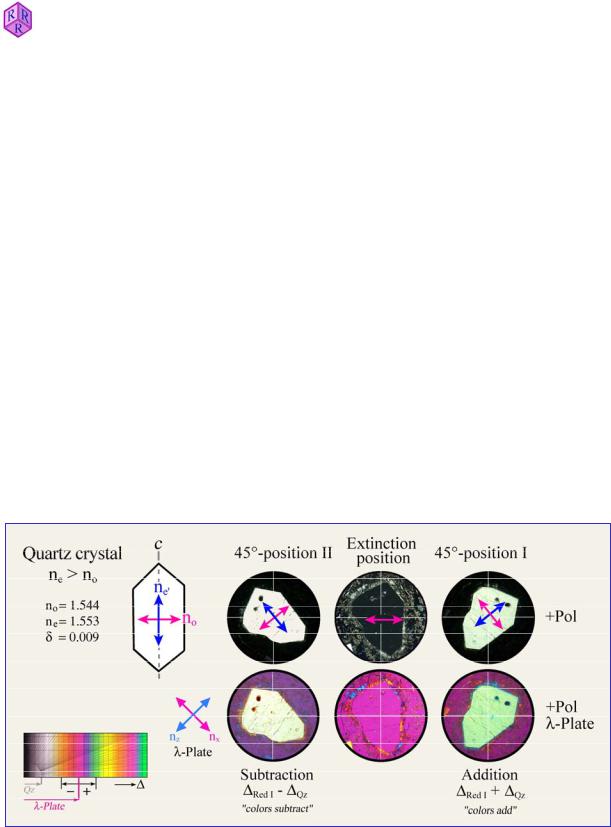
By inserting the first-order red plate or the lambda/4 plate into the light path, with the compensator direction Z’ (J) in diagonal NE-SW orientation, the two different positions I and II can be distinguished as follows:
I. Z' (mineral) || Z (compensator); X' (mineral) || X (compensator)
The interference colours of the mineral shift to colours of a higher order: this is called addition.
Minerals with low birefringence (quartz and feldspars, for example) and white to grey firstorder interference colours show blue to greenish-yellow second-order colours as the firstorder red plate is inserted, and first-order yellow if the lambda/4 plate is inserted (Fig. 4.2.4- 6).
The colour shift to a higher order is not always easily identified in minerals with high birefringence and interference colours of the 3rd or higher order, particularly for the novice. In such cases the quartz wedge may be used instead of the first-order red plate. By inserting the quartz wedge, the continuous change of the interference colours towards paler hues can be observed whereby the colours eventually reach a high-order white if the minerals have sufficiently high birefringence (such as carbonates).
85
Raith, Raase, Reinhardt – January 2011
Guide to Thin Section Microscopy |
Extinction |
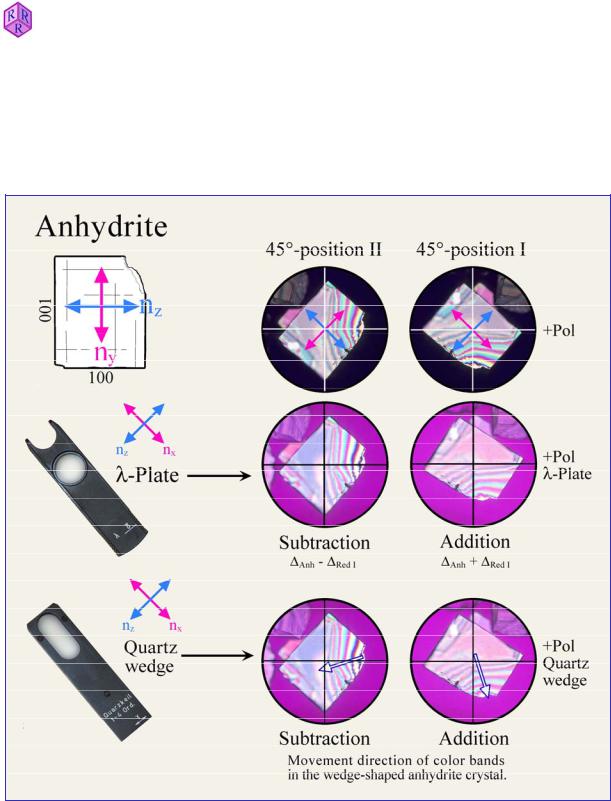
For the assessment of high interference colours, the observations at wedging-out edges of crystal plates are particularly useful. From the grain interior to the outer edge the crystal plate thickness decreases. The interference colours change correspondingly displaying a continuous sequence of decreasing orders down to first-order black. If the quartz wedge is inserted, the colour bands shift towards the grain edge, which is particularly well recognised in the reds of first and second order (Fig. 4.2.4-7). The outer edge of the grain eventually shows a fourthorder red, the grain interior shows higher interference colours.
Interpretation:
In an anisotropic mineral, the nx wave advances faster in the crystal plate than the nz wave. Both waves have different wavelengths. After leaving the mineral, both waves have the same velocity and wavelength, but with an accumulated retardation of 'Min = d * (nz' – nx').
With this retardation, the waves enter the crystal plate of the compensator, whereby the
mineral's nx' wave is again the faster wave nxComp, the original nz' wave transforms to the slower wave nzComp. Therefore, the retardation accumulated in the mineral is now further
increased by the retardation of the compensator. There is an increase of interference colours:
'Min + 'Comp = 'total
When inserting the first-order red plate or the quartz wedge with the mineral in this position it should be noted that the colours are always increasing towards a higher order.
Figure 4.2.4-6: Addition and subtraction in the two diagonal positions of a quartz grain cut oblique to its c axis. The E-wave vibrates parallel to c, whereby ne' = nz'; the O-wave vibrates orthogonal to c, with no = nx.
86

Raith, Raase, Reinhardt – January 2011
Guide to Thin Section Microscopy |
Extinction |
II. Z' (mineral) || X (compensator); X' (mineral) || Z (compensator)
The interference colours of the mineral section shift to colours of a lower order: this is referred to as subtraction.
Minerals with low birefringence (quartz and feldspars, for example) and white to grey firstorder interference colours show orange to grey first-order colours as the first-order red plate is inserted, and first-order dark grey if the lambda/4 plate is inserted (Fig. 4.2.4-6).
The colour shift to a lower order is not always easily identified in minerals with high birefringence and interference colours of the 3rd or higher order, particularly for the novice. In such cases, the quartz wedge may be used instead of the first-order red plate. By inserting the quartz wedge, the continuous change of the interference colours towards more saturated hues can be observed while the colours shift to lower orders. In minerals with low birefringence first-order black is reached initially. With further insertion of the quartz wedge, the colour sequence reverts to increasing interference colours (e.g., olivine and white mica). At thinning-out crystal plate edges, the colour bands move towards the grain interior as the quartz wedge is inserted (Fig. 4.2.4-7). This effect is particularly evident from the red tones of the first, second and third order. The dark grey colour band of the first order at the outermost edge of the mineral migrates into the grain interior and is replaced by colours of the first to third order, if the interference colours of the mineral lie in the first to second order (e.g., olivine, white mica, pyroxenes).
Interpretation:
In an anisotropic mineral, the nx wave advances faster in the crystal plate than the nz wave. Both waves have different wavelengths. After exciting the mineral, both waves have the same velocity and wavelength, but with an accumulated retardation of 'Min = d * (nz' – nx').
With this retardation, the waves enter the crystal plate in the compensator in which the fast and slow wave directions are at 90° to those of the mineral. The mineral's nx' wave now
becomes the slower wave nzComp, the original nz' wave transforms to the faster wave nxComp. Therefore, the retardation accumulated in the mineral is now reduced by the retardation of the
compensator. There is a decrease of interference colours: 'Min – 'Comp = 'total.
When inserting the first-order red plate or the quartz wedge, the following is to be noted:
1.If the retardation of the mineral is larger than that of the compensator, only decreasing colours of a lower order are observed.
2.If the retardation of the mineral is the same as that of the compensator, the mineral appears in first-order black ('total = 0). The retardation of the mineral is fully compensated.
3.If the retardation of the mineral is smaller than that of the compensator, the interference colour are reduced to a value corresponding to the difference 'Comp – 'Min. When inserting the quartz wedge, decreasing colours will be observed initially, down to first-order black, after which colours will increase again.
87
Raith, Raase, Reinhardt – January 2011
Guide to Thin Section Microscopy |
Extinction |
The interference colours of minerals that are strongly coloured in plane-polarized light may be masked significantly such that addition and subtraction positions with inserted first-order red plate are not easily distinguished by a novice. In such cases, it is recommended to use the quartz wedge and to observe the movement of colour bands at the wedging-out edges of minerals.
Figure 4.2.4-7: Anhydrite grain showing a colour sequence covering seven orders. Addition and subtraction can be easily recognised by observing the changes in the colour sequence along the wedge-shaped edge of the grain. Compensation with first-order red shifts the colour sequence into the grain interior by one order (subtraction), or towards the grain edge by one order (addition). When using the quartz wedge for compensation, the colour sequence moves either into the grain interior by four orders (subtraction) or out of the grain (addition).
88
Raith, Raase, Reinhardt – January 2011
Guide to Thin Section Microscopy |
Extinction |
Determination of the optic sign of optically uniaxial minerals
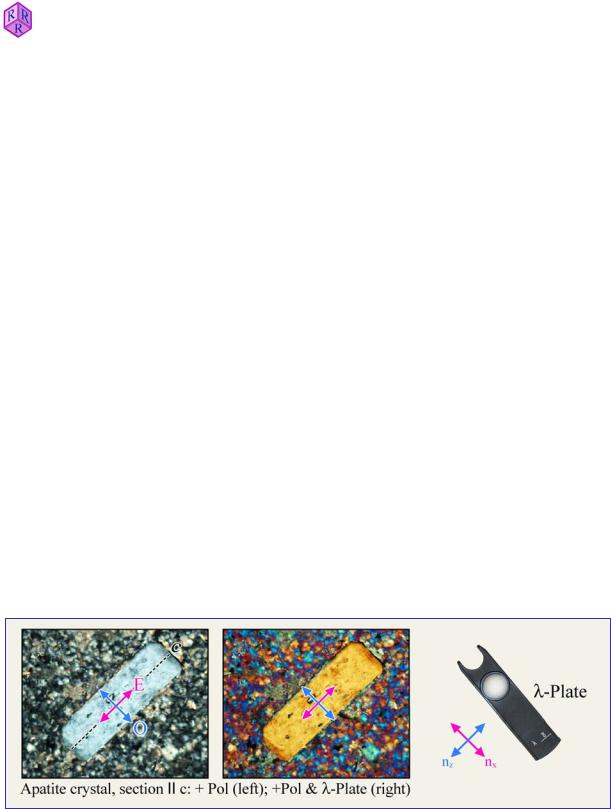
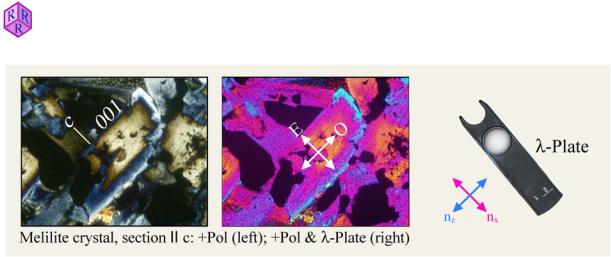
Optically uniaxial minerals that are elongate in c direction (e.g., quartz, apatite, tourmaline) and are present in thin section in a cut that is roughly parallel to that long axis, will have the E-wave (ne) vibrating parallel to c and the O-wave (no) orthogonal to c. If the habit of optically uniaxial minerals is platy (e.g., melilite), the same applies, but the O-wave now vibrates parallel to the elongate section.
For both crystal habits, the optic sign can be determined easily by compensation, that is, whether ne > no (= optically uniaxial positive) or ne < no (= optically uniaxial negative) (Fig. 4.2.4-8). The long axis of the crystal section is rotated into diagonal position (NE-SW orientation), and the first-order red plate or lambda/4 plate is inserted. For crystals elongate in
c, ne is now parallel to nzComp and no is parallel to nxComp. For platy minerals, the relation is reverse as c is perpendicular to the long dimension of the crystal sections. The retardation
between the waves which are created in the optically uniaxial mineral ('Min) and in the compensator plate will be increased through addition or decreased through subtraction, depending on optical sign. Correspondingly, the crystal section shows higher or lower interference colours if the compensator is inserted.
Elongate section through an elongate-prismatic crystal: ne is aligned with the long axis of the section; no is orthogonal to it. Addition occurs if ne > no; the mineral is optically uniaxialpositive. Subtraction occurs if ne < no; the mineral is optically uniaxial-negative.
Profile section through a platy mineral: no lies parallel to the long axis of the elongate crosssection; ne is orthogonal to it. Addition occurs if ne < no; the mineral is optically uniaxialnegative. Subtraction occurs if ne > no; the mineral is optically uniaxial-positive.
Figure 4.2.4-8A: Hexagonal apatite forms elongate crystals that show subtraction with the first-order red plate inserted, when placed in diagonal position. Hence, the optic sign is negative (ne < no).
89
Guide to Thin Section Microscopy |
Extinction |
|
|
|
|
Raith, Raase, Reinhardt – January 2011
Figure 4.2.4-8B: Tetragonal melilite forms platy crystals that show either addition or subtraction with the first-order red plate inserted, depending on composition. In this example, the core domain is optically positive (high åkermanite content), whereas the rim is optically negative (high Na-melilite + gehlenite components).
Sign of elongation l
Crystals with columnar to acicular or platy to flaky habits show elongate sections if cut parallel to their long morphological axis or perpendicular to a dominantly developed basal plane. If such elongate sections are rotated into a diagonal position (i.e., long axis l parallel to NE-SW) they show under crossed polarizers and compensator-in (first-order red plate or Ȝ/4 plate) either addition or subtraction, depending on their optic sign (Fig. 4.2.5-9).
Addition is observed if the wave with the larger refractive index (nz') vibrates parallel or at a small angle to the long dimension of the crystal section: l (+) = positive sign of elongation or "length-slow". Examples: acicular-columnar crystals – sillimanite, gedrite, anthophyllite; platy crystals –gehlenite, micas.
Subtraction is observed if the wave with the smaller refractive index (nx') vibrates parallel or at a small angle to the long dimension of the crystal section: l (–) = negative sign of elongation or "length-fast". Examples: acicular-columnar crystals – tourmaline, apatite; platy crystals – åkermanite.
For optically uniaxial mineral species with acicular-columnar habit, the sign of elongation corresponds to the optic sign. For platy uniaxial minerals, the two signs are opposite.
Elongate sections in which ny is parallel (or at a small angle) to the morphological long axis of the crystal or perpendicular to the planar dimension of platy crystals show a variable sign of elongation, l(+) or l(–), depending on the exact orientation of the crystal in thin section. Examples of such elongate crystals – wollastonite, epidote.
90
Raith, Raase, Reinhardt – January 2011
Guide to Thin Section Microscopy |
Extinction |
If the extinction direction deviates significantly from the long axis of the crystal section, it is convention to use the extinction position that forms an angle smaller than 45° with the long axis, and to rotate it into the diagonal position before the first-order red plate or lambda/4 plate is inserted for determining the sign of elongation. However, if extinction angles are close to 40-50°, the use of l(+) and l(-) becomes impractical.
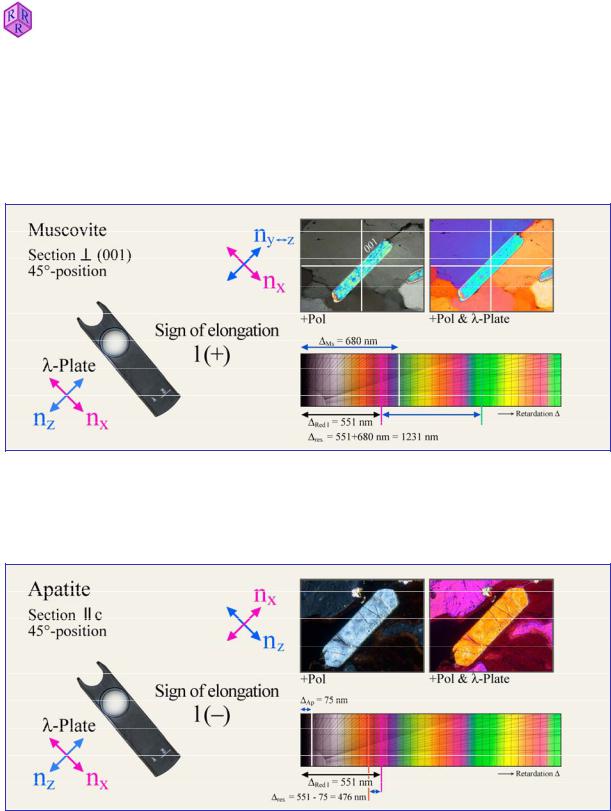
Figure 4.2.4-9A: Platy muscovite showing positive sign of elongation. In muscovite and first-order red plate, fast (nx) and slow (ny nz) waves vibrate in identical orientation. Therefore, the retardation adds up and increased interference colours result ('res = 'Red1 + 'Ms = 1231 nm; second-order blue-green).
Figure 4.2.4-9B: Prismatic apatite showing negative sign of elongation. In apatite, the fast wave vibrates parallel to the slow wave of the first-order red plate, and the slow wave in apatite parallel to the fast wave of the first-order red plate. Hence, retardation is reduced and subtraction results ('res = 'Red1 + 'Ap = 476 nm; first-order orange-yellow).
91

Raith, Raase, Reinhardt – January 2011
Guide to Thin Section Microscopy |
Conoscopy |
4.2.5 Conoscopic methods
4.2.5.1 Some basic principles
In "normal" orthoscopic view light enters the thin section orthogonally as a set of parallel, E-W vibrating light waves. The objective creates an enlarged, real, inverted image of the thin section, which is then further enlarged and viewed through the ocular. The light rays entering the thin section travel through the mineral grains in defined crystallographic directions that depend on the respective orientation of the crystals. In order to record the optical behaviour of an anisotropic mineral species, crystal sections of different orientations must be studied, as outlined in previous chapters (e.g., crystal sections with maximum interference colour are needed to determine birefringence).
Optic axial angle and optic sign cannot be determined directly in the orthoscopic mode of operation, except in specific circumstances where the crystal symmetry is known to be high (hexagonal, trigonal, tetragonal) and where the crystal shape allows to identify the c-axis direction (cf. Ch. 4.2.4).
As opposed to orthoscopy, the conoscopic view involves a convergent set of light rays, which means that a wide-angle cone of differently inclined light rays transmits the thin section (Fig. 4.2.5-1). To achieve this, the illumination aperture is enlarged to a maximum by putting the auxiliary condenser lens into the light path and opening the substage iris diaphragm.
Dependent on their propagation direction, the rays of this light cone will form an image in the focal plane above the objective, whereby the maximum opening angle of the cone of rays forming that image depends on the aperture of the objective used (Fig. 4.2.5-2). Since two orthogonally vibrating waves propagate generally in all directions within optically anisotropic minerals, these wave couplets are brought into interference in the analyzer, generating an interference figure. This interference figure can be viewed, either as an enlarged image by putting an auxiliary lens (Amici-Bertrand lens) into the light path, or with the naked eye by removing an ocular and looking down the ocular tube. Light waves that travel in the direction of the microscope axis, and are thus oriented orthogonal to the thin section plane, form the centre of the interference figure. The larger the angle of the ray propagation direction to the microscope axis, the larger the distance of the image point from the centre of the interference figure. Thus, the conoscopic interference figure allows to study the propagation behaviour of light in an anisotropic crystal quasi-simultaneously for a multitude of crystallographic directions within that crystal.
From the geometry of the interference figure and its modification through the use of compensators, the number of optic axes (uniaxial vs. biaxial), the optic axial angle (2V) and the optic sign (positive vs. negative) can be determined.
92
Guide to Thin Section Microscopy |
Conoscopy |
|
|
|
|
|
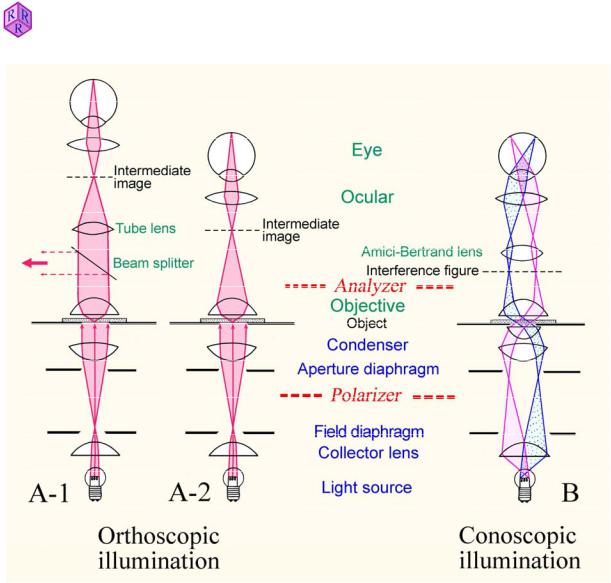
Figure 4.2.5-1: Light paths in the polarized-light microscope |
|
|
A: Orthoscopic illumination mode. In finite tube-length microscopes, the objective |
|
|
produces a real inverted image (intermediate image) of the specimen which then is viewed |
|
|
with further enlargement through the ocular (A-2). In infinity-corrected microscopes, the |
|
|
objective projects the image of the specimen to infinity, and a second lens placed in the tube |
|
|
(tube lens) forms the intermediate image which then is viewed through the ocular (A-1). This |
|
2011 |
imaging design allows to insert accessory components such as analyzer, compensators or |
|
beam splitters into the light path of parallel rays between the objective and the tube lens with |
||
January– |
||
only minor effects on the image quality. |
||
|
||
Reinhardt |
B: Conoscopic illumination mode. Parallel rays of the light cone which illuminates the |
|
specimen create an image in the upper focal plane of the objective (B). In the case of |
||
|
||
|
anisotropic crystals, an interference image is generated which can be viewed as an |
|
Raase, |
enlargement by inserting an auxiliary lens (Amici-Bertrand lens). The interference image can |
|
also be directly observed in the tube through a pinhole which replaces the ocular. |
||
Raith, |
|
93
Raith, Raase, Reinhardt – January 2011
Guide to Thin Section Microscopy |
Conoscopy |
4.2.5.2 Conoscopy of optically anisotropic crystals
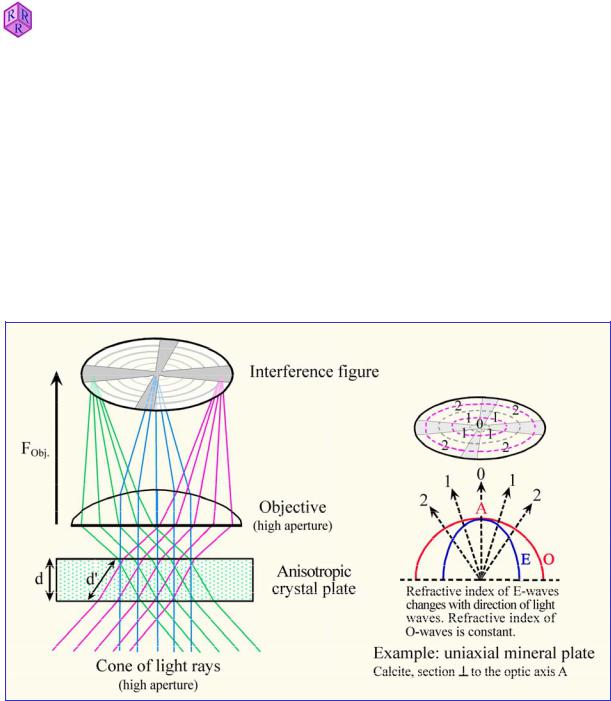
In the conoscopic mode, waves deviating from vertical incidence by increasing tilt angles travel increasing distances within the birefringent crystal. According to the relationship ' = d * (nz' – nx') described in chapter 4.2.3, it has to be concluded that the retardation ' of the waves increases with increasing angles due to the continuous increase of d' (= length of the light path in the crystal plate). Accordingly, the interference colours in a conoscopic interference figure should generally increase outwards. However, the interference figure is to a much larger extent controlled by the orientation of the vibration directions and the birefringence values of the wave couplets within the observed volume of the anisotropic crystal. As described previously, the birefringence for waves parallel to optic axes is zero. It increases as the angle between the optic axis and ray propagation direction (or wave normal, to be precise) increases.
Figure 4.2.5-2: Generation of an interference figure in the upper focal plane of the objective by imaging of parallel sets of rays that pass the crystal plate at different angles. The example shows these relationships for a uniaxial crystal (calcite) cut perpendicular to the optic axis.
The geometry of interference figures obtained from anisotropic crystals can be illustrated with the model of the skiodrome sphere developed by Becke (1905). The crystal is considered to occupy the centre of a sphere. Each ray propagation direction of light waves within the crystal has a corresponding point on the spherical surface where the ray pierces that surface. In each of these points, the vibration directions of the related waves can be shown as a tangent (e.g., O and E in case of optically uniaxial minerals). When connecting all the tangents of equal vibration direction, a geometric mesh of vibration directions is generated that depends on the optical symmetry of the crystal (Fig. 4.2.5-3,4).
94