

thin_section_microscopy
.pdfGuide to Thin Section Microscopy |
Optical properties: basic principles |
|
|
|
|
|
|
|
Raith, Raase, Reinhardt – January 2011
Figure 4.1.2-4: Optically uniaxial crystals; 3D surfaces of v and n.
A: 3D-surfaces of v and n; B: Construction of the indicatrix; C-D: Indicatrices of optically uniaxial positive and negative crystals.
55

Raith, Raase, Reinhardt – January 2011
Guide to Thin Section Microscopy |
Optical properties: basic principles |
Crystals of orthorhombic, monoclinic and triclinic symmetry
The propagation of both waves in crystals of such symmetry is direction-dependent. The resulting 3D two-surface models of ray velocities are complicated and have not had any impact on practical work. Microscopists prefer the single-surface indicatrix model for the explanation of optical phenomena (Fig. 4.1.2-5).
Figure 4.1.2-5: Optically biaxial crystals, crystal symmetry and indicatrix.
The indicatrix of crystals with orthorhombic, monoclinic and triclinic symmetry is respresented in a coordinate system with axes X, Y, Z that are orthogonal to each other. The geometry of the triaxial ellipsoid is defined by the proportional lengths of the refractive indices nx, ny, nz on X, Y and Z. Thus, the symmetry of the ellipsoid is generally orthorhombic. The refractive indices are defined as nz > ny > nx (or nȖ > nȕ > nĮ).
There are two circular sections with the radius ny. Orthogonal to these circular sections, light propagates with the same velocity as in an isotropic substance. These two directions correspond to the two optic axes A. The low-symmetry crystals are therefore optically anisotropic-biaxial.
The optic axes lie in the ZX plane (= optic axial plane OAP). Y is orthogonal to the OAP. The angle between the optic axes (2V) is mineral-specific and can attain values between 0° and 90°. If Z dissects the acute angle (2Vz < 90°), the crystal is biaxial-positive; if X dissects the acute angle (2Vx < 90°), the crystal is biaxial-negative. If the axial angle is 90°, the crystal is optically neutral.
The spatial orientation of the indicatrix in a crystal is defined by the crystal's symmetry:
x In crystals of orthorhombic symmetry, the ellipsoid axes (X, Y, Z) correspond to the crystallographic axes (a,b,c). Which indicatrix axis is parallel to which crystallographic axis depends on the specific mineral.
xIn crystals of monoclinic symmetry, it is only the crystallographic b axis and one of the indicatrix axes that are parallel (commonly Y). The other two axes lie in the symmetry plane (010) and form angles with the crystallographic axes a and c.
xIn triclinic crystals, none of the axes of the orthorhombic indicatrix is parallel to any of the crystallographic axes. The indicatrix axes form mineral-specific angles with the crystallographic axes.
56

Raith, Raase, Reinhardt – January 2011
Guide to Thin Section Microscopy |
Colour and pleochrosim |
4.2 Optical characteristics used for mineral determination
4.2.1 Colour and pleochroism
The intensity of white light can be variably decreased due to absorption as it passes through the thin section. If absorption wavelengths are outside the visible spectrum, glass phase and minerals appear colourless (white to greyish). Colours are generated if selective absorption affects certain parts of the spectrum more than others. Colour and colour intensity are important mineral-specific properties.
Practical hints: Colour intensity increases with sample thickness. In a standard thin section (25-30 µm thickness) wedge-shaped edges of grains or crystals thinner than 25 µm show a distinctly paler colour. In minerals with a high refractive index (n > 1.6) weak colours may be masked by the minerals' chagrin (see 4.2.2). Chagrin effects can be minimised if absorption colours are observed at high magnification (objective magnification M > 20x), with the auxiliary condenser inserted and aperture diaphragm completely open. Furthermore, it should be noted that the colour hue depends to some degree on the temperature of the light source. This can be adjusted to correspond to the colour temperature of natural light by changing light intensity and using appropriate filters (e.g., a blue filter).
In optically isotropic substances (glass phase, cubic minerals) light absorption is identical in all directions. Glasses and cubic crystals therefore show a single colour, no matter how the crystals are sectioned, as long as they are chemically homogeneous. The colour does not change if the stage is turned (Fig. 4.2.1-1). Colour and colour intensity provide clues to type and concentration of colour-inducing cations. This can be demonstrated using glasses and spinel group minerals of different composition (Fig. 4.2.1-2).
Figure 4.2.1-1: Optically isotropic phases such as the cubic minerals shown here generally display a single colour, independent of orientation (A-C: MgFe-spinel, hercynite, magnesioferrite; D,E: melanite, almandine; F: hauyne).
57

Guide to Thin Section Microscopy |
Colour and pleochrosim |
|
|
|
|
Raith, Raase, Reinhardt – January 2011
Figure 4.2.1-2A: Relationship between colour of the glass phase from slags of coal-fired boilers and the content in staining components TiO2 and Fe2O3 (wt.%).
Figure 4.2.1-2B: Relationship between mineral colour and composition of spinels in the system magnetite-magnesioferrite-hercynite-spinel. Spinel samples are partly from slags and sinters in coal-fired boilers (numbered samples) and partly from natural rocks.
58

Raith, Raase, Reinhardt – January 2011
Guide to Thin Section Microscopy |
Colour and pleochrosim |
In optically anisotropic substances (non-cubic minerals), absorption is a directional property. Thus, crystals of a single mineral species can display different colours dependent on their orientation and corresponding light vibration directions. Colours and pleochroism are mineral-specific properties.
The majority of minerals do not show any, or only weak, pleochroism. Exceptions displaying strong pleochroism are tourmaline, members of the amphibole group, Fe-Ti-rich biotites, and less common minerals such as piemontite, sapphirine, dumortierite and yoderite. Fig. 4.2.1-3 shows examples of distinct to strong pleochroism.
Figure 4.2.1-3: Examples of distinct to strong pleochroism.
A. Piemontite; B. Glaucophane; C. Sapphirine; D. Viridine; E. Thulite; F. Yoderite (source: Dr. N. Jöns); G. Chloritoid; H. Biotite; I. Ti-rich biotite; J. Lazulite; K. Aegirine augite; L. Fe3+-rich epidote (pistacite).
59

Guide to Thin Section Microscopy |
Colour and pleochrosim |
Pleochroic minerals of tetragonal, hexagonal and trigonal symmetry show two specific absorption colours (dichroism), parallel to the vibration directions of the E- and O-waves. Sections orthogonal to the crystallographic c-axis (= optic axis) generally show the absorption colour of the O-wave as the microscope stage is rotated. Sections parallel to the c-axis show an alternation between the absorption colour of the E-wave (E-W orientation of the c-axis) and the O-wave (N-S orientation of the c-axis) for every 90° rotation of the stage (Fig. 4.2.1-4 and 4.2.1-5: example tourmaline).
Figure 4.2.1-4: Change of absorption colour of tourmaline during a 360° rotation of the microscope stage. Shown are the four positions of a crystal section in which the vibration directions of the two waves coincide exactly with the directions of the polarizers. In these orientations, only the E-W vibrating wave passes the crystal; the N-S wave is not activated.
Pleochroic minerals of orthorhombic, monoclinic and triclinic symmetry possess three characteristic absorption colours (pleochroism) related to vibration directions parallel to the principal indicatrix axes X, Y and Z. The determination of these colours must be performed on selected crystal sections that are parallel to two of these axes (Fig. 4.2.1-7A-C). The relation between crystal orientation, vibration direction and absorption (pleochroism) for members of the amphibole group is explained in Figs 4.2.1-8,9,10. As the example of the amphiboles demonstrates beautifully, there is a correlation between absorption colour and chemical composition (Fig. 4.2.1-6).
Raith, Raase, Reinhardt – January 2011
Figure 4.2.1-6: Colours of amphiboles of different composition, in relation to the principal vibration direction parallel b. The amphibole grains are oriented such that the b-axis is in alignment with the lower polarizer. In these minerals, b is parallel to the indicatrix axis Y. Hence, the colours displayed correlate with Y (cf. Fig. 4.2.1-7B).
60

Guide to Thin Section Microscopy |
Colour and pleochrosim |
Raith, Raase, Reinhardt – January 2011
Figure 4.2.1-5: Determination of the colours relating to the vibration directions of the E- and O-waves of an optically uniaxial mineral, using tourmaline as an example.
61

Guide to Thin Section Microscopy |
Colour and pleochrosim |
|
|
|
|
Raith, Raase, Reinhardt – January 2011
Figure 4.2.1-7A-C: Change of absorption colour in crystal sections of biotite, actinolite and aegirine-augite as the stage is rotated 360°. Shown are the four positions in which the vibration directions of the two waves coincide exactly with the directions of the polarizers. In these orientations only the E-W vibrating wave passes the crystal; the N-S wave is not activated. Therefore, these crystal sections change their colour every 90° of rotation. In the actinolite and aegirine-augite sections, these are the colours relating to the ny and nx’ waves, and in biotite, the colours relating to the nz§y and nx waves.
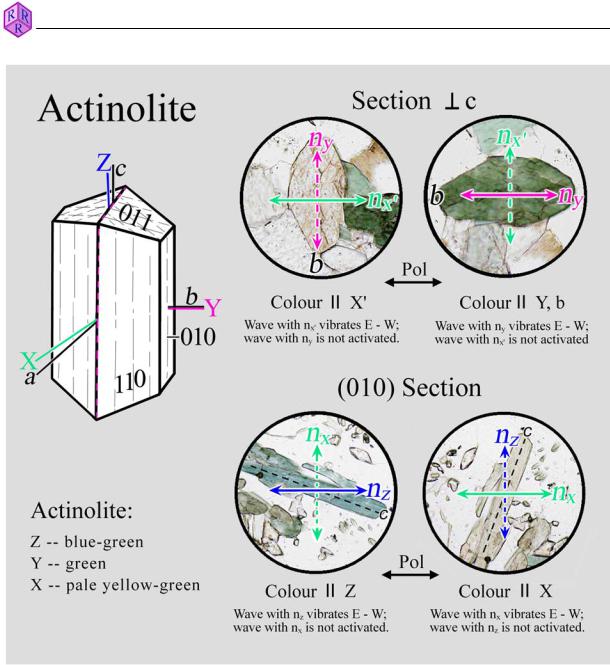
As far as clinoamphiboles are concerned, the absorption colours parallel to X, Y and Z are determined in two specific sections (Figs. 4.2.1-8,9,10):
(1)In crystal sections parallel to (010), the vibration directions Z and X are in the viewing plane, except for some rare alkaline amphiboles. Such sections are commonly prismatic in shape and can be recognised by their high interference colours (G = nz-nx) (see Ch. 4.2.3).
(2)In crystal sections perpendicular to c, the vibration directions Y (parallel to b) and X’ are in the viewing plane. These crystal sections are recognised by the characteristic intersection of the {110} cleavage planes.
Crystal sections perpendicular to one of the two optic axes appear in a single colour corresponding to Y as the stage is turned (ny wave only).
62
Guide to Thin Section Microscopy |
Colour and pleochrosim |
|
|
|
|
Figure 4.2.1-8: Determination of the colours for the principal vibration directions Z, Y and X of an optically biaxial mineral, using actinolite, Ca2(Mg,Fe2+)5 [Si8O22](OH)2, as an example.
Raith, Raase, Reinhardt – January 2011
63

Guide to Thin Section Microscopy |
Colour and pleochrosim |
|
|
|
|
Figure 4.2.1-9: Determination of the colours in the principal vibration directions Z, Y and X of an optically biaxial mineral, using kaersutite, NaCa2Mg3Fe2+ (Ti,Fe3+)[Al2Si6O22](OH)2, as an example.
Raith, Raase, Reinhardt – January 2011
64