


 Coal
Coal
Proved reserves at end 2012
|
|
Anthracite |
Sub- |
|
|
|
|
|
and |
bituminous |
|
Share |
|
|
Million tonnes |
bituminous |
and lignite |
Total |
of total |
R/P ratio |
|
US |
108501 |
128794 |
237295 |
27.6% |
257 |
|
Canada |
3474 |
3108 |
6582 |
0.8% |
98 |
|
Mexico |
860 |
351 |
1211 |
0.1% |
88 |
|
Total North America |
112835 |
132253 |
245088 |
28.5% |
244 |
|
Brazil |
– |
4559 |
4559 |
0.5% |
* |
|
Colombia |
6366 |
380 |
6746 |
0.8% |
76 |
|
Venezuela |
479 |
– |
479 |
0.1% |
292 |
|
Other S. & Cent. America |
45 |
679 |
724 |
0.1% |
* |
|
Total S. & Cent. America |
6890 |
5618 |
12508 |
1.5% |
129 |
|
Bulgaria |
2 |
2364 |
2366 |
0.3% |
72 |
|
Czech Republic |
192 |
908 |
1100 |
0.1% |
20 |
|
Germany |
99 |
40600 |
40699 |
4.7% |
207 |
|
Greece |
– |
3020 |
3020 |
0.4% |
50 |
|
Hungary |
13 |
1647 |
1660 |
0.2% |
179 |
|
Kazakhstan |
21500 |
12100 |
33600 |
3.9% |
289 |
|
Poland |
4338 |
1371 |
5709 |
0.7% |
40 |
|
Romania |
10 |
281 |
291 |
|
9 |
|
|
|||||
|
Russian Federation |
49088 |
107922 |
157010 |
18.2% |
443 |
|
Spain |
200 |
330 |
530 |
0.1% |
85 |
|
Turkey |
529 |
1814 |
2343 |
0.3% |
33 |
|
Ukraine |
15351 |
18522 |
33873 |
3.9% |
384 |
|
United Kingdom |
228 |
– |
228 |
|
14 |
|
|
|||||
|
Other Europe & Eurasia |
1440 |
20735 |
22175 |
2.6% |
234 |
|
Total Europe & Eurasia |
92990 |
211614 |
304604 |
35.4% |
238 |
|
South Africa |
30156 |
– |
30156 |
3.5% |
116 |
|
Zimbabwe |
502 |
– |
502 |
0.1% |
196 |
|
Other Africa |
860 |
174 |
1034 |
0.1% |
* |
|
Middle East |
1203 |
– |
1203 |
0.1% |
* |
|
Total Middle East & Africa |
32721 |
174 |
32895 |
3.8% |
124 |
|
Australia |
37100 |
39300 |
76400 |
8.9% |
177 |
|
China |
62200 |
52300 |
114500 |
13.3% |
31 |
|
India |
56100 |
4500 |
60600 |
7.0% |
100 |
|
Indonesia |
1520 |
4009 |
5529 |
0.6% |
14 |
|
Japan |
340 |
10 |
350 |
|
265 |
|
|
|||||
|
New Zealand |
33 |
538 |
571 |
0.1% |
115 |
|
North Korea |
300 |
300 |
600 |
0.1% |
19 |
|
Pakistan |
– |
2070 |
2070 |
0.2% |
* |
|
South Korea |
– |
126 |
126 |
|
60 |
|
|
|||||
|
Thailand |
– |
1239 |
1239 |
0.1% |
68 |
|
Vietnam |
150 |
– |
150 |
|
4 |
|
|
|||||
|
Other Asia Pacific |
1583 |
2125 |
3708 |
0.4% |
88 |
|
Total Asia Pacific |
159326 |
106517 |
265843 |
30.9% |
51 |
|
Total World |
404762 |
456176 |
860938 |
100.0% |
109 |
|
of which: OECD |
155926 |
222603 |
378529 |
44.0% |
186 |
|
Non-OECD |
248836 |
233573 |
482409 |
56.0% |
83 |
|
European Union |
5101 |
51047 |
56148 |
6.5% |
97 |
|
Former Soviet Union |
86725 |
141309 |
228034 |
26.5% |
390 |
*More than 500 years. |
|
Source of reserves data: Survey of Energy Resources 2010, World Energy Council. |
||||
Less than 0.05%. |
|
|
|
|
|
|
Notes: Proved reserves of coal – Generally taken to be those quantities that geological and engineering information indicates with reasonable certainty can be recovered in the future from
known deposits under existing economic and operating conditions.
Reserves-to-production (R/P) ratio – If the reserves remaining at the end of the year are divided by the production in that year, the result is the length of time that those remaining reserves would last if production were to continue at that rate.
Prices
|
Northwest |
US Central |
Japan coking |
Japan steam |
|
|
Europe |
Appalachian coal |
coal import |
coal import |
Asian marker |
US dollars per tonne |
marker price† |
spot price index‡ |
cif price |
cif price |
price† |
1992 |
38.53 |
28.53 |
57.82 |
48.45 |
– |
1993 |
33.68 |
29.85 |
55.26 |
45.71 |
– |
1994 |
37.18 |
31.72 |
51.77 |
43.66 |
– |
1995 |
44.50 |
27.01 |
54.47 |
47.58 |
– |
1996 |
41.25 |
29.86 |
56.68 |
49.54 |
– |
1997 |
38.92 |
29.76 |
55.51 |
45.53 |
– |
1998 |
32.00 |
31.00 |
50.76 |
40.51 |
29.48 |
1999 |
28.79 |
31.29 |
42.83 |
35.74 |
27.82 |
2000 |
35.99 |
29.90 |
39.69 |
34.58 |
31.76 |
2001 |
39.03 |
50.15 |
41.33 |
37.96 |
36.89 |
2002 |
31.65 |
33.20 |
42.01 |
36.90 |
30.41 |
2003 |
43.60 |
38.52 |
41.57 |
34.74 |
36.53 |
2004 |
72.08 |
64.90 |
60.96 |
51.34 |
72.42 |
2005 |
60.54 |
70.12 |
89.33 |
62.91 |
61.84 |
2006 |
64.11 |
62.96 |
93.46 |
63.04 |
56.47 |
2007 |
88.79 |
51.16 |
88.24 |
69.86 |
84.57 |
2008 |
147.67 |
118.79 |
179.03 |
122.81 |
148.06 |
2009 |
70.66 |
68.08 |
167.82 |
110.11 |
78.81 |
2010 |
92.50 |
71.63 |
158.95 |
105.19 |
105.43 |
2011 |
121.52 |
87.38 |
229.12 |
136.21 |
125.74 |
2012 |
92.50 |
72.06 |
191.46 |
133.61 |
105.50 |
†Source: IHS McCloskey Northwest Europe prices for 1992-2000 are the average of the monthly marker, 2001-2012 the average of weekly prices. The Asian prices are the average of the monthly marker.
‡Source: Platts. Prices are for Central Appalachian 12,500Btu, 1.2 SO2 coal, fob. Prices for 1992-2000 are by coal price publication date, 2001-2012 by coal price assessment date. Note: cif = cost+insurance+freight (average prices); fob = free on board.
30
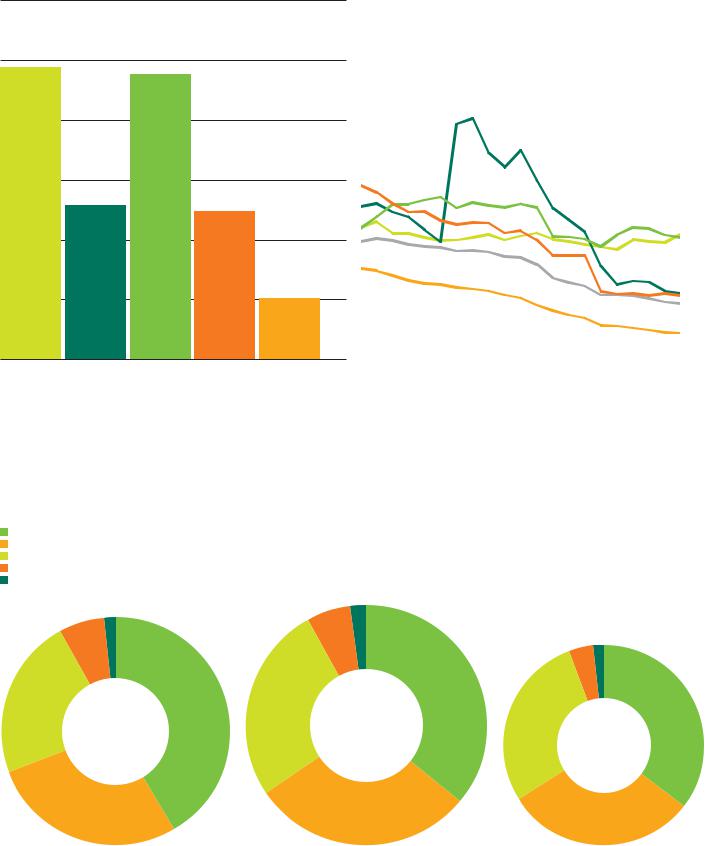
Reserves-to-production (R/P) ratios
Years
2012 by region
|
|
|
|
|
300 |
|
|
|
|
|
250 |
|
|
|
|
|
200 |
|
|
|
|
|
150 |
|
|
|
|
|
100 |
|
|
|
|
|
50 |
North |
S. & Cent. |
Europe & |
Middle East |
Asia |
0 |
America |
America |
Eurasia |
& Africa |
Pacific |
|
History
|
|
North America |
|
|
|
700 |
|
|
|
|
|
||
|
|
S. & Cent. America |
|
|
|
|
|
|
|
|
|
|
|
|
|
|
|
|
|
|
|
|
Europe & Eurasia |
|
|
|
|
|
|
|
|
|
|
|
|
|
Middle East & Africa |
|
|
|
|
|
|
|
|
|
|
|
|
|
Asia Pacific |
|
|
|
|
|
|
|
|
|
600 |
|
|
|
|
|
|
||
|
|
World |
|
|
|
|
|
|
|
|
|
|
|
|
|
|
|
|
|
|
|
|
|
|
|
|
500 |
|
|
|
|
|
|
|
|
|
|
|
|
|
400 |
|
|
|
|
|
|
|
|
|
|
|
|
|
300 |
|
|
|
|
|
|
|
|
|
|
|
|
|
200 |
|
|
|
|
|
|
|
|
|
|
|
|
|
100 |
|
|
|
|
|
|
|
92 |
97 |
02 |
07 |
12 |
0 |
|
World proved reserves of coal in 2012 were sufficient to meet 109 years of global production, by far the largest R/P ratio for any fossil fuel. Europe & Eurasia holds the largest regional reserves while North America has the highest R/P ratio. The US holds the largest individual reserves, followed by Russia and China.
Distribution of proved reserves in 1992, 2002 and 2012
Percentage
Europe & Eurasia
Asia Pacific
North America
Middle East & Africa
S. & Cent. America
|
|
2.2 |
36.1 |
|
|
1.4 |
41.4 |
5.8 |
|
|
|
6.4 |
|
|
|
|
|
|
|
|
3.8 |
1.5 |
35.4 |
1992 |
2002 |
|
|
Total 984453 |
|
||
Total 981780 |
2012 |
||
million tonnes |
|||
million tonnes |
Total 860938 |
||
|
22.8 |
|
|
million tonnes |
|
|
|
|
|
26.2 |
|
28.5 |
|
|
|
|
|
|
29.7 |
30.9 |
|
|
|
|
|
27.9 |
|
|
|
|
|
Source: Survey of Energy Resources 2010, World Energy Council. |
31

Production*
|
|
|
|
|
|
|
|
|
|
|
|
Change |
2012 |
|
|
|
|
|
|
|
|
|
|
|
|
2012 over |
share of |
Million tonnes oil equivalent |
2002 |
2003 |
2004 |
2005 |
2006 |
2007 |
2008 |
2009 |
2010 |
2011 |
2012 |
2011 |
total |
US |
570.1 |
553.6 |
572.4 |
580.2 |
595.1 |
587.7 |
596.7 |
540.8 |
551.2 |
556.1 |
515.9 |
-7.5% |
13.4% |
Canada |
34.3 |
31.8 |
33.9 |
35.3 |
34.8 |
35.7 |
35.6 |
33.1 |
35.4 |
35.5 |
35.2 |
-1.1% |
0.9% |
Mexico |
5.3 |
4.6 |
4.7 |
5.2 |
5.5 |
6.0 |
5.5 |
5.0 |
5.8 |
7.0 |
6.6 |
-5.3% |
0.2% |
Total North America |
609.6 |
590.1 |
611.0 |
620.7 |
635.4 |
629.4 |
637.8 |
578.9 |
592.4 |
598.5 |
557.7 |
-7.1% |
14.5% |
Brazil |
1.9 |
1.8 |
2.0 |
2.4 |
2.2 |
2.3 |
2.5 |
1.9 |
2.0 |
2.1 |
2.2 |
5.7% |
0.1% |
Colombia |
25.7 |
32.5 |
34.9 |
38.4 |
42.6 |
45.4 |
47.8 |
47.3 |
48.3 |
55.8 |
58.0 |
3.7% |
1.5% |
Venezuela |
5.9 |
5.1 |
5.9 |
5.3 |
5.7 |
4.5 |
3.6 |
2.4 |
2.0 |
1.7 |
1.2 |
-27.9% |
|
|
|||||||||||||
Other S. & Cent. America |
0.4 |
0.5 |
0.2 |
0.3 |
0.6 |
0.3 |
0.4 |
0.5 |
0.3 |
0.4 |
0.5 |
9.3% |
|
|
|||||||||||||
Total S. & Cent. America |
33.9 |
39.9 |
43.0 |
46.3 |
51.2 |
52.5 |
54.3 |
52.2 |
52.7 |
59.9 |
61.8 |
2.9% |
1.6% |
Bulgaria |
4.3 |
4.5 |
4.4 |
4.1 |
4.2 |
4.7 |
4.8 |
4.5 |
4.9 |
6.1 |
5.4 |
-12.1% |
0.1% |
Czech Republic |
24.3 |
24.2 |
23.5 |
23.5 |
23.8 |
23.6 |
22.8 |
21.0 |
20.8 |
21.6 |
20.7 |
-4.2% |
0.5% |
France |
1.1 |
1.3 |
0.4 |
0.2 |
0.2 |
0.2 |
0.1 |
† |
0.1 |
0.1 |
0.1 |
-0.3% |
|
|
|||||||||||||
Germany |
55.0 |
54.1 |
54.7 |
53.2 |
50.3 |
51.5 |
47.7 |
44.4 |
43.7 |
44.6 |
45.7 |
2.0% |
1.2% |
Greece |
9.1 |
9.0 |
9.6 |
9.4 |
8.6 |
9.0 |
8.8 |
8.6 |
7.8 |
7.9 |
7.9 |
-0.5% |
0.2% |
Hungary |
2.7 |
2.8 |
2.4 |
2.0 |
2.1 |
2.0 |
1.9 |
1.9 |
1.9 |
2.0 |
1.9 |
-3.0% |
|
|
|||||||||||||
Kazakhstan |
37.8 |
43.3 |
44.4 |
44.2 |
49.1 |
50.0 |
56.8 |
51.5 |
54.0 |
56.2 |
58.8 |
4.2% |
1.5% |
Poland |
71.3 |
71.4 |
70.5 |
68.7 |
67.0 |
62.3 |
60.5 |
56.4 |
55.5 |
56.6 |
58.8 |
3.6% |
1.5% |
Romania |
6.6 |
7.0 |
6.7 |
6.6 |
6.5 |
6.7 |
6.7 |
6.4 |
5.8 |
6.7 |
6.4 |
-4.3% |
0.2% |
Russian Federation |
117.3 |
127.1 |
131.7 |
139.2 |
145.1 |
148.0 |
153.4 |
142.1 |
151.1 |
158.0 |
168.1 |
6.1% |
4.4% |
Spain |
7.2 |
6.8 |
6.7 |
6.4 |
6.1 |
5.7 |
4.1 |
3.8 |
3.4 |
2.5 |
2.4 |
-5.5% |
0.1% |
Turkey |
11.5 |
10.4 |
10.1 |
12.6 |
13.7 |
16.0 |
16.8 |
17.1 |
15.8 |
16.3 |
15.4 |
-5.6% |
0.4% |
Ukraine |
42.8 |
41.6 |
42.2 |
41.0 |
41.7 |
39.9 |
41.3 |
38.4 |
39.9 |
44.0 |
45.9 |
4.0% |
1.2% |
United Kingdom |
18.2 |
17.2 |
15.3 |
12.5 |
11.3 |
10.3 |
11.0 |
10.9 |
11.2 |
11.3 |
10.2 |
-10.1% |
0.3% |
Other Europe & Eurasia |
17.9 |
19.0 |
18.5 |
17.7 |
18.5 |
20.6 |
21.0 |
20.3 |
20.1 |
21.5 |
21.2 |
-1.5% |
0.6% |
Total Europe & Eurasia |
427.2 |
439.8 |
441.0 |
441.2 |
448.2 |
450.7 |
457.8 |
427.2 |
436.0 |
455.5 |
469.0 |
2.7% |
12.2% |
Total Middle East |
0.6 |
0.7 |
0.8 |
1.0 |
1.0 |
1.0 |
1.0 |
0.7 |
0.6 |
0.7 |
0.7 |
-0.3% |
|
|
|||||||||||||
South Africa |
124.1 |
134.1 |
137.2 |
137.7 |
138.0 |
139.6 |
142.4 |
141.2 |
145.0 |
141.8 |
146.6 |
3.1% |
3.8% |
Zimbabwe |
2.5 |
1.8 |
2.4 |
2.2 |
1.4 |
1.3 |
1.0 |
1.1 |
1.7 |
1.7 |
1.7 |
-0.3% |
|
|
|||||||||||||
Other Africa |
1.3 |
1.6 |
1.3 |
1.2 |
1.3 |
1.0 |
1.0 |
0.9 |
1.1 |
1.1 |
1.1 |
-0.3% |
|
|
|||||||||||||
Total Africa |
128.0 |
137.5 |
140.9 |
141.1 |
140.6 |
141.9 |
144.4 |
143.2 |
147.8 |
144.5 |
149.3 |
3.0% |
3.9% |
Australia |
184.3 |
189.4 |
196.8 |
205.7 |
210.8 |
217.1 |
224.1 |
232.1 |
236.0 |
230.8 |
241.1 |
4.2% |
6.3% |
China |
775.2 |
917.4 |
1061.3 |
1174.8 |
1264.3 |
1345.8 |
1401.0 |
1486.5 |
1617.5 |
1758.0 |
1825.0 |
3.5% |
47.5% |
India |
138.5 |
144.4 |
155.7 |
162.1 |
170.2 |
181.0 |
195.6 |
210.8 |
217.5 |
215.7 |
228.8 |
5.8% |
6.0% |
Indonesia |
63.5 |
70.3 |
81.4 |
93.9 |
119.2 |
133.4 |
147.8 |
157.6 |
169.2 |
217.3 |
237.4 |
9.0% |
6.2% |
Japan |
0.8 |
0.7 |
0.7 |
0.6 |
0.7 |
0.8 |
0.7 |
0.7 |
0.5 |
0.7 |
0.7 |
3.6% |
|
|
|||||||||||||
New Zealand |
2.8 |
3.2 |
3.3 |
3.3 |
3.6 |
3.0 |
3.0 |
2.8 |
3.3 |
3.1 |
3.1 |
-0.3% |
0.1% |
Pakistan |
1.6 |
1.5 |
1.5 |
1.6 |
1.7 |
1.6 |
1.8 |
1.6 |
1.5 |
1.4 |
1.2 |
-13.5% |
|
|
|||||||||||||
South Korea |
1.5 |
1.5 |
1.4 |
1.3 |
1.3 |
1.3 |
1.2 |
1.1 |
0.9 |
0.9 |
0.9 |
0.1% |
|
|
|||||||||||||
Thailand |
5.7 |
5.3 |
5.6 |
5.8 |
5.3 |
5.1 |
5.0 |
5.0 |
5.1 |
6.0 |
5.1 |
-14.3% |
0.1% |
Vietnam |
9.2 |
10.8 |
14.7 |
18.3 |
21.8 |
22.4 |
23.0 |
25.2 |
24.6 |
24.9 |
23.5 |
-6.1% |
0.6% |
Other Asia Pacific |
19.6 |
20.3 |
22.1 |
24.9 |
25.3 |
24.0 |
25.8 |
28.8 |
36.9 |
41.1 |
40.0 |
-3.1% |
1.0% |
Total Asia Pacific |
1202.7 |
1364.9 |
1544.5 |
1692.2 |
1824.2 |
1935.6 |
2028.9 |
2152.1 |
2313.2 |
2499.9 |
2606.8 |
4.0% |
67.8% |
Total World |
2401.9 |
2572.7 |
2781.3 |
2942.4 |
3100.7 |
3211.1 |
3324.2 |
3354.3 |
3542.7 |
3759.1 |
3845.3 |
2.0% |
100.0% |
of which: OECD |
1006.3 |
990.0 |
1013.4 |
1026.1 |
1041.4 |
1040.3 |
1048.0 |
986.7 |
1000.2 |
1003.7 |
973.4 |
-3.3% |
25.3% |
Non-OECD |
1395.6 |
1582.7 |
1767.9 |
1916.3 |
2059.3 |
2170.8 |
2276.2 |
2367.6 |
2542.5 |
2755.4 |
2871.9 |
3.9% |
74.7% |
European Union |
205.0 |
203.8 |
199.1 |
191.3 |
184.6 |
181.3 |
173.4 |
162.7 |
160.5 |
165.0 |
165.1 |
-0.2% |
4.3% |
Former Soviet Union |
201.4 |
215.8 |
222.2 |
228.5 |
239.9 |
242.5 |
256.2 |
236.5 |
250.1 |
263.8 |
278.6 |
5.3% |
7.2% |
*Commercial solid fuels only, i.e. bituminous coal and anthracite (hard coal), and lignite and brown (sub-bituminous) coal.Less than 0.05%.
Notes: Coal production data expressed in million tonnes is available at bp.com/statisticalreview.
Growth rates are adjusted for leap years.
32

Consumption*
|
|
|
|
|
|
|
|
|
|
|
|
Change |
2012 |
|
|
|
|
|
|
|
|
|
|
|
|
2012 over |
share of |
Million tonnes oil equivalent |
2002 |
2003 |
2004 |
2005 |
2006 |
2007 |
2008 |
2009 |
2010 |
2011 |
2012 |
2011 |
total |
US |
552.0 |
562.5 |
566.1 |
574.2 |
565.7 |
573.3 |
564.1 |
496.2 |
523.9 |
495.5 |
437.8 |
-11.9% |
11.7% |
Canada |
31.8 |
31.7 |
29.8 |
30.9 |
29.9 |
31.3 |
29.6 |
24.4 |
25.0 |
22.3 |
21.9 |
-2.2% |
0.6% |
Mexico |
6.8 |
7.9 |
6.6 |
8.2 |
8.2 |
8.2 |
6.7 |
7.7 |
8.5 |
8.9 |
8.8 |
-0.7% |
0.2% |
Total North America |
590.5 |
602.1 |
602.6 |
613.3 |
603.7 |
612.7 |
600.4 |
528.4 |
557.5 |
526.7 |
468.5 |
-11.3% |
12.6% |
Argentina |
0.5 |
0.7 |
0.8 |
0.9 |
0.3 |
0.4 |
1.1 |
1.2 |
1.0 |
0.9 |
1.0 |
4.4% |
|
|
|||||||||||||
Brazil |
10.8 |
11.1 |
12.0 |
11.9 |
11.8 |
12.6 |
12.7 |
10.8 |
13.3 |
14.1 |
13.5 |
-4.4% |
0.4% |
Chile |
2.4 |
2.3 |
2.6 |
2.6 |
3.2 |
3.8 |
4.1 |
3.7 |
4.2 |
5.3 |
6.7 |
25.1% |
0.2% |
Colombia |
2.2 |
2.4 |
2.0 |
2.7 |
2.4 |
2.4 |
2.8 |
3.5 |
4.0 |
4.3 |
4.0 |
-7.3% |
0.1% |
Ecuador |
– |
– |
– |
– |
– |
– |
– |
– |
– |
– |
– |
– |
– |
Peru |
0.7 |
0.7 |
0.7 |
0.8 |
0.6 |
0.8 |
0.8 |
0.8 |
0.8 |
0.7 |
0.8 |
6.0% |
|
|
|||||||||||||
Trinidad & Tobago |
– |
– |
– |
– |
– |
– |
– |
– |
– |
– |
– |
– |
– |
Venezuela |
† |
† |
– |
† |
† |
0.1 |
0.1 |
0.2 |
0.2 |
0.2 |
0.2 |
5.3% |
|
|
|||||||||||||
Other S. & Cent. America |
0.9 |
2.0 |
1.8 |
1.6 |
1.8 |
1.9 |
2.0 |
1.9 |
2.0 |
2.0 |
2.0 |
2.5% |
0.1% |
Total S. & Cent. America |
17.5 |
19.2 |
20.0 |
20.5 |
20.2 |
22.0 |
23.5 |
22.0 |
25.4 |
27.6 |
28.2 |
2.0% |
0.8% |
Austria |
3.0 |
3.3 |
3.3 |
3.1 |
3.1 |
3.0 |
2.8 |
2.3 |
2.5 |
2.6 |
2.0 |
-23.8% |
0.1% |
Azerbaijan |
† |
† |
† |
† |
† |
† |
† |
† |
† |
† |
† |
3.8% |
|
|
|||||||||||||
Belarus |
0.1 |
0.1 |
0.1 |
0.1 |
0.1 |
† |
† |
† |
† |
† |
† |
1.2% |
|
|
|||||||||||||
Belgium |
6.0 |
5.8 |
5.6 |
5.0 |
4.8 |
4.4 |
3.9 |
3.1 |
3.3 |
3.3 |
3.0 |
-9.5% |
0.1% |
Bulgaria |
6.5 |
7.2 |
7.1 |
6.8 |
6.9 |
7.7 |
7.5 |
6.4 |
6.8 |
8.1 |
7.0 |
-13.4% |
0.2% |
Czech Republic |
20.6 |
20.8 |
20.9 |
20.4 |
21.1 |
21.2 |
19.9 |
17.4 |
18.2 |
18.0 |
16.6 |
-7.8% |
0.4% |
Denmark |
4.2 |
5.7 |
4.6 |
3.7 |
5.6 |
4.7 |
4.1 |
4.0 |
3.8 |
3.2 |
2.5 |
-23.4% |
0.1% |
Finland |
4.1 |
5.5 |
5.0 |
2.9 |
4.7 |
4.4 |
3.0 |
3.3 |
4.3 |
3.4 |
2.9 |
-15.1% |
0.1% |
France |
12.7 |
13.6 |
13.5 |
13.8 |
12.5 |
13.4 |
12.7 |
10.5 |
11.3 |
9.5 |
11.4 |
20.1% |
0.3% |
Germany |
84.6 |
87.2 |
85.4 |
82.1 |
83.5 |
85.7 |
80.1 |
71.7 |
76.6 |
76.0 |
79.2 |
3.9% |
2.1% |
Greece |
9.8 |
9.4 |
9.0 |
8.8 |
8.1 |
8.5 |
8.1 |
8.1 |
7.4 |
7.5 |
7.5 |
-0.5% |
0.2% |
Hungary |
3.4 |
3.6 |
3.3 |
3.0 |
3.2 |
3.4 |
3.3 |
2.7 |
3.0 |
3.0 |
3.0 |
-1.9% |
0.1% |
Republic of Ireland |
1.8 |
1.7 |
1.8 |
1.9 |
1.6 |
1.6 |
1.4 |
1.2 |
1.2 |
1.3 |
1.5 |
16.9% |
|
|
|||||||||||||
Italy |
13.3 |
14.0 |
16.0 |
16.0 |
16.4 |
16.6 |
16.4 |
12.9 |
14.3 |
16.1 |
16.2 |
0.3% |
0.4% |
Kazakhstan |
22.8 |
25.2 |
26.5 |
27.2 |
29.8 |
31.7 |
33.4 |
32.6 |
31.6 |
34.0 |
35.0 |
2.6% |
0.9% |
Lithuania |
0.1 |
0.2 |
0.2 |
0.2 |
0.2 |
0.2 |
0.2 |
0.1 |
0.2 |
0.2 |
0.2 |
-5.5% |
|
|
|||||||||||||
Netherlands |
8.9 |
9.1 |
9.1 |
8.7 |
8.5 |
9.0 |
8.5 |
7.9 |
7.9 |
7.8 |
8.5 |
8.2% |
0.2% |
Norway |
0.8 |
0.7 |
0.8 |
0.7 |
0.6 |
0.7 |
0.7 |
0.5 |
0.6 |
0.7 |
0.7 |
-0.5% |
|
|
|||||||||||||
Poland |
56.7 |
57.7 |
57.3 |
55.7 |
58.0 |
57.9 |
56.0 |
51.9 |
56.4 |
56.1 |
54.0 |
-4.0% |
1.4% |
Portugal |
4.1 |
3.8 |
3.7 |
3.8 |
3.8 |
3.3 |
2.5 |
2.9 |
1.7 |
2.2 |
2.9 |
31.4% |
0.1% |
Romania |
7.6 |
7.8 |
7.4 |
7.6 |
8.5 |
7.4 |
7.4 |
6.6 |
6.1 |
7.3 |
6.7 |
-9.5% |
0.2% |
Russian Federation |
103.0 |
104.0 |
99.5 |
94.2 |
96.7 |
93.4 |
100.4 |
91.9 |
90.2 |
93.7 |
93.9 |
|
2.5% |
|
|||||||||||||
Slovakia |
4.0 |
4.2 |
4.1 |
3.9 |
3.8 |
3.8 |
3.7 |
3.5 |
3.4 |
3.3 |
3.2 |
-3.5% |
0.1% |
Spain |
22.7 |
21.0 |
22.0 |
22.5 |
19.8 |
21.9 |
15.5 |
11.8 |
9.8 |
15.5 |
19.3 |
24.2% |
0.5% |
Sweden |
2.2 |
2.2 |
2.3 |
2.2 |
2.3 |
2.2 |
2.0 |
1.6 |
2.1 |
2.0 |
1.5 |
-25.7% |
|
|
|||||||||||||
Switzerland |
0.1 |
0.1 |
0.1 |
0.1 |
0.1 |
0.2 |
0.1 |
0.1 |
0.1 |
0.1 |
0.1 |
6.5% |
|
|
|||||||||||||
Turkey |
19.3 |
20.7 |
21.8 |
21.8 |
25.9 |
28.9 |
29.2 |
30.4 |
30.9 |
33.1 |
31.3 |
-5.6% |
0.8% |
Turkmenistan |
– |
– |
– |
– |
– |
– |
– |
– |
– |
– |
– |
–- |
– |
Ukraine |
38.9 |
40.3 |
39.1 |
37.4 |
39.7 |
39.7 |
40.2 |
35.1 |
37.9 |
41.5 |
44.6 |
6.9% |
1.2% |
United Kingdom |
35.7 |
38.1 |
36.6 |
37.4 |
40.9 |
38.4 |
35.6 |
29.9 |
31.0 |
31.5 |
39.1 |
24.0% |
1.0% |
Uzbekistan |
1.0 |
0.7 |
1.2 |
1.2 |
1.7 |
1.4 |
1.4 |
1.1 |
1.1 |
1.2 |
1.2 |
-0.3% |
|
|
|||||||||||||
Other Europe & Eurasia |
21.9 |
23.1 |
23.7 |
22.1 |
19.2 |
20.5 |
21.0 |
19.7 |
21.1 |
22.5 |
22.2 |
-1.7% |
0.6% |
Total Europe & Eurasia |
520.1 |
536.9 |
531.2 |
514.5 |
531.3 |
535.1 |
521.0 |
471.4 |
484.8 |
504.6 |
516.9 |
2.2% |
13.9% |
Iran |
1.1 |
1.1 |
1.2 |
1.3 |
1.2 |
1.3 |
0.9 |
1.0 |
0.9 |
0.9 |
0.9 |
-2.1% |
|
|
|||||||||||||
Israel |
7.6 |
7.9 |
8.0 |
7.9 |
7.8 |
8.0 |
7.9 |
7.7 |
7.7 |
7.9 |
8.8 |
10.8% |
0.2% |
Kuwait |
– |
– |
– |
– |
– |
– |
– |
– |
– |
– |
– |
– |
– |
Qatar |
– |
– |
– |
– |
– |
– |
– |
– |
– |
– |
– |
– |
– |
Saudi Arabia |
– |
– |
– |
– |
– |
– |
– |
– |
– |
– |
– |
– |
– |
United Arab Emirates |
– |
– |
– |
– |
– |
– |
– |
– |
– |
– |
– |
– |
– |
Other Middle East |
0.1 |
0.1 |
0.1 |
0.1 |
0.1 |
0.2 |
0.2 |
0.1 |
0.2 |
0.2 |
0.2 |
-2.6% |
|
|
|||||||||||||
Total Middle East |
8.9 |
9.1 |
9.2 |
9.3 |
9.2 |
9.5 |
9.0 |
8.9 |
8.8 |
9.0 |
9.9 |
9.2% |
0.3% |
Algeria |
0.6 |
0.6 |
0.6 |
0.6 |
0.6 |
0.6 |
0.6 |
0.2 |
– |
– |
– |
– |
– |
Egypt |
1.2 |
1.2 |
1.2 |
1.2 |
1.2 |
1.2 |
1.1 |
1.1 |
1.1 |
1.1 |
1.1 |
1.9% |
|
|
|||||||||||||
South Africa |
76.2 |
81.4 |
85.2 |
84.4 |
85.4 |
90.1 |
96.9 |
92.9 |
90.0 |
89.1 |
89.8 |
0.5% |
2.4% |
Other Africa |
7.1 |
6.3 |
7.1 |
7.3 |
6.8 |
6.2 |
6.4 |
5.4 |
6.4 |
6.5 |
6.6 |
1.1% |
0.2% |
Total Africa |
85.1 |
89.5 |
94.2 |
93.5 |
94.0 |
98.0 |
105.0 |
99.7 |
97.4 |
96.7 |
97.5 |
0.6% |
2.6% |
Australia |
51.1 |
49.4 |
50.8 |
53.5 |
56.0 |
54.1 |
54.6 |
54.5 |
51.6 |
51.7 |
49.3 |
-4.9% |
1.3% |
Bangladesh |
0.4 |
0.4 |
0.4 |
0.4 |
0.5 |
0.4 |
0.6 |
0.6 |
0.6 |
0.7 |
0.7 |
5.8% |
|
|
|||||||||||||
China |
728.4 |
868.2 |
1019.9 |
1128.3 |
1250.4 |
1320.3 |
1369.2 |
1470.7 |
1609.7 |
1760.8 |
1873.3 |
6.1% |
50.2% |
China Hong Kong SAR |
5.4 |
6.6 |
6.6 |
6.7 |
7.0 |
7.5 |
7.0 |
7.6 |
6.3 |
7.7 |
7.6 |
-1.7% |
0.2% |
India |
151.8 |
156.8 |
172.3 |
184.4 |
195.4 |
210.3 |
230.4 |
251.5 |
262.7 |
270.6 |
298.3 |
9.9% |
8.0% |
Indonesia |
18.0 |
24.2 |
22.2 |
25.4 |
30.1 |
37.8 |
30.1 |
34.6 |
41.2 |
48.9 |
50.4 |
2.8% |
1.4% |
Japan |
106.6 |
112.2 |
120.8 |
121.3 |
119.1 |
125.3 |
128.7 |
108.8 |
123.7 |
117.7 |
124.4 |
5.4% |
3.3% |
Malaysia |
3.6 |
5.3 |
6.6 |
6.9 |
7.3 |
8.8 |
9.8 |
10.6 |
14.8 |
14.8 |
14.3 |
-3.2% |
0.4% |
New Zealand |
1.4 |
2.0 |
2.1 |
2.3 |
2.2 |
1.7 |
2.1 |
1.6 |
1.4 |
1.4 |
1.7 |
21.3% |
|
|
|||||||||||||
Pakistan |
2.4 |
2.9 |
3.8 |
4.1 |
4.2 |
5.1 |
5.3 |
4.7 |
4.5 |
4.3 |
4.3 |
-1.8% |
0.1% |
Philippines |
4.7 |
4.7 |
5.0 |
5.7 |
5.5 |
5.9 |
7.0 |
6.7 |
7.7 |
8.3 |
9.4 |
13.2% |
0.3% |
Singapore |
– |
– |
– |
– |
– |
– |
– |
– |
– |
– |
– |
– |
– |
South Korea |
49.1 |
51.1 |
53.1 |
54.8 |
54.8 |
59.7 |
66.1 |
68.6 |
75.9 |
83.6 |
81.8 |
-2.4% |
2.2% |
Taiwan |
32.7 |
35.1 |
36.6 |
38.1 |
39.6 |
41.8 |
40.2 |
38.7 |
40.3 |
41.5 |
41.1 |
-1.2% |
1.1% |
Thailand |
9.2 |
9.4 |
10.4 |
11.2 |
12.4 |
14.1 |
15.3 |
14.5 |
15.3 |
16.0 |
16.0 |
-0.3% |
0.4% |
Vietnam |
5.3 |
5.5 |
8.2 |
8.0 |
9.5 |
10.1 |
10.0 |
14.0 |
13.9 |
15.0 |
14.9 |
-0.8% |
0.4% |
Other Asia Pacific |
19.0 |
19.5 |
19.6 |
21.0 |
22.6 |
19.3 |
21.2 |
20.7 |
20.6 |
21.2 |
21.6 |
1.6% |
0.6% |
Total Asia Pacific |
1188.9 |
1353.2 |
1538.1 |
1672.1 |
1816.8 |
1922.4 |
1997.4 |
2108.4 |
2290.2 |
2464.2 |
2609.1 |
5.6% |
69.9% |
Total World |
2411.0 |
2610.0 |
2795.2 |
2923.2 |
3075.1 |
3199.8 |
3256.3 |
3238.7 |
3464.0 |
3628.8 |
3730.1 |
2.5% |
100.0% |
of which: OECD |
1131.1 |
1160.2 |
1171.1 |
1178.1 |
1180.2 |
1204.0 |
1178.4 |
1055.7 |
1117.2 |
1096.1 |
1053.1 |
-4.2% |
28.2% |
Non-OECD |
1279.9 |
1449.8 |
1624.1 |
1745.1 |
1894.9 |
1995.8 |
2077.9 |
2183.0 |
2346.8 |
2532.7 |
2677.0 |
5.4% |
71.8% |
European Union |
316.6 |
326.9 |
323.1 |
314.4 |
322.2 |
324.1 |
299.7 |
264.4 |
276.7 |
283.4 |
293.7 |
3.4% |
7.9% |
Former Soviet Union |
169.5 |
174.5 |
170.9 |
164.2 |
171.9 |
170.9 |
180.0 |
164.8 |
166.1 |
175.9 |
180.2 |
2.2% |
4.8% |
*Commercial solid fuels only, i.e. bituminous coal and anthracite (hard coal), and lignite and brown (sub-bituminous) coal. †Less than 0.05.
Less than 0.05%.
Notes: Differences between these world consumption figures and the world production statistics are accounted for by stock changes, and unavoidable disparities in the definition, measurement or conversion of coal supply and demand data.
Growth rates are adjusted for leap years.
33
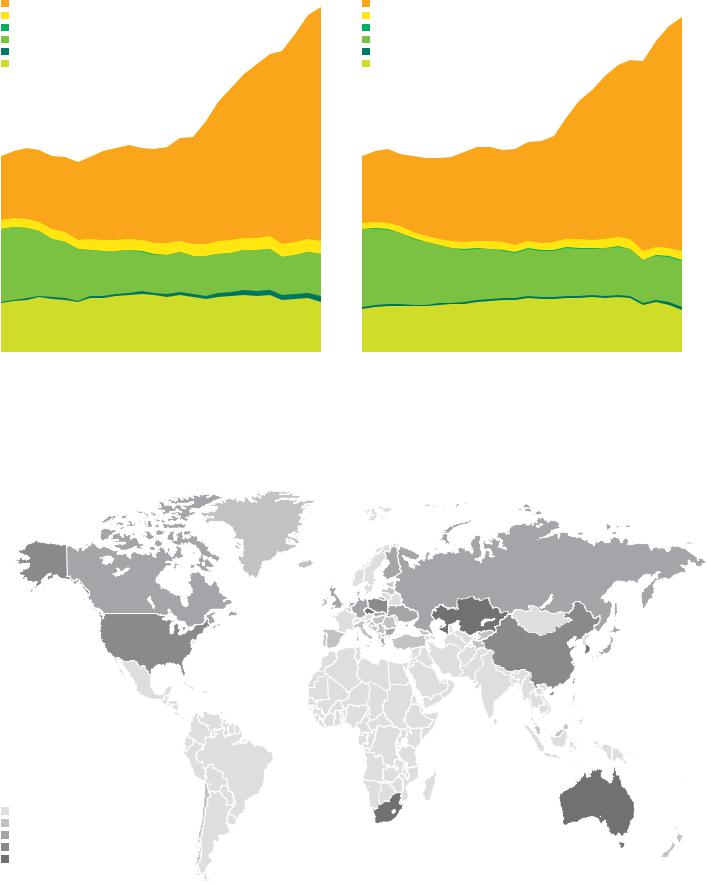
Production by region
Million tonnes oil equivalent
Asia Pacific |
4000 |
|
|
||
Africa |
|
|
Middle East |
|
|
Europe & Eurasia |
|
|
3500 |
||
S. & Cent. America |
||
|
||
North America |
|
|
|
|
|
|
3000 |
|
|
|
|
|
2500 |
|
|
|
|
|
2000 |
|
|
|
|
|
1500 |
|
|
|
|
|
1000 |
|
|
|
|
|
500 |
Consumption by region
Million tonnes oil equivalent
Asia Pacific |
4000 |
|
|
||
Africa |
|
|
Middle East |
|
|
Europe & Eurasia |
|
|
3500 |
||
S. & Cent. America |
||
|
||
North America |
|
|
|
|
|
|
3000 |
|
|
|
|
|
2500 |
|
|
|
|
|
2000 |
|
|
|
|
|
1500 |
|
|
|
|
|
1000 |
|
|
|
|
|
500 |
|
|
|
|
|
|
|
|
|
|
|
|
|
|
|
87 |
92 |
97 |
02 |
07 |
12 |
0 |
87 |
92 |
97 |
02 |
07 |
12 |
0 |
|
Global coal production grew by 2%. The Asia Pacific region accounted for all of the net increase, offsetting a large decline in the US. The Asia Pacific region now accounts for more than two-thirds of global output. Coal consumption increased by a below-average 2.5%. The Asia Pacific region was also responsible for all of the net growth in global consumption. A second consecutive large decline in North America (-11.3%) more than offset growth in other regions; EU consumption grew for a third consecutive year.
Consumption per capita 2012
Tonnes oil equivalent
0-0.25
0.25-0.5
0.5-1.0
1.0-1.5 > 1.5
34