


 Primary energy
Consumption*
|
|
|
|
|
|
|
|
|
|
|
|
Change |
2012 |
|
|
|
|
|
|
|
|
|
|
|
|
2012 over |
share of |
Million tonnes oil equivalent |
2002 |
2003 |
2004 |
2005 |
2006 |
2007 |
2008 |
2009 |
2010 |
2011 |
2012 |
2011 |
total |
US |
2295.5 |
2302.3 |
2348.8 |
2351.2 |
2332.7 |
2372.7 |
2319.8 |
2205.8 |
2281.2 |
2265.2 |
2208.8 |
-2.8% |
17.7% |
Canada |
305.1 |
312.1 |
315.5 |
324.1 |
321.4 |
327.5 |
326.1 |
311.7 |
315.6 |
328.6 |
328.8 |
-0.2% |
2.6% |
Mexico |
140.5 |
147.6 |
153.4 |
164.5 |
168.8 |
167.8 |
170.8 |
171.7 |
173.9 |
180.5 |
187.7 |
3.7% |
1.5% |
Total North America |
2741.1 |
2762.1 |
2817.7 |
2839.8 |
2822.9 |
2867.9 |
2816.7 |
2689.2 |
2770.8 |
2774.3 |
2725.4 |
-2.0% |
21.8% |
Argentina |
56.7 |
61.1 |
64.4 |
68.8 |
71.8 |
74.7 |
76.5 |
75.7 |
77.3 |
80.4 |
82.1 |
1.9% |
0.7% |
Brazil |
186.1 |
189.7 |
199.9 |
206.5 |
212.4 |
225.9 |
236.0 |
235.2 |
257.5 |
269.7 |
274.7 |
1.6% |
2.2% |
Chile |
25.2 |
25.7 |
27.3 |
28.3 |
30.3 |
30.7 |
30.4 |
30.6 |
29.9 |
33.3 |
35.5 |
6.4% |
0.3% |
Colombia |
25.5 |
26.2 |
26.8 |
28.2 |
28.8 |
29.5 |
30.4 |
31.9 |
33.3 |
35.9 |
36.5 |
1.3% |
0.3% |
Ecuador |
8.6 |
8.9 |
9.2 |
9.7 |
10.3 |
10.9 |
11.6 |
11.5 |
12.8 |
13.6 |
14.4 |
5.7% |
0.1% |
Peru |
12.1 |
12.0 |
12.8 |
13.4 |
13.6 |
14.9 |
16.2 |
16.6 |
18.9 |
20.6 |
22.3 |
7.9% |
0.2% |
Trinidad & Tobago |
12.1 |
13.2 |
14.5 |
15.9 |
20.5 |
21.4 |
21.0 |
21.7 |
22.8 |
22.4 |
21.2 |
-5.8% |
0.2% |
Venezuela |
69.4 |
61.4 |
68.6 |
71.0 |
77.1 |
76.0 |
83.0 |
82.3 |
83.2 |
84.7 |
86.8 |
2.3% |
0.7% |
Other S. & Cent. America |
79.2 |
82.8 |
83.3 |
82.9 |
84.6 |
86.9 |
85.1 |
84.7 |
87.3 |
89.0 |
91.8 |
2.9% |
0.7% |
Total S. & Cent. America |
474.9 |
480.9 |
506.8 |
524.8 |
549.4 |
570.9 |
590.3 |
590.2 |
623.0 |
649.5 |
665.3 |
2.2% |
5.3% |
Austria |
33.3 |
34.0 |
34.7 |
35.2 |
35.0 |
34.2 |
34.8 |
34.1 |
35.2 |
32.0 |
33.1 |
3.2% |
0.3% |
Azerbaijan |
10.9 |
11.8 |
12.6 |
13.8 |
13.6 |
12.3 |
12.3 |
10.9 |
10.7 |
11.9 |
12.2 |
2.5% |
0.1% |
Belarus |
21.7 |
21.3 |
23.4 |
23.8 |
25.3 |
24.4 |
25.7 |
24.0 |
25.2 |
25.6 |
25.9 |
1.1% |
0.2% |
Belgium |
62.3 |
65.2 |
65.0 |
64.6 |
64.7 |
65.0 |
67.2 |
62.7 |
66.4 |
63.7 |
60.6 |
-5.1% |
0.5% |
Bulgaria |
18.2 |
19.3 |
19.0 |
19.6 |
20.0 |
19.4 |
19.5 |
17.0 |
17.8 |
19.1 |
17.9 |
-6.4% |
0.1% |
Czech Republic |
41.6 |
43.7 |
45.3 |
45.3 |
46.1 |
45.5 |
44.5 |
41.8 |
43.5 |
42.8 |
41.9 |
-2.3% |
0.3% |
Denmark |
19.9 |
21.4 |
20.5 |
19.8 |
21.9 |
20.9 |
20.0 |
18.8 |
19.6 |
18.3 |
17.0 |
-7.6% |
0.1% |
Finland |
28.2 |
30.4 |
30.4 |
28.1 |
29.4 |
29.4 |
28.7 |
26.7 |
28.9 |
26.9 |
26.4 |
-2.0% |
0.2% |
France |
255.8 |
259.9 |
264.3 |
263.0 |
261.3 |
257.9 |
258.9 |
245.0 |
253.1 |
244.7 |
245.4 |
♦ |
2.0% |
|
|||||||||||||
Germany |
334.0 |
336.8 |
337.1 |
333.1 |
339.6 |
324.5 |
326.8 |
307.7 |
322.4 |
307.5 |
311.7 |
1.1% |
2.5% |
Greece |
33.0 |
32.7 |
34.2 |
33.9 |
34.9 |
34.9 |
34.5 |
33.1 |
31.1 |
30.4 |
28.8 |
-5.7% |
0.2% |
Hungary |
23.6 |
24.2 |
24.3 |
26.0 |
25.8 |
25.5 |
25.2 |
23.0 |
23.7 |
23.0 |
21.9 |
-4.9% |
0.2% |
Republic of Ireland |
14.5 |
14.2 |
14.6 |
15.1 |
15.5 |
15.9 |
15.7 |
14.4 |
14.4 |
13.3 |
13.0 |
-3.1% |
0.1% |
Italy |
175.4 |
181.0 |
184.6 |
185.1 |
184.6 |
181.8 |
180.4 |
168.1 |
173.2 |
169.6 |
162.5 |
-4.4% |
1.3% |
Kazakhstan |
40.9 |
44.6 |
44.6 |
47.2 |
50.7 |
52.4 |
53.3 |
50.1 |
50.0 |
55.7 |
58.1 |
4.1% |
0.5% |
Lithuania |
8.5 |
8.9 |
9.0 |
8.3 |
8.0 |
8.6 |
8.6 |
7.8 |
5.9 |
6.1 |
6.0 |
-2.4% |
♦ |
|
|||||||||||||
Netherlands |
91.2 |
92.0 |
95.0 |
96.7 |
96.1 |
95.6 |
93.6 |
92.3 |
96.5 |
91.9 |
89.1 |
-3.3% |
0.7% |
Norway |
43.6 |
39.2 |
39.9 |
46.0 |
42.4 |
46.1 |
47.1 |
43.9 |
42.1 |
43.2 |
48.1 |
11.1% |
0.4% |
Poland |
87.7 |
90.1 |
91.4 |
91.2 |
94.7 |
95.7 |
96.2 |
92.1 |
99.5 |
99.8 |
97.6 |
-2.4% |
0.8% |
Portugal |
25.5 |
25.8 |
25.4 |
25.6 |
25.5 |
25.4 |
23.8 |
24.2 |
25.4 |
24.1 |
22.7 |
-6.1% |
0.2% |
Romania |
38.6 |
37.8 |
39.0 |
39.8 |
40.6 |
37.5 |
38.5 |
34.0 |
34.3 |
35.4 |
33.6 |
-5.2% |
0.3% |
Russian Federation |
628.2 |
642.2 |
649.2 |
647.9 |
675.6 |
680.1 |
683.5 |
647.8 |
674.0 |
696.5 |
694.2 |
-0.6% |
5.6% |
Slovakia |
18.7 |
18.1 |
17.6 |
18.8 |
17.9 |
17.2 |
17.7 |
16.0 |
17.0 |
16.5 |
16.9 |
2.2% |
0.1% |
Spain |
137.5 |
145.3 |
151.2 |
153.7 |
155.1 |
159.6 |
155.5 |
145.1 |
146.6 |
145.6 |
144.8 |
-0.8% |
1.2% |
Sweden |
50.7 |
48.3 |
52.1 |
53.8 |
50.7 |
51.8 |
51.5 |
47.2 |
50.7 |
50.5 |
52.9 |
4.7% |
0.4% |
Switzerland |
29.3 |
29.1 |
28.8 |
27.7 |
28.9 |
28.6 |
29.7 |
29.7 |
29.0 |
27.5 |
29.0 |
5.5% |
0.2% |
Turkey |
73.1 |
78.1 |
82.9 |
86.0 |
96.2 |
103.1 |
102.7 |
102.8 |
110.4 |
118.1 |
119.2 |
0.6% |
1.0% |
Turkmenistan |
15.4 |
17.2 |
17.8 |
18.8 |
20.7 |
23.8 |
23.6 |
22.6 |
24.8 |
27.1 |
25.8 |
-5.3% |
0.2% |
Ukraine |
133.0 |
136.6 |
137.5 |
136.1 |
137.5 |
135.4 |
131.9 |
112.2 |
120.9 |
125.6 |
125.3 |
-0.5% |
1.0% |
United Kingdom |
221.7 |
225.4 |
227.3 |
228.2 |
225.5 |
218.3 |
219.8 |
207.7 |
213.8 |
200.5 |
203.6 |
1.2% |
1.6% |
Uzbekistan |
55.0 |
51.8 |
49.6 |
46.1 |
45.9 |
48.7 |
52.3 |
46.7 |
48.0 |
51.6 |
50.5 |
-2.3% |
0.4% |
Other Europe & Eurasia |
80.7 |
84.3 |
89.4 |
89.4 |
87.2 |
89.5 |
91.1 |
88.1 |
93.9 |
92.4 |
92.7 |
♦ |
0.7% |
|
|||||||||||||
Total Europe & Eurasia |
2852.0 |
2910.9 |
2957.7 |
2967.7 |
3017.0 |
3009.2 |
3014.6 |
2837.8 |
2948.0 |
2936.6 |
2928.5 |
-0.5% |
23.5% |
Iran |
144.3 |
152.2 |
158.6 |
179.5 |
189.8 |
195.7 |
202.1 |
214.3 |
221.5 |
227.0 |
234.2 |
2.9% |
1.9% |
Israel |
20.1 |
20.7 |
21.0 |
21.6 |
21.8 |
22.9 |
23.8 |
23.1 |
23.4 |
24.0 |
24.8 |
3.2% |
0.2% |
Kuwait |
21.7 |
25.5 |
28.5 |
30.5 |
28.9 |
28.8 |
30.4 |
31.5 |
34.8 |
35.7 |
36.4 |
1.8% |
0.3% |
Qatar |
13.0 |
14.1 |
16.9 |
20.8 |
22.2 |
22.6 |
23.4 |
24.1 |
24.9 |
27.5 |
31.6 |
14.3% |
0.3% |
Saudi Arabia |
127.6 |
135.8 |
147.4 |
152.4 |
158.6 |
165.0 |
179.2 |
186.4 |
202.4 |
207.5 |
222.2 |
6.8% |
1.8% |
United Arab Emirates |
52.8 |
56.2 |
60.1 |
62.3 |
65.3 |
72.5 |
82.9 |
81.3 |
84.8 |
88.1 |
89.3 |
1.0% |
0.7% |
Other Middle East |
84.9 |
80.9 |
85.9 |
91.6 |
90.2 |
91.6 |
103.2 |
107.7 |
116.3 |
117.7 |
123.5 |
4.7% |
1.0% |
Total Middle East |
464.3 |
485.4 |
518.4 |
558.7 |
576.7 |
599.1 |
645.1 |
668.3 |
708.0 |
727.4 |
761.9 |
4.5% |
6.1% |
Algeria |
28.6 |
30.0 |
31.1 |
32.6 |
33.5 |
35.4 |
37.5 |
39.6 |
38.6 |
40.7 |
44.6 |
9.3% |
0.4% |
Egypt |
53.5 |
56.9 |
59.6 |
62.5 |
65.8 |
69.9 |
74.1 |
76.9 |
81.2 |
82.7 |
87.1 |
5.0% |
0.7% |
South Africa |
103.7 |
109.4 |
115.5 |
115.0 |
116.8 |
122.9 |
128.5 |
124.0 |
123.1 |
122.2 |
123.8 |
1.0% |
1.0% |
Other Africa |
106.2 |
107.8 |
116.6 |
123.0 |
121.6 |
126.3 |
133.1 |
131.3 |
142.8 |
138.4 |
147.8 |
6.5% |
1.2% |
Total Africa |
291.9 |
304.1 |
322.7 |
333.1 |
337.7 |
354.5 |
373.1 |
371.9 |
385.7 |
384.0 |
403.3 |
4.7% |
3.2% |
Australia |
113.5 |
112.6 |
115.2 |
119.0 |
125.1 |
125.4 |
125.2 |
124.3 |
123.2 |
126.5 |
125.7 |
-0.9% |
1.0% |
Bangladesh |
14.8 |
15.7 |
16.4 |
17.4 |
18.7 |
19.3 |
20.4 |
21.4 |
23.1 |
24.4 |
26.3 |
7.5% |
0.2% |
China |
1073.8 |
1245.3 |
1466.8 |
1601.2 |
1764.7 |
1878.7 |
1969.9 |
2101.5 |
2338.0 |
2540.8 |
2735.2 |
7.4% |
21.9% |
China Hong Kong SAR |
20.8 |
21.2 |
24.3 |
22.9 |
24.7 |
26.2 |
24.5 |
27.0 |
27.7 |
28.6 |
28.1 |
-2.0% |
0.2% |
India |
310.8 |
320.8 |
345.1 |
366.8 |
390.0 |
420.1 |
446.5 |
484.1 |
511.6 |
534.8 |
563.5 |
5.1% |
4.5% |
Indonesia |
107.5 |
116.4 |
115.4 |
118.8 |
121.5 |
129.4 |
123.3 |
133.6 |
148.7 |
158.6 |
159.4 |
0.2% |
1.3% |
Japan |
513.3 |
514.6 |
526.8 |
531.4 |
530.1 |
526.7 |
520.7 |
477.9 |
506.7 |
481.1 |
478.2 |
-0.9% |
3.8% |
Malaysia |
53.1 |
55.7 |
55.7 |
61.3 |
65.9 |
69.6 |
71.0 |
70.6 |
76.1 |
74.9 |
76.3 |
1.6% |
0.6% |
New Zealand |
19.3 |
18.7 |
19.5 |
18.8 |
19.0 |
19.0 |
19.1 |
19.1 |
19.7 |
19.5 |
19.6 |
0.6% |
0.2% |
Pakistan |
47.4 |
52.4 |
56.8 |
58.9 |
61.8 |
65.2 |
64.9 |
67.0 |
68.0 |
68.1 |
69.3 |
1.4% |
0.6% |
Philippines |
25.8 |
26.5 |
27.4 |
27.6 |
25.9 |
27.3 |
27.1 |
27.5 |
27.9 |
28.8 |
30.2 |
4.7% |
0.2% |
Singapore |
41.6 |
39.4 |
44.2 |
49.6 |
53.1 |
58.5 |
61.3 |
64.8 |
70.8 |
73.9 |
74.0 |
-0.2% |
0.6% |
South Korea |
203.0 |
209.8 |
213.8 |
220.8 |
222.9 |
231.9 |
236.4 |
237.4 |
254.6 |
267.8 |
271.1 |
1.0% |
2.2% |
Taiwan |
94.5 |
98.9 |
104.2 |
106.5 |
108.0 |
112.9 |
106.8 |
104.4 |
110.6 |
109.8 |
109.4 |
-0.6% |
0.9% |
Thailand |
72.1 |
77.1 |
82.4 |
86.5 |
88.9 |
92.7 |
95.5 |
99.3 |
105.0 |
111.1 |
117.6 |
5.5% |
0.9% |
Vietnam |
21.4 |
22.5 |
28.7 |
29.8 |
32.3 |
34.9 |
36.7 |
42.1 |
43.7 |
48.4 |
52.0 |
7.1% |
0.4% |
Other Asia Pacific |
41.1 |
42.9 |
43.9 |
46.5 |
49.6 |
48.1 |
49.7 |
50.3 |
52.5 |
56.1 |
56.3 |
0.2% |
0.5% |
Total Asia Pacific |
2773.7 |
2990.4 |
3286.5 |
3483.7 |
3702.0 |
3885.9 |
3999.0 |
4152.4 |
4507.9 |
4753.2 |
4992.2 |
4.7% |
40.0% |
Total World |
9597.8 |
9933.8 |
10409.9 |
10707.7 |
11005.6 |
11287.5 |
11438.7 |
11309.8 |
11943.4 |
12225.0 |
12476.6 |
1.8% |
100.0% |
of which: OECD |
5454.4 |
5517.7 |
5627.9 |
5676.4 |
5684.2 |
5723.1 |
5669.4 |
5399.5 |
5593.1 |
5538.3 |
5488.8 |
-1.2% |
44.0% |
Non-OECD |
4143.4 |
4416.1 |
4782.0 |
5031.3 |
5321.5 |
5564.4 |
5769.3 |
5910.3 |
6350.3 |
6686.6 |
6987.8 |
4.2% |
56.0% |
European Union |
1743.1 |
1778.5 |
1807.5 |
1810.3 |
1818.2 |
1790.9 |
1788.0 |
1683.9 |
1745.6 |
1687.4 |
1673.4 |
-1.1% |
13.4% |
Former Soviet Union |
937.7 |
959.8 |
970.4 |
969.8 |
1004.9 |
1015.6 |
1019.6 |
948.3 |
988.5 |
1030.3 |
1029.3 |
-0.4% |
8.2% |
*In this review, primary energy comprises commercially traded fuels, including modern renewables used to generate electricity.Less than 0.05%.
Notes: Oil consumption is measured in million tonnes; other fuels in million tonnes of oil equivalent.
Growth rates are adjusted for leap years.
40

Consumption by fuel*
|
|
|
|
|
2011 |
|
|
|
|
|
|
|
|
|
|
|
2012 |
|
|
|
|
|
|
|
Natural |
|
Nuclear |
Hydro- |
Renew- |
|
|
|
|
|
Natural |
|
Nuclear |
Hydro- |
Renew- |
|
|
||
Million tonnes oil equivalent |
|
Oil |
gas |
Coal |
energy |
electricity |
ables |
Total |
|
|
Oil |
gas |
Coal |
energy |
electricity |
ables |
Total |
||||
US |
837.0 |
626.5 |
495.5 |
188.2 |
73.0 |
45.0 |
2265.2 |
|
819.9 |
654.0 |
437.8 |
183.2 |
63.2 |
50.7 |
2208.8 |
||||||
Canada |
105.0 |
90.8 |
22.3 |
21.4 |
85.2 |
3.9 |
328.6 |
|
104.3 |
90.6 |
21.9 |
21.7 |
86.0 |
4.3 |
328.8 |
||||||
Mexico |
90.3 |
69.0 |
8.9 |
2.3 |
8.1 |
2.0 |
180.5 |
|
92.6 |
75.3 |
8.8 |
2.0 |
7.1 |
2.0 |
187.7 |
||||||
Total North America |
1032.3 |
786.2 |
526.7 |
211.9 |
166.3 |
50.9 |
2774.3 |
|
1016.8 |
820.0 |
468.5 |
206.9 |
156.3 |
57.0 |
2725.4 |
||||||
Argentina |
27.5 |
41.1 |
0.9 |
1.3 |
9.0 |
0.5 |
80.4 |
|
28.2 |
42.6 |
1.0 |
1.4 |
8.4 |
0.6 |
82.1 |
||||||
Brazil |
122.2 |
24.0 |
14.1 |
3.5 |
96.9 |
9.0 |
269.7 |
|
125.6 |
26.2 |
13.5 |
3.6 |
94.5 |
11.2 |
274.7 |
||||||
Chile |
17.5 |
4.8 |
5.3 |
|
– |
4.7 |
0.9 |
33.3 |
|
17.9 |
5.4 |
6.7 |
|
– |
4.6 |
0.9 |
35.5 |
||||
Colombia |
12.5 |
8.0 |
4.3 |
|
– |
10.9 |
0.2 |
35.9 |
|
12.7 |
8.9 |
4.0 |
|
– |
10.8 |
0.2 |
36.5 |
||||
Ecuador |
10.5 |
0.5 |
– |
|
– |
2.5 |
0.1 |
13.6 |
|
11.0 |
0.6 |
– |
|
– |
2.8 |
0.1 |
14.4 |
||||
Peru |
9.2 |
5.5 |
0.7 |
|
– |
4.9 |
0.2 |
20.6 |
|
9.6 |
6.7 |
0.8 |
|
– |
5.0 |
0.2 |
22.3 |
||||
Trinidad & Tobago |
1.6 |
20.8 |
– |
|
– |
– |
† |
22.4 |
|
1.6 |
19.5 |
– |
|
– |
– |
† |
21.2 |
||||
Venezuela |
35.6 |
30.0 |
0.2 |
|
– |
18.8 |
– |
84.7 |
|
36.6 |
31.4 |
0.2 |
|
– |
18.6 |
– |
86.8 |
||||
Other S. & Cent. America |
58.7 |
6.0 |
2.0 |
|
– |
20.1 |
2.1 |
89.0 |
|
59.0 |
7.1 |
2.0 |
|
– |
21.1 |
2.4 |
91.8 |
||||
Total S. & Cent. America |
295.4 |
140.8 |
27.6 |
4.9 |
167.9 |
13.0 |
649.5 |
|
302.2 |
148.6 |
28.2 |
5.0 |
165.7 |
15.6 |
665.3 |
||||||
Austria |
12.6 |
8.5 |
2.6 |
|
– |
6.8 |
1.5 |
32.0 |
|
12.4 |
8.1 |
2.0 |
|
– |
8.9 |
1.6 |
33.1 |
||||
Azerbaijan |
4.0 |
7.3 |
† |
|
– |
0.6 |
– |
11.9 |
|
4.2 |
7.6 |
† |
|
– |
0.4 |
– |
12.2 |
||||
Belarus |
9.0 |
16.5 |
† |
|
– |
† |
0.1 |
25.6 |
|
9.1 |
16.7 |
† |
|
– |
† |
0.1 |
25.9 |
||||
Belgium |
32.3 |
14.9 |
3.3 |
10.9 |
† |
2.2 |
63.7 |
|
30.6 |
15.2 |
3.0 |
9.1 |
0.1 |
2.6 |
60.6 |
||||||
Bulgaria |
3.8 |
2.6 |
8.1 |
3.7 |
0.7 |
0.2 |
19.1 |
|
3.8 |
2.5 |
7.0 |
3.6 |
0.7 |
0.3 |
17.9 |
||||||
Czech Republic |
9.0 |
7.6 |
18.0 |
6.4 |
0.6 |
1.2 |
42.8 |
|
9.1 |
7.4 |
16.6 |
6.9 |
0.7 |
1.3 |
41.9 |
||||||
Denmark |
8.1 |
3.8 |
3.2 |
|
– |
† |
3.2 |
18.3 |
|
7.6 |
3.5 |
2.5 |
|
– |
† |
3.4 |
17.0 |
||||
Finland |
9.7 |
3.1 |
3.4 |
5.3 |
2.8 |
2.6 |
26.9 |
|
9.1 |
2.8 |
2.9 |
5.3 |
3.8 |
2.6 |
26.4 |
||||||
France |
83.7 |
36.8 |
9.5 |
100.0 |
10.3 |
4.4 |
244.7 |
|
80.9 |
38.2 |
11.4 |
96.3 |
13.2 |
5.4 |
245.4 |
||||||
Germany |
112.0 |
67.1 |
76.0 |
24.4 |
4.0 |
24.0 |
307.5 |
|
111.5 |
67.7 |
79.2 |
22.5 |
4.8 |
26.0 |
311.7 |
||||||
Greece |
17.0 |
4.1 |
7.5 |
|
– |
0.9 |
0.9 |
30.4 |
|
15.4 |
3.8 |
7.5 |
|
– |
1.0 |
1.1 |
28.8 |
||||
Hungary |
6.4 |
9.4 |
3.0 |
3.5 |
0.1 |
0.6 |
23.0 |
|
6.0 |
8.8 |
3.0 |
3.6 |
† |
0.6 |
21.9 |
||||||
Republic of Ireland |
6.7 |
4.1 |
1.3 |
|
– |
0.2 |
1.1 |
13.3 |
|
6.2 |
4.0 |
1.5 |
|
– |
0.2 |
1.0 |
13.0 |
||||
Italy |
70.5 |
64.2 |
16.1 |
|
– |
10.4 |
8.4 |
169.6 |
|
64.2 |
61.8 |
16.2 |
|
– |
9.4 |
10.9 |
162.5 |
||||
Kazakhstan |
11.6 |
8.3 |
34.0 |
|
– |
1.8 |
† |
55.7 |
|
12.8 |
8.5 |
35.0 |
|
– |
1.8 |
† |
58.1 |
||||
Lithuania |
2.6 |
3.1 |
0.2 |
|
– |
0.1 |
0.1 |
6.1 |
|
2.6 |
3.0 |
0.2 |
|
– |
0.1 |
0.2 |
6.0 |
||||
Netherlands |
46.1 |
34.3 |
7.8 |
0.9 |
† |
2.8 |
91.9 |
|
44.1 |
32.8 |
8.5 |
0.9 |
† |
2.7 |
89.1 |
||||||
Norway |
10.6 |
3.9 |
0.7 |
|
– |
27.6 |
0.4 |
43.2 |
|
10.8 |
3.9 |
0.7 |
|
– |
32.3 |
0.5 |
48.1 |
||||
Poland |
26.6 |
14.1 |
56.1 |
|
– |
0.5 |
2.4 |
99.8 |
|
25.1 |
14.9 |
54.0 |
|
– |
0.5 |
3.1 |
97.6 |
||||
Portugal |
11.6 |
4.7 |
2.2 |
|
– |
2.8 |
2.8 |
24.1 |
|
10.9 |
4.2 |
2.9 |
|
– |
1.5 |
3.1 |
22.7 |
||||
Romania |
9.1 |
12.5 |
7.3 |
2.7 |
3.4 |
0.3 |
35.4 |
|
8.8 |
12.1 |
6.7 |
2.6 |
2.8 |
0.6 |
33.6 |
||||||
Russian Federation |
143.5 |
382.1 |
93.7 |
39.1 |
37.9 |
0.1 |
696.5 |
|
147.5 |
374.6 |
93.9 |
40.3 |
37.8 |
0.1 |
694.2 |
||||||
Slovakia |
3.9 |
4.6 |
3.3 |
3.5 |
0.9 |
0.2 |
16.5 |
|
3.5 |
5.4 |
3.2 |
3.5 |
1.0 |
0.3 |
16.9 |
||||||
Spain |
68.5 |
29.0 |
15.5 |
13.1 |
6.9 |
12.6 |
145.6 |
|
63.8 |
28.2 |
19.3 |
13.9 |
4.6 |
14.9 |
144.8 |
||||||
Sweden |
14.5 |
1.1 |
2.0 |
13.8 |
15.1 |
4.0 |
50.5 |
|
13.8 |
1.0 |
1.5 |
14.6 |
17.8 |
4.2 |
52.9 |
||||||
Switzerland |
11.0 |
2.7 |
0.1 |
6.1 |
7.2 |
0.4 |
27.5 |
|
11.2 |
2.9 |
0.1 |
5.8 |
8.6 |
0.4 |
29.0 |
||||||
Turkey |
30.7 |
41.2 |
33.1 |
|
– |
11.8 |
1.3 |
118.1 |
|
31.5 |
41.7 |
31.3 |
|
– |
13.1 |
1.6 |
119.2 |
||||
Turkmenistan |
4.7 |
22.5 |
– |
|
– |
† |
– |
27.1 |
|
4.8 |
20.9 |
– |
|
– |
† |
– |
25.8 |
||||
Ukraine |
12.9 |
48.3 |
41.5 |
20.4 |
2.4 |
† |
125.6 |
|
13.2 |
44.6 |
44.6 |
20.4 |
2.4 |
0.1 |
125.3 |
||||||
United Kingdom |
71.1 |
74.5 |
31.5 |
15.6 |
1.3 |
6.6 |
200.5 |
|
68.5 |
70.5 |
39.1 |
15.9 |
1.2 |
8.4 |
203.6 |
||||||
Uzbekistan |
3.8 |
44.2 |
1.2 |
|
– |
2.3 |
– |
51.6 |
|
3.9 |
43.1 |
1.2 |
|
– |
2.3 |
– |
50.5 |
||||
Other Europe & Eurasia |
32.8 |
14.2 |
22.5 |
2.0 |
19.5 |
1.4 |
92.4 |
|
32.8 |
14.5 |
22.2 |
1.8 |
19.8 |
1.7 |
92.7 |
||||||
Total Europe & Eurasia |
900.3 |
995.2 |
504.6 |
271.5 |
179.0 |
85.9 |
2936.6 |
|
879.8 |
975.0 |
516.9 |
266.9 |
190.8 |
99.1 |
2928.5 |
||||||
Iran |
85.6 |
138.2 |
0.9 |
|
† |
2.2 |
† |
227.0 |
|
89.6 |
140.5 |
0.9 |
0.3 |
2.9 |
† |
234.2 |
|||||
Israel |
11.5 |
4.5 |
7.9 |
|
– |
† |
0.1 |
24.0 |
|
13.6 |
2.3 |
8.8 |
|
– |
† |
0.1 |
24.8 |
||||
Kuwait |
20.4 |
15.3 |
– |
|
– |
– |
– |
35.7 |
|
20.9 |
15.5 |
– |
|
– |
– |
– |
36.4 |
||||
Qatar |
7.8 |
19.7 |
– |
|
– |
– |
– |
27.5 |
|
8.0 |
23.5 |
– |
|
– |
– |
– |
31.6 |
||||
Saudi Arabia |
124.4 |
83.0 |
– |
|
– |
– |
– |
207.5 |
|
129.7 |
92.5 |
– |
|
– |
– |
– |
222.2 |
||||
United Arab Emirates |
31.8 |
56.2 |
– |
|
– |
– |
† |
88.1 |
|
32.6 |
56.6 |
– |
|
– |
– |
† |
89.3 |
||||
Other Middle East |
77.1 |
38.3 |
0.2 |
|
– |
2.1 |
† |
117.7 |
|
81.4 |
39.6 |
0.2 |
|
– |
2.2 |
† |
123.5 |
||||
Total Middle East |
358.7 |
355.3 |
9.0 |
|
† |
4.3 |
0.1 |
727.4 |
|
375.8 |
370.6 |
9.9 |
0.3 |
5.1 |
0.1 |
761.9 |
|||||
Algeria |
15.5 |
25.1 |
– |
|
– |
0.1 |
† |
40.7 |
|
16.7 |
27.8 |
– |
|
– |
0.1 |
0.1 |
44.6 |
||||
Egypt |
33.7 |
44.7 |
1.1 |
|
– |
2.9 |
0.3 |
82.7 |
|
35.2 |
47.3 |
1.1 |
|
– |
3.0 |
0.3 |
87.1 |
||||
South Africa |
26.2 |
3.5 |
89.1 |
2.9 |
0.4 |
0.1 |
122.2 |
|
26.9 |
3.4 |
89.8 |
3.2 |
0.4 |
0.1 |
123.8 |
||||||
Other Africa |
82.7 |
29.3 |
6.5 |
|
– |
19.0 |
0.9 |
138.4 |
|
87.7 |
32.0 |
6.6 |
|
– |
20.6 |
0.9 |
147.8 |
||||
Total Africa |
158.0 |
102.6 |
96.7 |
2.9 |
22.5 |
1.3 |
384.0 |
|
166.5 |
110.5 |
97.5 |
3.2 |
24.1 |
1.4 |
403.3 |
||||||
Australia |
46.1 |
23.0 |
51.7 |
|
– |
3.4 |
2.2 |
126.5 |
|
46.7 |
22.9 |
49.3 |
|
– |
4.1 |
2.8 |
125.7 |
||||
Bangladesh |
5.3 |
18.1 |
0.7 |
|
– |
0.4 |
† |
24.4 |
|
5.6 |
19.6 |
0.7 |
|
– |
0.4 |
† |
26.3 |
||||
China |
459.4 |
117.5 |
1760.8 |
19.5 |
158.2 |
25.4 |
2540.8 |
|
483.7 |
129.5 |
1873.3 |
22.0 |
194.8 |
31.9 |
2735.2 |
||||||
China Hong Kong SAR |
18.1 |
2.7 |
7.7 |
|
– |
– |
† |
28.6 |
|
17.9 |
2.5 |
7.6 |
|
– |
– |
† |
28.1 |
||||
India |
163.0 |
55.0 |
270.6 |
7.3 |
29.8 |
9.2 |
534.8 |
|
171.6 |
49.1 |
298.3 |
7.5 |
26.2 |
10.9 |
563.5 |
||||||
Indonesia |
71.1 |
33.5 |
48.9 |
|
– |
2.8 |
2.2 |
158.6 |
|
71.6 |
32.2 |
50.4 |
|
– |
2.9 |
2.2 |
159.4 |
||||
Japan |
204.7 |
95.0 |
117.7 |
36.9 |
19.4 |
7.5 |
481.1 |
|
218.2 |
105.1 |
124.4 |
4.1 |
18.3 |
8.2 |
478.2 |
||||||
Malaysia |
29.1 |
28.8 |
14.8 |
|
– |
1.9 |
0.3 |
74.9 |
|
29.8 |
30.0 |
14.3 |
|
– |
1.8 |
0.3 |
76.3 |
||||
New Zealand |
7.0 |
3.5 |
1.4 |
|
– |
5.7 |
2.0 |
19.5 |
|
7.0 |
3.8 |
1.7 |
|
– |
5.2 |
2.0 |
19.6 |
||||
Pakistan |
20.8 |
35.2 |
4.3 |
0.9 |
6.9 |
† |
68.1 |
|
20.0 |
37.3 |
4.3 |
1.3 |
6.4 |
† |
69.3 |
||||||
Philippines |
12.8 |
3.2 |
8.3 |
|
– |
2.2 |
2.3 |
28.8 |
|
13.0 |
3.1 |
9.4 |
|
– |
2.5 |
2.3 |
30.2 |
||||
Singapore |
65.7 |
7.9 |
– |
|
– |
– |
0.3 |
73.9 |
|
66.2 |
7.5 |
– |
|
– |
– |
0.3 |
74.0 |
||||
South Korea |
105.8 |
41.7 |
83.6 |
35.0 |
1.0 |
0.7 |
267.8 |
|
108.8 |
45.0 |
81.8 |
34.0 |
0.7 |
0.8 |
271.1 |
||||||
Taiwan |
42.8 |
14.0 |
41.5 |
9.5 |
0.9 |
1.2 |
109.8 |
|
42.2 |
14.7 |
41.1 |
9.1 |
1.2 |
1.1 |
109.4 |
||||||
Thailand |
50.5 |
41.9 |
16.0 |
|
– |
1.8 |
0.9 |
111.1 |
|
52.4 |
46.1 |
16.0 |
|
– |
2.0 |
1.2 |
117.6 |
||||
Vietnam |
16.5 |
7.6 |
15.0 |
|
– |
9.3 |
† |
48.4 |
|
16.6 |
8.5 |
14.9 |
|
– |
11.9 |
† |
52.0 |
||||
Other Asia Pacific |
18.0 |
5.6 |
21.2 |
|
– |
11.2 |
0.1 |
56.1 |
|
18.3 |
5.6 |
21.6 |
|
– |
10.7 |
0.1 |
56.3 |
||||
Total Asia Pacific |
1336.6 |
534.2 |
2464.2 |
109.1 |
254.7 |
54.4 |
4753.2 |
|
1389.4 |
562.5 |
2609.1 |
78.1 |
289.0 |
64.1 |
4992.2 |
||||||
Total World |
4081.4 |
2914.2 |
3628.8 |
600.4 |
794.7 |
205.6 |
12225.0 |
|
4130.5 |
2987.1 |
3730.1 |
560.4 |
831.1 |
237.4 |
12476.6 |
||||||
of which: OECD |
2095.2 |
1394.6 |
1096.1 |
488.9 |
314.5 |
149.1 |
5538.3 |
|
2072.8 |
1433.6 |
1053.1 |
444.5 |
315.6 |
169.2 |
5488.8 |
||||||
Non-OECD |
1986.2 |
1519.6 |
2532.7 |
111.5 |
480.2 |
56.4 |
6686.6 |
|
2057.7 |
1553.5 |
2677.0 |
115.9 |
515.5 |
68.2 |
6987.8 |
||||||
European Union |
639.1 |
407.7 |
283.4 |
205.3 |
69.3 |
82.5 |
1687.4 |
|
611.3 |
399.5 |
293.7 |
199.8 |
74.0 |
95.0 |
1673.4 |
||||||
Former Soviet Union |
199.5 |
539.2 |
175.9 |
60.1 |
55.1 |
0.5 |
1030.3 |
|
205.9 |
526.4 |
180.2 |
61.2 |
54.9 |
0.6 |
1029.3 |
||||||
*In this review, primary energy comprises commercially traded fuels, including modern renewables used to generate electricity. †Less than 0.05.
Note: Oil consumption is measured in million tonnes; other fuels in million tonnes of oil equivalent.
41
World consumption
Million tonnes oil equivalent
|
|
Coal |
|
|
|
|
|
|
|
|
|
|
|
|
|
|
|
|
|
|
|
|
|
|
|
|
13000 |
|
|
|
|
|
|
|
|
|
|
|
|
|
|
|
|
|
|
|
|
|
|
|
|
|
|
|
|
|
|
Renewables |
|
|
|
|
|
|
|
|
|
|
|
|
|
|
|
|
|
|
|
|
|
|
|
|
|
|
|
|
|
|
|
|
|
|
|
|
|
|
|
|
|
|
|
|
|
|
|
|
|
|
|
||
|
|
Hydroelectricity |
|
|
|
|
|
|
|
|
|
|
|
|
|
|
|
|
|
|
|
|
|
|
|
12000 |
|
|
|
|
|
|
|
|
|
|
|
|
|
|
|
|
|
|
|
|
|
|
|
|
|
|
|||
|
|
|
|
|
|
|
|
|
|
|
|
|
|
|
|
|
|
|
|
|
|
|
|
|
|
||
|
|
Nuclear energy |
|
|
|
|
|
|
|
|
|
|
|
|
|
|
|
|
|
|
|
|
|
|
|
|
|
|
|
|
|
|
|
|
|
|
|
|
|
|
|
|
|
|
|
|
|
|
|
|
|
|
|
||
|
|
|
|
|
|
|
|
|
|
|
|
|
|
|
|
|
|
|
|
|
|
|
|
|
|
||
|
|
Natural gas |
|
|
|
|
|
|
|
|
|
|
|
|
|
|
|
|
|
|
|
|
|
|
|
|
|
|
|
|
|
|
|
|
|
|
|
|
|
|
|
|
|
|
|
|
|
|
|
|
|
|
11000 |
||
|
|
|
|
|
|
|
|
|
|
|
|
|
|
|
|
|
|
|
|
|
|
|
|
|
|||
|
|
Oil |
|
|
|
|
|
|
|
|
|
|
|
|
|
|
|
|
|
|
|
|
|
|
|
|
|
|
|
|
|
|
|
|
|
|
|
|
|
|
|
|
|
|
|
|
|
|
|
|
|
|
|
|
|
|
|
|
|
|
|
|
|
|
|
|
|
|
|
|
|
|
|
|
|
|
|
|
|
|
|
|
|
|
|
|
|
|
|
|
|
|
|
|
|
|
|
|
|
|
|
|
|
|
|
|
|
|
|
|
|
|
|
|
|
|
|
|
|
|
|
|
|
|
|
|
|
|
|
|
|
|
|
|
|
|
|
|
10000 |
|
|
|
|
|
|
|
|
|
|
|
|
|
|
|
|
|
|
|
|
|
|
|
|
|
|
|
|
|
|
|
|
|
|
|
|
|
|
|
|
|
|
|
|
|
|
|
|
|
|
|
|
|
|
|
9000 |
|
|
|
|
|
|
|
|
|
|
|
|
|
|
|
|
|
|
|
|
|
|
|
|
|
|
|
|
|
|
|
|
|
|
|
|
|
|
|
|
|
|
|
|
|
|
|
|
|
|
|
|
|
|
|
8000 |
|
|
|
|
|
|
|
|
|
|
|
|
|
|
|
|
|
|
|
|
|
|
|
|
|
|
|
|
|
|
|
|
|
|
|
|
|
|
|
|
|
|
|
|
|
|
|
|
|
|
|
|
|
|
|
7000 |
|
|
|
|
|
|
|
|
|
|
|
|
|
|
|
|
|
|
|
|
|
|
|
|
|
|
|
|
|
|
|
|
|
|
|
|
|
|
|
|
|
|
|
|
|
|
|
|
|
|
|
|
|
|
|
6000 |
|
|
|
|
|
|
|
|
|
|
|
|
|
|
|
|
|
|
|
|
|
|
|
|
|
|
|
|
|
|
|
|
|
|
|
|
|
|
|
|
|
|
|
|
|
|
|
|
|
|
|
|
|
|
|
5000 |
|
|
|
|
|
|
|
|
|
|
|
|
|
|
|
|
|
|
|
|
|
|
|
|
|
|
|
|
|
|
|
|
|
|
|
|
|
|
|
|
|
|
|
|
|
|
|
|
|
|
|
|
|
|
|
4000 |
|
|
|
|
|
|
|
|
|
|
|
|
|
|
|
|
|
|
|
|
|
|
|
|
|
|
|
|
|
|
|
|
|
|
|
|
|
|
|
|
|
|
|
|
|
|
|
|
|
|
|
|
|
|
|
3000 |
|
|
|
|
|
|
|
|
|
|
|
|
|
|
|
|
|
|
|
|
|
|
|
|
|
|
|
|
|
|
|
|
|
|
|
|
|
|
|
|
|
|
|
|
|
|
|
|
|
|
|
|
|
|
|
2000 |
|
|
|
|
|
|
|
|
|
|
|
|
|
|
|
|
|
|
|
|
|
|
|
|
|
|
|
|
|
|
|
|
|
|
|
|
|
|
|
|
|
|
|
|
|
|
|
|
|
|
|
|
|
|
|
1000 |
|
|
|
|
|
|
|
|
|
|
|
|
|
|
|
|
|
|
|
|
|
|
|
|
|
|
|
|
87 |
88 |
89 |
90 |
91 |
92 |
93 |
94 |
95 |
96 |
97 |
98 |
99 |
00 |
01 |
02 |
03 |
04 |
05 |
06 |
07 |
08 |
09 |
10 |
11 |
12 |
0 |
|
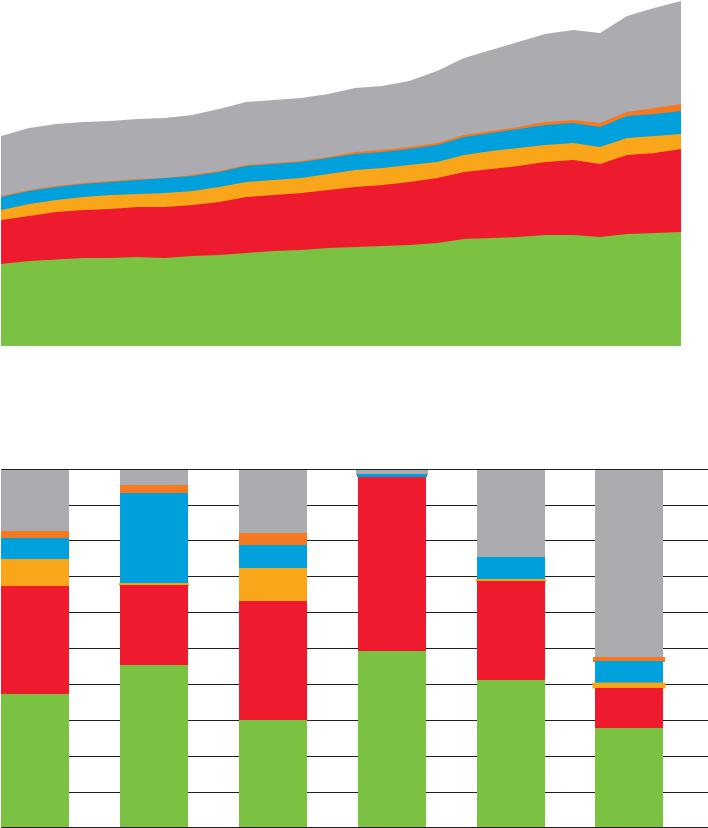
World primary energy consumption grew by a below-average 1.8% in 2012. Growth was below average in all regions except Africa. Oil remains the world’s leading fuel, accounting for 33.1% of global energy consumption, but this figure is the lowest share on record and oil has lost market share for 13 years in a row. Hydroelectric output and other renewables in power generation both reached record shares of global primary energy consumption (6.7% and 1.9%, respectively).
Regional consumption pattern 2012
Percentage |
|
|
|
|
|
|
|
|
|
|
|
|
100 |
|
|
|
|
|
|
90 |
|
|
|
|
|
|
80 |
|
|
|
|
|
|
70 |
|
|
|
|
|
|
60 |
|
|
|
|
|
|
50 |
|
|
|
|
|
|
40 |
|
|
|
|
|
|
30 |
|
|
|
|
|
|
20 |
|
|
|
|
|
|
10 |
North America |
S. & Cent. America |
Europe & Eurasia |
Middle East |
Africa |
Asia Pacific |
0 |
The Asia Pacific region accounted for a record 40% of global energy consumption and 69.9% of global coal consumption in 2012; the region also leads in oil and hydroelectric generation. Europe & Eurasia is the leading region for consumption of natural gas, nuclear power, and renewables. Coal is the dominant fuel in the Asia Pacific region, the only region dependent on a single fuel for more than 50% of total primary energy consumption. Natural gas is dominant in Europe & Eurasia, and oil is dominant in other regions.
42
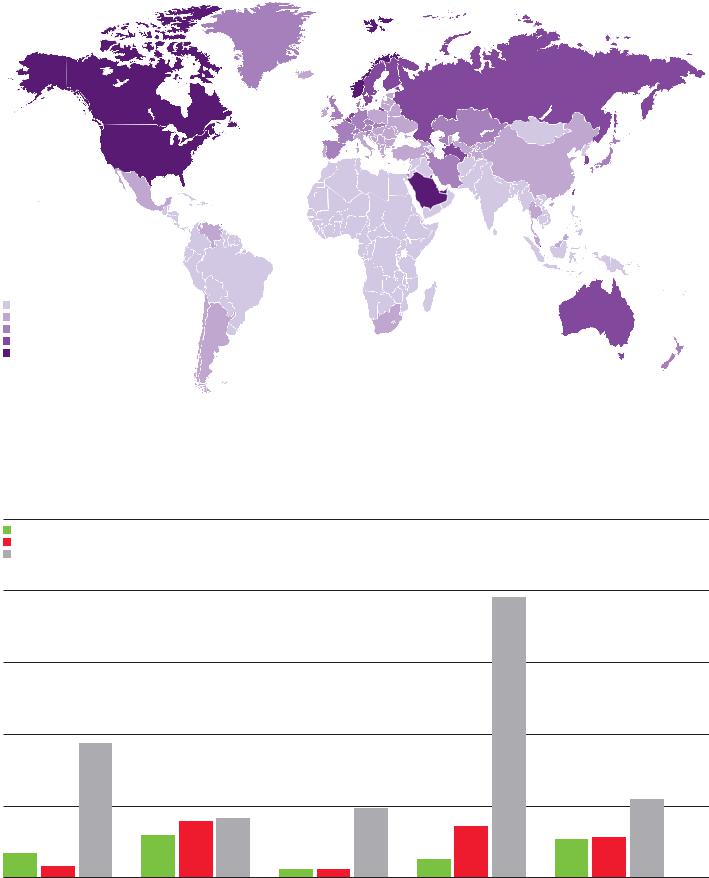
Consumption per capita 2012
Tonnes oil equivalent
0-1.5
1.5-3.0
3.0-4.5
4.5-6.0 > 6.0
Fossil fuel reserves-to-production (R/P) ratios at end 2012 |
|
|
|
||
Years |
|
|
|
|
|
Oil |
|
|
|
|
500 |
|
|
|
|
|
|
Natural gas |
|
|
|
|
|
Coal |
|
|
|
|
|
|
|
|
|
|
400 |
|
|
|
|
|
300 |
|
|
|
|
|
200 |
|
|
|
|
|
100 |
OECD |
Non-OECD |
European Union |
Former Soviet Union |
World |
0 |
Coal remains the most abundant fossil fuel by global R/P ratio, although global oil and natural gas reserves have increased significantly over time. Non-OECD countries possess the majority of proved reserves for all fossil fuels, and have a higher R/P ratio than the OECD countries for oil and natural gas.
43