


 Natural gas
Proved reserves
|
At end 1992 |
At end 2002 |
At end 2011 |
|
|
|
|
At end 2012 |
|
|
|
|
|
Trillion |
Trillion |
Trillion |
|
|
Trillion |
Trillion |
|
|
|
|
|
|
cubic |
cubic |
cubic |
|
|
cubic |
cubic |
Share of |
R/P |
|||
|
metres |
metres |
metres |
|
|
feet |
metres |
|
total |
ratio |
||
US |
4.7 |
5.3 |
8.8 |
300.0 |
8.5 |
4.5% |
12.5 |
|
||||
Canada |
2.7 |
1.7 |
2.0 |
70.0 |
2.0 |
1.1% |
12.7 |
|
||||
Mexico |
2.0 |
0.4 |
0.4 |
12.7 |
0.4 |
0.2% |
6.2 |
|
||||
Total North America |
9.3 |
7.4 |
11.2 |
382.7 |
10.8 |
5.8% |
12.1 |
|
||||
Argentina |
0.5 |
0.7 |
0.3 |
11.3 |
0.3 |
0.2% |
8.5 |
|
||||
Bolivia |
0.1 |
0.8 |
0.3 |
11.2 |
0.3 |
0.2% |
17.0 |
|
||||
Brazil |
0.1 |
0.2 |
0.5 |
16.0 |
0.5 |
0.2% |
26.0 |
|
||||
Colombia |
0.2 |
0.1 |
0.2 |
5.5 |
0.2 |
0.1% |
12.9 |
|
||||
Peru |
0.3 |
0.2 |
0.4 |
12.7 |
0.4 |
0.2% |
27.9 |
|
||||
Trinidad & Tobago |
0.2 |
0.6 |
0.4 |
13.3 |
0.4 |
0.2% |
8.9 |
|
||||
Venezuela |
3.7 |
4.2 |
5.5 |
196.4 |
5.6 |
3.0% |
* |
|
||||
Other S. & Cent. America |
0.2 |
0.1 |
0.1 |
2.0 |
0.1 |
|
|
15.5 |
|
|||
|
|
|
||||||||||
Total S. & Cent. America |
5.4 |
7.0 |
7.5 |
268.3 |
7.6 |
4.1% |
42.8 |
|
||||
Azerbaijan |
n/a |
0.9 |
0.9 |
31.5 |
0.9 |
0.5% |
57.1 |
|
||||
Denmark |
0.1 |
0.1 |
0.0 |
1.3 |
0.0 |
|
|
5.9 |
|
|||
|
|
|
||||||||||
Germany |
0.2 |
0.2 |
0.1 |
2.0 |
0.1 |
|
|
6.1 |
|
|||
|
|
|
||||||||||
Italy |
0.3 |
0.2 |
0.1 |
1.9 |
0.1 |
|
|
7.0 |
|
|||
|
|
|
||||||||||
Kazakhstan |
n/a |
1.3 |
1.3 |
45.7 |
1.3 |
0.7% |
65.6 |
|
||||
Netherlands |
1.7 |
1.4 |
1.0 |
36.7 |
1.0 |
0.6% |
16.3 |
|
||||
Norway |
1.4 |
2.1 |
2.1 |
73.8 |
2.1 |
1.1% |
18.2 |
|
||||
Poland |
0.2 |
0.1 |
0.1 |
4.2 |
0.1 |
0.1% |
28.3 |
|
||||
Romania |
0.5 |
0.3 |
0.1 |
3.6 |
0.1 |
0.1% |
9.3 |
|
||||
Russian Federation |
n/a |
29.8 |
32.9 |
1162.5 |
32.9 |
17.6% |
55.6 |
|
||||
Turkmenistan |
n/a |
2.3 |
17.5 |
618.1 |
17.5 |
9.3% |
* |
|
||||
Ukraine |
n/a |
0.7 |
0.7 |
22.7 |
0.6 |
0.3% |
34.6 |
|
||||
United Kingdom |
0.6 |
1.0 |
0.2 |
8.7 |
0.2 |
0.1% |
6.0 |
|
||||
Uzbekistan |
n/a |
1.2 |
1.1 |
39.7 |
1.1 |
0.6% |
19.7 |
|
||||
Other Europe & Eurasia |
34.7 |
0.4 |
0.3 |
10.1 |
0.3 |
0.2% |
29.2 |
|
||||
Total Europe & Eurasia |
39.6 |
42.1 |
58.4 |
2062.5 |
58.4 |
31.2% |
56.4 |
|
||||
Bahrain |
0.2 |
0.1 |
0.2 |
7.0 |
0.2 |
0.1% |
14.0 |
|
||||
Iran |
20.7 |
26.7 |
33.6 |
1187.3 |
33.6 |
18.0% |
* |
|
||||
Iraq |
3.1 |
3.2 |
3.6 |
126.7 |
3.6 |
1.9% |
* |
|
||||
Kuwait |
1.5 |
1.6 |
1.8 |
63.0 |
1.8 |
1.0% |
* |
|
||||
Oman |
0.2 |
0.9 |
0.9 |
33.5 |
0.9 |
0.5% |
32.8 |
|
||||
Qatar |
6.7 |
25.8 |
25.0 |
885.1 |
25.1 |
13.4% |
* |
|
||||
Saudi Arabia |
5.2 |
6.6 |
8.2 |
290.8 |
8.2 |
4.4% |
80.1 |
|
||||
Syria |
0.2 |
0.3 |
0.3 |
10.1 |
0.3 |
0.2% |
37.5 |
|
||||
United Arab Emirates |
5.8 |
6.1 |
6.1 |
215.1 |
6.1 |
3.3% |
* |
|
||||
Yemen |
0.4 |
0.5 |
0.5 |
16.9 |
0.5 |
0.3% |
63.1 |
|
||||
Other Middle East |
0.0 |
0.1 |
0.2 |
7.3 |
0.2 |
0.1% |
78.0 |
|
||||
Total Middle East |
44.0 |
71.8 |
80.4 |
2842.9 |
80.5 |
43.0% |
* |
|
||||
Algeria |
3.7 |
4.5 |
4.5 |
159.1 |
4.5 |
2.4% |
55.3 |
|
||||
Egypt |
0.4 |
1.7 |
2.2 |
72.0 |
2.0 |
1.1% |
33.5 |
|
||||
Libya |
1.3 |
1.5 |
1.5 |
54.6 |
1.5 |
0.8% |
* |
|
||||
Nigeria |
3.7 |
5.0 |
5.2 |
182.0 |
5.2 |
2.8% |
* |
|
||||
Other Africa |
0.8 |
1.1 |
1.3 |
44.3 |
1.3 |
0.7% |
68.1 |
|
||||
Total Africa |
9.9 |
13.8 |
14.7 |
512.0 |
14.5 |
7.7% |
67.1 |
|
||||
Australia |
1.0 |
2.5 |
3.8 |
132.8 |
3.8 |
2.0% |
76.6 |
|
||||
Bangladesh |
0.3 |
0.3 |
0.3 |
6.5 |
0.2 |
0.1% |
8.4 |
|
||||
Brunei |
0.4 |
0.3 |
0.3 |
10.2 |
0.3 |
0.2% |
22.9 |
|
||||
China |
1.4 |
1.3 |
3.1 |
109.3 |
3.1 |
1.7% |
28.9 |
|
||||
India |
0.7 |
0.8 |
1.3 |
47.0 |
1.3 |
0.7% |
33.1 |
|
||||
Indonesia |
1.8 |
2.6 |
3.0 |
103.3 |
2.9 |
1.6% |
41.2 |
|
||||
Malaysia |
1.7 |
2.5 |
1.2 |
46.8 |
1.3 |
0.7% |
20.3 |
|
||||
Myanmar |
0.3 |
0.4 |
0.2 |
7.8 |
0.2 |
0.1% |
17.4 |
|
||||
Pakistan |
0.6 |
0.8 |
0.7 |
22.7 |
0.6 |
0.3% |
15.5 |
|
||||
Papua New Guinea |
0.4 |
0.4 |
0.4 |
15.6 |
0.4 |
0.2% |
* |
|
||||
Thailand |
0.2 |
0.4 |
0.3 |
10.1 |
0.3 |
0.2% |
6.9 |
|
||||
Vietnam |
0.1 |
0.2 |
0.6 |
21.8 |
0.6 |
0.3% |
65.6 |
|
||||
Other Asia Pacific |
0.3 |
0.4 |
0.3 |
11.8 |
0.3 |
0.2% |
18.6 |
|
||||
Total Asia Pacific |
9.4 |
13.0 |
15.5 |
545.6 |
15.5 |
8.2% |
31.5 |
|
||||
Total World |
117.6 |
154.9 |
187.8 |
6614.1 |
187.3 |
100.0% |
55.7 |
|
||||
of which: OECD |
15.2 |
15.4 |
19.0 |
658.4 |
18.6 |
10.0% |
15.4 |
|
||||
Non-OECD |
102.4 |
139.5 |
168.8 |
5955.7 |
168.6 |
90.0% |
78.4 |
|
||||
European Union |
3.8 |
3.4 |
1.8 |
61.7 |
1.7 |
0.9% |
11.7 |
|
||||
Former Soviet Union |
34.3 |
36.4 |
54.5 |
1924.1 |
54.5 |
29.1% |
71.0 |
|
||||
*More than 100 years.Less than 0.05%.
n/a not available.
Notes: Proved reserves of natural gas – Generally taken to be those quantities that geological and engineering information indicates with reasonable certainty can be recovered in the future
from known reservoirs under existing economic and operating conditions.
Reserves-to-production (R/P) ratio – If the reserves remaining at the end of any year are divided by the production in that year, the result is the length of time that those remaining reserves
would last if production were to continue at that rate.
Source of data – The estimates in this table have been compiled using a combination of primary official sources and third-party data from Cedigaz and the OPEC Secretariat.
20
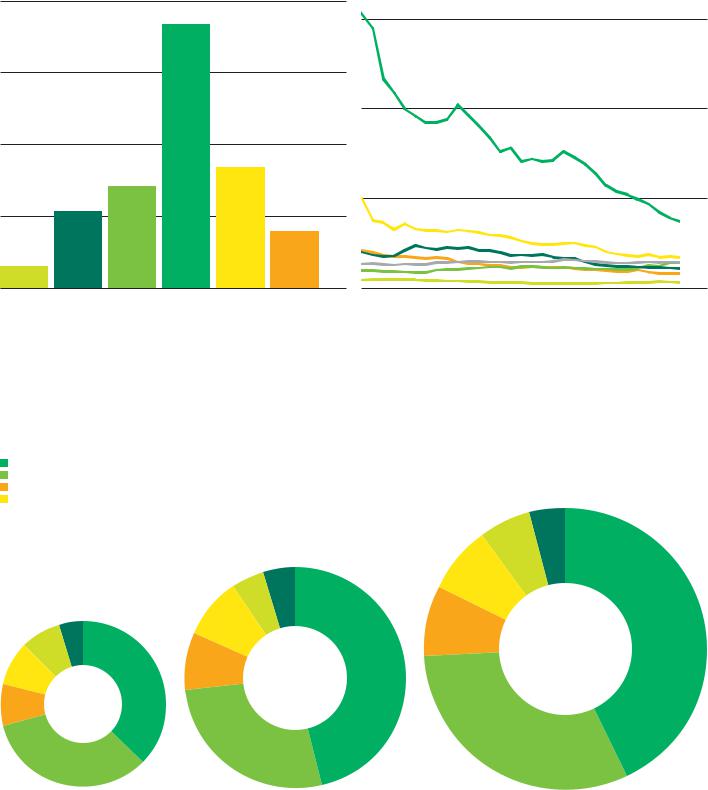
Reserves-to-production (R/P) ratios
Years
2012 by region |
History |
200 |
|
|
North America |
|
Middle East |
800 |
|
|
|
||||
|
|
|
|
|
||
|
|
|
S. & Cent. America |
|
Asia Pacific |
|
|
|
|
|
|
||
|
|
|
|
|
||
|
|
|
Europe & Eurasia |
|
World |
|
|
|
|
|
|
||
|
|
|
|
|
||
|
|
|
Africa |
|
|
|
|
|
|
|
|
|
|
|
|
|
|
|
|
|
|
|
|
|
|
160 |
|
|
|
|
|
|
|
|
|
|
|
|
|
|
|
|
|
|
|
|
|
|
600 |
|
|
|
|
|
|
120 |
|
|
|
|
|
|
|
|
|
|
|
|
|
|
|
|
|
|
|
|
|
|
400 |
|
|
|
|
|
|
80 |
|
|
|
|
|
|
|
|
|
|
|
|
|
|
|
|
|
|
|
|
|
|
200 |
|
|
|
|
|
|
40 |
|
|
|
|
|
|
|
|
North |
S. & Cent. |
Europe & |
Middle |
Africa |
Asia |
0 |
82 |
87 |
92 |
97 |
02 |
07 |
12 |
0 |
America |
America |
Eurasia |
East |
|
Pacific |
|
|
|
|
|
|
|
|
|
World proved natural gas reserves at end-2012 stood at 187.3 trillion cubic metres, sufficient to meet 55.7 years of global production. Proved reserves declined by 0.3% relative to end-2011 data, the first annual decline in our data set. Revisions were made to the earlier published estimates for proved reserves in the Former Soviet Union (FSU) countries, which lowered the FSU R/P ratio to 71 years, from 96.3 years at end-2011 in last year’s edition.
Distribution of proved reserves in 1992, 2002 and 2012
Percentage
Middle East
Europe & Eurasia
Asia Pacific
Africa
|
North America |
4.1 |
43.0 |
|
|||
|
S. & Cent. America |
||
|
5.8 |
|
|
|
|
|
4.546.3
|
|
4.8 |
|
7.7 |
|
|
|
|
|
4.6 |
37.4 |
8.9 |
|
2012 |
|
|
|
|
|
7.9 |
|
|
8.2 |
Total 187.3 |
|
|
|
trillion cubic |
|
|
|
2002 |
|
|
|
|
|
metres |
|
8.4 |
8.4 |
Total 154.9 |
|
|
trillion cubic |
|
|
||
|
|
|
||
1992 |
metres |
|
|
|
Total 117.6 |
|
|
||
|
|
|
||
8.0 |
trillion cubic |
|
metres |
||
|
||
|
33.7 |
|
|
31.2 |
|
|
27.1 |
21

Production*
|
|
|
|
|
|
|
|
|
|
|
|
|
Change |
2012 |
|
|
|
|
|
|
|
|
|
|
|
|
|
2012 over |
share of |
|
Billion cubic metres |
2002 |
2003 |
2004 |
2005 |
2006 |
2007 |
2008 |
2009 |
2010 |
2011 |
2012 |
2011 |
total |
|
US |
536.0 |
540.8 |
526.4 |
511.1 |
524.0 |
545.6 |
570.8 |
584.0 |
603.6 |
648.5 |
681.4 |
4.7% |
20.4% |
|
Canada |
187.9 |
184.7 |
183.7 |
187.1 |
188.4 |
182.7 |
176.6 |
164.0 |
159.9 |
159.7 |
156.5 |
-2.3% |
4.6% |
|
Mexico |
39.7 |
41.7 |
43.4 |
52.3 |
57.3 |
53.7 |
53.4 |
59.4 |
57.6 |
58.3 |
58.5 |
0.1% |
1.7% |
|
Total North America |
763.6 |
767.2 |
753.6 |
750.6 |
769.7 |
781.9 |
800.8 |
807.4 |
821.1 |
866.5 |
896.4 |
3.1% |
26.8% |
|
Argentina |
36.1 |
41.0 |
44.9 |
45.6 |
46.1 |
44.8 |
44.1 |
41.4 |
40.1 |
38.8 |
37.7 |
-3.0% |
1.1% |
|
Bolivia |
4.9 |
6.4 |
9.8 |
11.9 |
12.9 |
13.8 |
14.3 |
12.3 |
14.2 |
16.5 |
18.7 |
13.4% |
0.6% |
|
Brazil |
9.2 |
10.0 |
11.0 |
10.9 |
11.2 |
11.2 |
14.0 |
11.7 |
14.4 |
16.7 |
17.4 |
3.7% |
0.5% |
|
Colombia |
6.2 |
6.1 |
6.4 |
6.7 |
7.0 |
7.5 |
9.1 |
10.5 |
11.3 |
11.0 |
12.0 |
9.0% |
0.4% |
|
Peru |
0.4 |
0.5 |
0.9 |
1.5 |
1.8 |
2.7 |
3.4 |
3.5 |
7.2 |
11.3 |
12.9 |
13.7% |
0.4% |
|
Trinidad & Tobago |
19.3 |
27.0 |
30.2 |
33.0 |
40.1 |
42.2 |
42.0 |
43.6 |
44.8 |
42.9 |
42.2 |
-1.8% |
1.3% |
|
Venezuela |
28.4 |
25.2 |
28.4 |
27.4 |
31.5 |
29.5 |
30.0 |
28.7 |
31.0 |
31.3 |
32.8 |
4.7% |
1.0% |
|
Other S. & Cent. America |
3.3 |
3.1 |
3.1 |
3.4 |
3.8 |
3.9 |
3.7 |
4.2 |
3.6 |
3.1 |
3.6 |
14.4% |
0.1% |
|
Total S. & Cent. America |
107.9 |
119.4 |
134.7 |
140.5 |
154.3 |
155.7 |
160.4 |
155.9 |
166.6 |
171.5 |
177.3 |
3.1% |
5.3% |
|
Azerbaijan |
4.7 |
4.6 |
4.5 |
5.2 |
6.1 |
9.8 |
14.8 |
14.8 |
15.1 |
14.8 |
15.6 |
5.1% |
0.5% |
|
Denmark |
8.4 |
8.0 |
9.4 |
10.4 |
10.4 |
9.2 |
10.1 |
8.4 |
8.2 |
7.1 |
6.4 |
-9.4% |
0.2% |
|
Germany |
17.0 |
17.7 |
16.4 |
15.8 |
15.6 |
14.3 |
13.0 |
12.2 |
10.6 |
10.0 |
9.0 |
-9.8% |
0.3% |
|
Italy |
13.4 |
12.7 |
11.9 |
11.1 |
10.1 |
8.9 |
8.5 |
7.3 |
7.6 |
7.7 |
7.8 |
1.7% |
0.2% |
|
Kazakhstan |
9.1 |
11.9 |
13.1 |
13.5 |
13.9 |
16.7 |
18.7 |
17.8 |
17.6 |
19.3 |
19.7 |
2.0% |
0.6% |
|
Netherlands |
60.3 |
58.1 |
68.5 |
62.5 |
61.6 |
60.5 |
66.6 |
62.7 |
70.5 |
64.2 |
63.9 |
-0.8% |
1.9% |
|
Norway |
65.5 |
73.1 |
78.6 |
85.1 |
87.9 |
89.7 |
99.3 |
104.8 |
107.7 |
101.7 |
114.9 |
12.6% |
3.4% |
|
Poland |
4.0 |
4.0 |
4.4 |
4.3 |
4.3 |
4.3 |
4.1 |
4.1 |
4.1 |
4.3 |
4.2 |
-1.1% |
0.1% |
|
Romania |
13.2 |
13.0 |
12.8 |
12.4 |
11.9 |
11.5 |
11.4 |
11.3 |
10.9 |
10.9 |
10.9 |
|
0.3% |
|
|
|||||||||||||
|
Russian Federation |
538.8 |
561.5 |
573.3 |
580.1 |
595.2 |
592.0 |
601.7 |
527.7 |
588.9 |
607.0 |
592.3 |
-2.7% |
17.6% |
|
Turkmenistan |
48.4 |
53.5 |
52.8 |
57.0 |
60.4 |
65.4 |
66.1 |
36.4 |
42.4 |
59.5 |
64.4 |
7.8% |
1.9% |
|
Ukraine |
17.0 |
17.6 |
18.4 |
18.6 |
18.7 |
18.7 |
19.0 |
19.2 |
18.1 |
18.6 |
18.6 |
-0.8% |
0.6% |
|
United Kingdom |
103.6 |
102.9 |
96.4 |
88.2 |
80.0 |
72.1 |
73.5 |
62.4 |
59.7 |
47.6 |
41.0 |
-14.1% |
1.2% |
|
Uzbekistan |
51.9 |
52.0 |
54.2 |
54.0 |
54.5 |
59.1 |
62.2 |
60.0 |
59.6 |
57.0 |
56.9 |
-0.4% |
1.7% |
|
Other Europe & Eurasia |
11.2 |
10.6 |
11.0 |
10.9 |
11.5 |
10.8 |
10.3 |
9.7 |
10.2 |
10.2 |
9.8 |
-4.3% |
0.3% |
|
Total Europe & Eurasia |
966.5 |
1001.2 |
1025.5 |
1029.1 |
1042.1 |
1043.2 |
1079.3 |
958.8 |
1031.2 |
1039.9 |
1035.4 |
-0.7% |
30.7% |
|
Bahrain |
9.5 |
9.6 |
9.8 |
10.7 |
11.3 |
11.8 |
12.7 |
12.8 |
13.1 |
13.3 |
14.2 |
6.9% |
0.4% |
|
Iran |
75.0 |
81.5 |
84.9 |
103.5 |
108.6 |
111.9 |
116.3 |
131.2 |
146.2 |
151.8 |
160.5 |
5.4% |
4.8% |
|
Iraq |
2.4 |
1.6 |
1.0 |
1.5 |
1.5 |
1.5 |
1.9 |
1.2 |
1.3 |
0.9 |
0.8 |
-9.3% |
|
|
|
|||||||||||||
|
Kuwait |
9.5 |
11.0 |
11.9 |
12.2 |
12.5 |
12.1 |
12.8 |
11.5 |
11.7 |
13.5 |
14.5 |
7.2% |
0.4% |
|
Oman |
15.0 |
16.5 |
18.5 |
19.8 |
23.7 |
24.0 |
24.1 |
24.8 |
27.1 |
26.5 |
29.0 |
8.9% |
0.9% |
|
Qatar |
29.5 |
31.4 |
39.2 |
45.8 |
50.7 |
63.2 |
77.0 |
89.3 |
116.7 |
145.3 |
157.0 |
7.8% |
4.7% |
|
Saudi Arabia |
56.7 |
60.1 |
65.7 |
71.2 |
73.5 |
74.4 |
80.4 |
78.5 |
87.7 |
92.3 |
102.8 |
11.1% |
3.0% |
|
Syria |
6.1 |
6.2 |
6.4 |
5.5 |
5.6 |
5.6 |
5.3 |
5.6 |
8.0 |
8.7 |
7.6 |
-13.4% |
0.2% |
|
United Arab Emirates |
43.4 |
44.8 |
46.3 |
47.8 |
49.0 |
50.3 |
50.2 |
48.8 |
51.3 |
52.3 |
51.7 |
-1.5% |
1.5% |
|
Yemen |
– |
– |
– |
– |
– |
– |
– |
0.8 |
6.2 |
9.6 |
7.6 |
-21.3% |
0.2% |
|
Other Middle East |
0.3 |
0.3 |
1.5 |
1.9 |
2.6 |
3.0 |
3.6 |
3.0 |
3.4 |
4.4 |
2.7 |
-40.1% |
0.1% |
|
Total Middle East |
247.2 |
262.9 |
285.1 |
319.9 |
339.0 |
357.8 |
384.2 |
407.3 |
472.7 |
518.7 |
548.4 |
5.4% |
16.3% |
|
Algeria |
80.4 |
82.8 |
82.0 |
88.2 |
84.5 |
84.8 |
85.8 |
79.6 |
80.4 |
82.7 |
81.5 |
-1.7% |
2.4% |
|
Egypt |
27.3 |
30.1 |
33.0 |
42.5 |
54.7 |
55.7 |
59.0 |
62.7 |
61.3 |
61.4 |
60.9 |
-1.2% |
1.8% |
|
Libya |
5.9 |
5.5 |
8.1 |
11.3 |
13.2 |
15.3 |
15.9 |
15.9 |
16.8 |
7.9 |
12.2 |
54.8% |
0.4% |
|
Nigeria |
18.0 |
22.5 |
24.5 |
25.0 |
29.7 |
36.0 |
35.7 |
26.0 |
37.3 |
40.6 |
43.2 |
6.2% |
1.3% |
|
Other Africa |
6.6 |
7.2 |
8.9 |
9.9 |
10.4 |
12.3 |
15.8 |
16.3 |
18.4 |
18.6 |
18.4 |
-1.0% |
0.5% |
|
Total Africa |
138.2 |
148.2 |
156.4 |
177.0 |
192.5 |
204.1 |
212.2 |
200.4 |
214.3 |
211.2 |
216.2 |
2.1% |
6.4% |
|
Australia |
32.6 |
33.2 |
35.3 |
37.1 |
38.9 |
40.0 |
38.3 |
42.3 |
45.6 |
45.0 |
49.0 |
8.8% |
1.5% |
|
Bangladesh |
11.4 |
12.3 |
12.8 |
13.8 |
15.1 |
15.9 |
17.0 |
18.5 |
19.9 |
20.1 |
21.8 |
8.2% |
0.6% |
|
Brunei |
11.5 |
12.4 |
12.2 |
12.0 |
12.6 |
12.3 |
12.2 |
11.4 |
12.3 |
12.8 |
12.6 |
-2.1% |
0.4% |
|
China |
32.7 |
35.0 |
41.5 |
49.3 |
58.6 |
69.2 |
80.3 |
85.3 |
94.8 |
102.7 |
107.2 |
4.1% |
3.2% |
|
India |
27.6 |
29.5 |
29.2 |
29.6 |
29.3 |
30.1 |
30.5 |
39.2 |
50.8 |
46.1 |
40.2 |
-13.1% |
1.2% |
|
Indonesia |
69.7 |
73.2 |
70.3 |
71.2 |
70.3 |
67.6 |
69.7 |
71.9 |
82.0 |
75.9 |
71.1 |
-6.6% |
2.1% |
|
Malaysia |
48.3 |
51.8 |
53.9 |
61.1 |
63.3 |
64.6 |
64.7 |
63.4 |
65.2 |
65.3 |
65.2 |
-0.3% |
1.9% |
|
Myanmar |
8.4 |
9.6 |
10.2 |
12.2 |
12.6 |
13.5 |
12.4 |
11.6 |
12.4 |
12.8 |
12.7 |
-0.6% |
0.4% |
|
Pakistan |
24.6 |
30.4 |
34.5 |
35.5 |
36.1 |
36.8 |
37.5 |
38.4 |
39.6 |
39.2 |
41.5 |
5.6% |
1.2% |
|
Thailand |
20.5 |
21.5 |
22.4 |
23.7 |
24.3 |
26.0 |
28.8 |
30.9 |
36.3 |
37.0 |
41.4 |
11.5% |
1.2% |
|
Vietnam |
2.4 |
2.4 |
4.2 |
6.4 |
7.0 |
7.1 |
7.5 |
8.0 |
9.4 |
8.5 |
9.4 |
10.6% |
0.3% |
|
Other Asia Pacific |
10.8 |
10.6 |
10.0 |
11.0 |
14.6 |
17.4 |
18.3 |
18.6 |
18.1 |
18.4 |
18.1 |
-1.9% |
0.5% |
|
Total Asia Pacific |
300.5 |
322.0 |
336.4 |
363.0 |
382.6 |
400.5 |
417.1 |
439.6 |
486.5 |
483.6 |
490.2 |
1.1% |
14.5% |
|
Total World |
2523.9 |
2620.7 |
2691.6 |
2780.0 |
2880.1 |
2943.2 |
3054.0 |
2969.3 |
3192.3 |
3291.3 |
3363.9 |
1.9% |
100.0% |
|
of which: OECD |
1087.2 |
1093.8 |
1092.2 |
1083.8 |
1097.7 |
1100.7 |
1134.1 |
1131.4 |
1155.2 |
1174.0 |
1211.5 |
2.9% |
36.1% |
|
Non-OECD |
1436.8 |
1526.9 |
1599.3 |
1696.3 |
1782.4 |
1842.5 |
1919.9 |
1837.9 |
2037.1 |
2117.3 |
2152.5 |
1.4% |
63.9% |
|
European Union |
227.6 |
223.6 |
227.3 |
212.0 |
201.3 |
187.5 |
193.3 |
174.3 |
177.8 |
157.9 |
149.6 |
-5.5% |
4.4% |
|
Former Soviet Union |
670.2 |
701.4 |
716.6 |
728.7 |
749.0 |
762.0 |
782.7 |
676.0 |
741.9 |
776.5 |
767.7 |
-1.4% |
22.8% |
*Excluding gas flared or recycled. |
|
|
|
|
|
|
|
|
|
Source: Includes data from Cedigaz. |
||||
Less than 0.05%.
Notes: As far as possible, the data above represents standard cubic metres (measured at 15ºC and 1013 mbar); as they are derived directly from tonnes of oil equivalent using an average conversion factor, they do not necessarily equate with gas volumes expressed in specific national terms.
Annual changes and shares of total are calculated using million tonnes of oil equivalent figures.
Natural gas production data expressed in billion cubic feet per day is available at bp.com/statisticalreview.
Growth rates are adjusted for leap years.
22

Consumption
|
|
|
|
|
|
|
|
|
|
|
|
|
Change |
2012 |
|
|
|
|
|
|
|
|
|
|
|
|
|
2012 over |
share of |
|
Billion cubic metres |
2002 |
2003 |
2004 |
2005 |
2006 |
2007 |
2008 |
2009 |
2010 |
2011 |
2012 |
2011 |
total |
|
US |
652.1 |
630.8 |
634.4 |
623.4 |
614.4 |
654.2 |
659.1 |
648.7 |
682.1 |
690.5 |
722.1 |
4.1% |
21.9% |
|
Canada |
90.2 |
97.7 |
95.1 |
97.8 |
96.9 |
96.2 |
96.1 |
94.9 |
95.0 |
100.9 |
100.7 |
-0.4% |
3.0% |
|
Mexico |
46.5 |
51.4 |
54.3 |
61.0 |
66.6 |
63.5 |
66.3 |
72.4 |
72.5 |
76.6 |
83.7 |
8.9% |
2.5% |
|
Total North America |
788.7 |
779.9 |
783.8 |
782.2 |
778.0 |
813.9 |
821.5 |
816.1 |
849.6 |
868.0 |
906.5 |
4.0% |
27.5% |
|
Argentina |
30.3 |
34.6 |
37.9 |
40.4 |
41.8 |
43.9 |
44.4 |
43.2 |
43.3 |
45.7 |
47.3 |
3.3% |
1.4% |
|
Brazil |
14.1 |
15.8 |
18.8 |
19.6 |
20.6 |
21.2 |
24.9 |
20.1 |
26.8 |
26.7 |
29.2 |
8.9% |
0.9% |
|
Chile |
7.4 |
8.0 |
8.7 |
8.4 |
7.8 |
4.6 |
2.7 |
3.1 |
5.3 |
5.4 |
6.0 |
11.7% |
0.2% |
|
Colombia |
6.1 |
6.0 |
6.3 |
6.7 |
7.0 |
7.4 |
7.6 |
8.7 |
9.1 |
8.8 |
9.8 |
10.9% |
0.3% |
|
Ecuador |
0.1 |
0.3 |
0.3 |
0.3 |
0.4 |
0.5 |
0.4 |
0.5 |
0.6 |
0.5 |
0.7 |
30.8% |
♦ |
|
|
|||||||||||||
|
Peru |
0.4 |
0.5 |
0.9 |
1.5 |
1.8 |
2.7 |
3.4 |
3.5 |
5.4 |
6.1 |
7.5 |
21.7% |
0.2% |
|
Trinidad & Tobago |
12.0 |
13.4 |
14.8 |
16.3 |
21.2 |
21.9 |
21.3 |
22.2 |
23.2 |
23.1 |
21.7 |
-6.2% |
0.7% |
|
Venezuela |
28.4 |
25.2 |
28.4 |
27.4 |
31.5 |
29.6 |
31.5 |
30.5 |
33.2 |
33.4 |
34.9 |
4.4% |
1.1% |
|
Other S. & Cent. America |
2.4 |
3.1 |
3.0 |
3.3 |
3.9 |
4.5 |
4.7 |
5.0 |
5.4 |
6.7 |
7.9 |
18.4% |
0.2% |
|
Total S. & Cent. America |
101.3 |
106.8 |
119.0 |
123.9 |
136.0 |
136.3 |
140.9 |
136.8 |
152.2 |
156.4 |
165.1 |
5.3% |
5.0% |
|
Austria |
8.5 |
9.4 |
9.5 |
10.0 |
9.4 |
8.9 |
9.5 |
9.3 |
10.1 |
9.5 |
9.0 |
-4.8% |
0.3% |
|
Azerbaijan |
7.5 |
7.7 |
8.3 |
8.6 |
9.1 |
8.0 |
9.2 |
7.8 |
7.4 |
8.1 |
8.5 |
3.7% |
0.3% |
|
Belarus |
16.1 |
15.8 |
17.9 |
18.4 |
19.0 |
18.8 |
19.2 |
16.1 |
19.7 |
18.3 |
18.6 |
1.1% |
0.6% |
|
Belgium |
14.9 |
16.0 |
16.2 |
16.4 |
16.7 |
16.6 |
16.5 |
16.8 |
18.8 |
16.6 |
16.9 |
1.7% |
0.5% |
|
Bulgaria |
2.7 |
2.8 |
2.8 |
3.1 |
3.2 |
3.2 |
3.2 |
2.3 |
2.6 |
2.9 |
2.7 |
-7.1% |
0.1% |
|
Czech Republic |
8.7 |
8.7 |
9.1 |
9.5 |
9.3 |
8.7 |
8.7 |
8.2 |
9.3 |
8.4 |
8.2 |
-2.9% |
0.2% |
|
Denmark |
5.1 |
5.2 |
5.2 |
5.0 |
5.1 |
4.6 |
4.6 |
4.4 |
5.0 |
4.2 |
3.9 |
-6.9% |
0.1% |
|
Finland |
4.0 |
4.5 |
4.3 |
4.0 |
4.2 |
3.9 |
4.0 |
3.6 |
3.9 |
3.4 |
3.1 |
-10.9% |
0.1% |
|
France |
40.7 |
43.2 |
45.1 |
45.4 |
44.0 |
42.6 |
44.3 |
42.6 |
47.4 |
40.9 |
42.5 |
3.7% |
1.3% |
|
Germany |
82.6 |
85.5 |
85.9 |
86.2 |
87.2 |
82.9 |
81.2 |
78.0 |
83.3 |
74.5 |
75.2 |
0.7% |
2.3% |
|
Greece |
2.1 |
2.4 |
2.7 |
2.7 |
3.1 |
3.8 |
4.0 |
3.4 |
3.7 |
4.5 |
4.2 |
-7.9% |
0.1% |
|
Hungary |
11.8 |
13.2 |
13.0 |
13.4 |
12.7 |
11.9 |
11.7 |
10.2 |
10.9 |
10.4 |
9.7 |
-6.5% |
0.3% |
|
Republic of Ireland |
4.1 |
4.1 |
4.1 |
3.9 |
4.5 |
4.8 |
5.0 |
4.8 |
5.2 |
4.6 |
4.5 |
-3.2% |
0.1% |
|
Italy |
64.6 |
71.2 |
73.9 |
79.1 |
77.4 |
77.8 |
77.8 |
71.5 |
76.1 |
71.3 |
68.7 |
-4.0% |
2.1% |
|
Kazakhstan |
8.7 |
9.6 |
7.5 |
9.3 |
9.9 |
8.4 |
8.1 |
7.8 |
8.2 |
9.2 |
9.5 |
2.6% |
0.3% |
|
Lithuania |
2.9 |
3.1 |
3.1 |
3.3 |
3.2 |
3.6 |
3.2 |
2.7 |
3.1 |
3.4 |
3.3 |
-2.6% |
0.1% |
|
Netherlands |
39.8 |
40.0 |
40.9 |
39.3 |
38.1 |
37.0 |
38.6 |
38.9 |
43.6 |
38.1 |
36.4 |
-4.5% |
1.1% |
|
Norway |
4.0 |
4.3 |
4.6 |
4.5 |
4.4 |
4.3 |
4.3 |
4.1 |
4.1 |
4.3 |
4.3 |
-1.0% |
0.1% |
|
Poland |
11.2 |
12.5 |
13.2 |
13.6 |
13.7 |
13.8 |
14.9 |
14.4 |
15.5 |
15.7 |
16.6 |
5.1% |
0.5% |
|
Portugal |
3.1 |
3.0 |
3.8 |
4.2 |
4.1 |
4.3 |
4.7 |
4.7 |
5.1 |
5.2 |
4.7 |
-9.8% |
0.1% |
|
Romania |
17.2 |
18.3 |
17.5 |
17.6 |
18.1 |
16.1 |
15.9 |
13.3 |
13.6 |
13.9 |
13.5 |
-3.5% |
0.4% |
|
Russian Federation |
370.7 |
379.5 |
389.3 |
394.0 |
415.0 |
422.0 |
416.0 |
389.6 |
414.1 |
424.6 |
416.2 |
-2.2% |
12.5% |
|
Slovakia |
6.5 |
6.3 |
6.1 |
6.6 |
6.0 |
5.7 |
5.7 |
4.9 |
5.6 |
5.2 |
6.0 |
15.8% |
0.2% |
|
Spain |
20.8 |
23.6 |
27.4 |
32.4 |
33.7 |
35.1 |
38.6 |
34.6 |
34.6 |
32.2 |
31.4 |
-2.8% |
0.9% |
|
Sweden |
0.8 |
0.8 |
0.8 |
0.8 |
0.9 |
1.0 |
0.9 |
1.1 |
1.6 |
1.3 |
1.1 |
-12.8% |
♦ |
|
|
|||||||||||||
|
Switzerland |
2.8 |
2.9 |
3.0 |
3.1 |
3.0 |
2.9 |
3.1 |
3.0 |
3.3 |
3.0 |
3.2 |
7.6% |
0.1% |
|
Turkey |
17.4 |
20.9 |
22.1 |
26.9 |
30.5 |
36.1 |
37.5 |
35.7 |
39.0 |
45.7 |
46.3 |
0.9% |
1.4% |
|
Turkmenistan |
12.9 |
14.2 |
15.0 |
16.1 |
18.4 |
21.3 |
20.5 |
19.9 |
22.6 |
25.0 |
23.3 |
-7.1% |
0.7% |
|
Ukraine |
67.7 |
69.0 |
68.5 |
69.0 |
67.0 |
63.2 |
60.0 |
47.0 |
52.1 |
53.7 |
49.6 |
-7.8% |
1.5% |
|
United Kingdom |
95.1 |
95.4 |
97.4 |
95.0 |
90.1 |
91.1 |
99.3 |
91.2 |
99.2 |
82.8 |
78.3 |
-5.7% |
2.4% |
|
Uzbekistan |
50.9 |
45.8 |
43.4 |
42.7 |
41.9 |
45.9 |
48.7 |
43.5 |
45.5 |
49.1 |
47.9 |
-2.8% |
1.4% |
|
Other Europe & Eurasia |
14.8 |
14.8 |
16.5 |
16.7 |
17.3 |
17.8 |
17.0 |
14.0 |
15.1 |
15.7 |
16.1 |
1.9% |
0.5% |
|
Total Europe & Eurasia |
1020.6 |
1053.9 |
1078.0 |
1100.5 |
1120.2 |
1125.9 |
1136.3 |
1049.5 |
1129.6 |
1105.8 |
1083.3 |
-2.3% |
32.6% |
|
Iran |
79.2 |
82.9 |
86.5 |
105.0 |
108.7 |
113.0 |
119.3 |
131.4 |
144.6 |
153.5 |
156.1 |
1.4% |
4.7% |
|
Israel |
† |
† |
1.2 |
1.7 |
2.3 |
2.8 |
4.1 |
4.5 |
5.3 |
5.0 |
2.6 |
-48.1% |
0.1% |
|
Kuwait |
9.5 |
11.0 |
11.9 |
12.2 |
12.5 |
12.1 |
12.8 |
12.4 |
14.5 |
17.0 |
17.2 |
0.9% |
0.5% |
|
Qatar |
11.1 |
12.2 |
15.0 |
18.7 |
19.6 |
19.3 |
19.3 |
20.0 |
19.9 |
21.9 |
26.2 |
18.9% |
0.8% |
|
Saudi Arabia |
56.7 |
60.1 |
65.7 |
71.2 |
73.5 |
74.4 |
80.4 |
78.5 |
87.7 |
92.3 |
102.8 |
11.1% |
3.1% |
|
United Arab Emirates |
36.4 |
37.9 |
40.2 |
42.1 |
43.4 |
49.2 |
59.5 |
59.1 |
60.8 |
62.5 |
62.9 |
0.4% |
1.9% |
|
Other Middle East |
24.6 |
25.0 |
26.5 |
28.4 |
31.5 |
32.4 |
36.5 |
38.9 |
44.0 |
42.6 |
44.0 |
3.1% |
1.3% |
|
Total Middle East |
217.6 |
229.0 |
247.1 |
279.2 |
291.5 |
303.2 |
331.9 |
344.6 |
376.8 |
394.7 |
411.8 |
4.0% |
12.4% |
|
Algeria |
20.2 |
21.4 |
22.0 |
23.2 |
23.7 |
24.3 |
25.4 |
27.2 |
26.3 |
27.8 |
30.9 |
10.8% |
0.9% |
|
Egypt |
26.5 |
29.7 |
31.7 |
31.6 |
36.5 |
38.4 |
40.8 |
42.5 |
45.1 |
49.6 |
52.6 |
5.7% |
1.6% |
|
South Africa |
1.0 |
1.0 |
2.1 |
3.1 |
3.5 |
3.5 |
3.7 |
3.4 |
3.9 |
3.9 |
3.8 |
-4.6% |
0.1% |
|
Other Africa |
21.8 |
22.7 |
25.4 |
27.6 |
25.7 |
29.3 |
30.9 |
26.9 |
32.4 |
32.6 |
35.5 |
8.8% |
1.1% |
|
Total Africa |
69.6 |
74.8 |
81.2 |
85.6 |
89.4 |
95.4 |
100.8 |
100.1 |
107.8 |
114.0 |
122.8 |
7.5% |
3.7% |
|
Australia |
22.4 |
22.4 |
22.8 |
22.2 |
24.4 |
26.6 |
25.5 |
25.2 |
25.7 |
25.6 |
25.4 |
-0.9% |
0.8% |
|
Bangladesh |
11.4 |
12.3 |
12.8 |
13.8 |
15.1 |
15.9 |
17.0 |
18.5 |
19.9 |
20.1 |
21.8 |
8.2% |
0.7% |
|
China |
29.2 |
33.9 |
39.7 |
46.8 |
56.1 |
70.5 |
81.3 |
89.5 |
106.9 |
130.5 |
143.8 |
9.9% |
4.3% |
|
China Hong Kong SAR |
2.9 |
1.8 |
2.7 |
2.7 |
2.9 |
2.7 |
3.2 |
3.1 |
3.8 |
3.1 |
2.8 |
-8.2% |
0.1% |
|
India |
27.6 |
29.5 |
31.9 |
35.7 |
37.3 |
40.1 |
41.3 |
51.0 |
61.9 |
61.1 |
54.6 |
-11.0% |
1.6% |
|
Indonesia |
32.9 |
35.0 |
32.2 |
33.2 |
33.2 |
31.3 |
33.3 |
37.4 |
40.3 |
37.3 |
35.8 |
-4.2% |
1.1% |
|
Japan |
72.7 |
79.8 |
77.0 |
78.6 |
83.7 |
90.2 |
93.7 |
87.4 |
94.5 |
105.5 |
116.7 |
10.3% |
3.5% |
|
Malaysia |
26.2 |
27.3 |
24.7 |
31.4 |
33.7 |
33.4 |
33.8 |
33.0 |
34.5 |
32.0 |
33.3 |
3.9% |
1.0% |
|
New Zealand |
5.6 |
4.3 |
3.9 |
3.6 |
3.7 |
4.1 |
3.8 |
4.0 |
4.3 |
3.9 |
4.2 |
8.8% |
0.1% |
|
Pakistan |
24.6 |
30.4 |
34.5 |
35.5 |
36.1 |
36.8 |
37.5 |
38.4 |
39.6 |
39.2 |
41.5 |
5.6% |
1.2% |
|
Philippines |
1.8 |
2.7 |
2.5 |
3.3 |
2.7 |
3.3 |
3.4 |
3.5 |
3.3 |
3.6 |
3.4 |
-4.3% |
0.1% |
|
Singapore |
3.6 |
4.0 |
5.0 |
6.8 |
7.1 |
8.6 |
8.2 |
8.1 |
8.4 |
8.8 |
8.3 |
-5.5% |
0.3% |
|
South Korea |
23.1 |
24.2 |
28.4 |
30.4 |
32.0 |
34.7 |
35.7 |
33.9 |
43.0 |
46.3 |
50.0 |
7.8% |
1.5% |
|
Taiwan |
7.4 |
7.7 |
9.3 |
9.4 |
10.1 |
10.7 |
11.6 |
11.3 |
14.1 |
15.5 |
16.3 |
4.7% |
0.5% |
|
Thailand |
26.9 |
28.6 |
29.9 |
32.5 |
33.3 |
35.4 |
37.4 |
39.2 |
45.1 |
46.6 |
51.2 |
9.6% |
1.5% |
|
Vietnam |
2.4 |
2.4 |
4.2 |
6.4 |
7.0 |
7.1 |
7.5 |
8.0 |
9.4 |
8.5 |
9.4 |
10.6% |
0.3% |
|
Other Asia Pacific |
3.6 |
4.2 |
4.5 |
5.2 |
5.5 |
6.0 |
5.7 |
5.2 |
5.7 |
6.2 |
6.3 |
1.1% |
0.2% |
|
Total Asia Pacific |
324.3 |
350.5 |
365.8 |
397.4 |
424.0 |
457.3 |
480.0 |
496.7 |
560.4 |
593.6 |
625.0 |
5.0% |
18.8% |
|
Total World |
2522.1 |
2595.0 |
2674.9 |
2768.9 |
2839.0 |
2932.1 |
3011.5 |
2943.9 |
3176.3 |
3232.4 |
3314.4 |
2.2% |
100.0% |
|
of which: OECD |
1371.4 |
1394.9 |
1417.1 |
1431.9 |
1433.3 |
1477.7 |
1505.4 |
1462.6 |
1556.2 |
1544.0 |
1588.3 |
2.5% |
48.0% |
|
Non-OECD |
1150.7 |
1200.1 |
1257.8 |
1337.0 |
1405.7 |
1454.4 |
1506.1 |
1481.3 |
1620.1 |
1688.4 |
1726.1 |
2.0% |
52.0% |
|
European Union |
451.7 |
473.9 |
486.7 |
496.1 |
489.7 |
482.1 |
497.3 |
465.1 |
502.9 |
453.1 |
443.9 |
-2.3% |
13.4% |
|
Former Soviet Union |
544.7 |
552.0 |
561.2 |
570.2 |
592.6 |
600.4 |
593.6 |
541.2 |
579.7 |
599.2 |
584.9 |
-2.6% |
17.6% |
†Less than 0.05. |
|
|
|
|
|
|
|
|
|
Source: Includes data from Cedigaz. |
||||
Less than 0.05%.
Notes: As far as possible, the data above represents standard cubic metres (measured at 15ºC and 1013 mbar); as they are derived directly from tonnes of oil equivalent using an average conversion factor, they do not necessarily equate with gas volumes expressed in specific national terms.
The difference between these world consumption figures and the world production statistics is due to variations in stocks at storage facilities and liquefaction plants, together with unavoidable disparities in the definition, measurement or conversion of gas supply and demand data.
Annual changes and shares of total are calculated using million tonnes of oil equivalent figures.
Natural gas production data expressed in billion cubic feet per day is available at bp.com/statisticalreview.
Growth rates are adjusted for leap years.
23

Production*
|
|
|
|
|
|
|
|
|
|
|
|
Change |
2012 |
|
|
|
|
|
|
|
|
|
|
|
|
2012 over |
share of |
Million tonnes oil equivalent |
2002 |
2003 |
2004 |
2005 |
2006 |
2007 |
2008 |
2009 |
2010 |
2011 |
2012 |
2011 |
total |
US |
489.9 |
494.8 |
480.7 |
467.6 |
479.3 |
498.6 |
521.7 |
532.7 |
549.5 |
589.8 |
619.2 |
4.7% |
20.4% |
Canada |
169.1 |
166.2 |
165.3 |
168.4 |
169.6 |
164.4 |
158.9 |
147.6 |
143.9 |
143.7 |
140.9 |
-2.3% |
4.6% |
Mexico |
35.8 |
37.5 |
39.1 |
47.1 |
51.6 |
48.3 |
48.0 |
53.4 |
51.8 |
52.4 |
52.6 |
0.1% |
1.7% |
Total North America |
694.7 |
698.5 |
685.1 |
683.1 |
700.5 |
711.3 |
728.6 |
733.7 |
745.2 |
786.0 |
812.7 |
3.1% |
26.8% |
Argentina |
32.5 |
36.9 |
40.4 |
41.1 |
41.5 |
40.3 |
39.7 |
37.2 |
36.1 |
34.9 |
34.0 |
-3.0% |
1.1% |
Bolivia |
4.4 |
5.7 |
8.8 |
10.7 |
11.6 |
12.4 |
12.9 |
11.1 |
12.8 |
14.8 |
16.8 |
13.4% |
0.6% |
Brazil |
8.3 |
9.0 |
9.9 |
9.8 |
10.0 |
10.1 |
12.6 |
10.5 |
13.0 |
15.1 |
15.7 |
3.7% |
0.5% |
Colombia |
5.6 |
5.5 |
5.7 |
6.0 |
6.3 |
6.8 |
8.2 |
9.5 |
10.1 |
9.9 |
10.8 |
9.0% |
0.4% |
Peru |
0.4 |
0.5 |
0.8 |
1.4 |
1.6 |
2.4 |
3.1 |
3.1 |
6.5 |
10.2 |
11.6 |
13.7% |
0.4% |
Trinidad & Tobago |
17.3 |
24.3 |
27.2 |
29.7 |
36.1 |
38.0 |
37.8 |
39.3 |
40.3 |
38.6 |
38.0 |
-1.8% |
1.3% |
Venezuela |
25.6 |
22.7 |
25.6 |
24.7 |
28.3 |
26.6 |
27.0 |
25.8 |
27.9 |
28.1 |
29.5 |
4.7% |
1.0% |
Other S. & Cent. America |
3.0 |
2.8 |
2.8 |
3.1 |
3.4 |
3.5 |
3.3 |
3.8 |
3.2 |
2.8 |
3.2 |
14.4% |
0.1% |
Total S. & Cent. America |
97.1 |
107.4 |
121.2 |
126.5 |
138.9 |
140.1 |
144.4 |
140.3 |
150.0 |
154.3 |
159.6 |
3.1% |
5.3% |
Azerbaijan |
4.2 |
4.2 |
4.1 |
4.7 |
5.5 |
8.8 |
13.3 |
13.3 |
13.6 |
13.3 |
14.0 |
5.1% |
0.5% |
Denmark |
7.5 |
7.2 |
8.5 |
9.4 |
9.4 |
8.3 |
9.1 |
7.6 |
7.4 |
6.4 |
5.8 |
-9.4% |
0.2% |
Germany |
15.3 |
15.9 |
14.7 |
14.2 |
14.1 |
12.9 |
11.7 |
11.0 |
9.6 |
9.0 |
8.1 |
-9.8% |
0.3% |
Italy |
12.1 |
11.5 |
10.7 |
10.0 |
9.1 |
8.0 |
7.6 |
6.6 |
6.8 |
6.9 |
7.0 |
1.7% |
0.2% |
Kazakhstan |
8.2 |
10.7 |
11.8 |
12.2 |
12.5 |
15.0 |
16.8 |
16.0 |
15.8 |
17.3 |
17.7 |
2.0% |
0.6% |
Netherlands |
54.3 |
52.2 |
61.6 |
56.3 |
55.4 |
54.5 |
60.0 |
56.4 |
63.5 |
57.8 |
57.5 |
-0.8% |
1.9% |
Norway |
59.0 |
65.8 |
70.7 |
76.6 |
79.1 |
80.7 |
89.4 |
94.3 |
96.9 |
91.6 |
103.4 |
12.6% |
3.4% |
Poland |
3.6 |
3.6 |
3.9 |
3.9 |
3.9 |
3.9 |
3.7 |
3.7 |
3.7 |
3.8 |
3.8 |
-1.1% |
0.1% |
Romania |
11.9 |
11.7 |
11.5 |
11.2 |
10.7 |
10.4 |
10.3 |
10.1 |
9.8 |
9.8 |
9.8 |
|
0.3% |
|
|||||||||||||
Russian Federation |
484.9 |
505.4 |
516.0 |
522.1 |
535.6 |
532.8 |
541.5 |
474.9 |
530.0 |
546.3 |
533.0 |
-2.7% |
17.6% |
Turkmenistan |
43.6 |
48.1 |
47.5 |
51.3 |
54.3 |
58.9 |
59.5 |
32.7 |
38.1 |
53.6 |
57.9 |
7.8% |
1.9% |
Ukraine |
15.3 |
15.8 |
16.5 |
16.7 |
16.9 |
16.9 |
17.1 |
17.3 |
16.3 |
16.8 |
16.7 |
-0.8% |
0.6% |
United Kingdom |
93.2 |
92.6 |
86.7 |
79.4 |
72.0 |
64.9 |
66.1 |
56.2 |
53.7 |
42.8 |
36.9 |
-14.1% |
1.2% |
Uzbekistan |
46.7 |
46.8 |
48.8 |
48.6 |
49.0 |
53.2 |
56.0 |
54.0 |
53.7 |
51.3 |
51.2 |
-0.4% |
1.7% |
Other Europe & Eurasia |
10.1 |
9.5 |
9.9 |
9.8 |
10.3 |
9.7 |
9.2 |
8.8 |
9.1 |
9.1 |
8.8 |
-4.3% |
0.3% |
Total Europe & Eurasia |
869.8 |
901.1 |
923.0 |
926.2 |
937.9 |
938.8 |
971.4 |
862.9 |
928.0 |
935.9 |
931.9 |
-0.7% |
30.7% |
Bahrain |
8.5 |
8.7 |
8.8 |
9.6 |
10.2 |
10.6 |
11.4 |
11.5 |
11.8 |
12.0 |
12.8 |
6.9% |
0.4% |
Iran |
67.5 |
73.4 |
76.4 |
93.2 |
97.7 |
100.7 |
104.7 |
118.0 |
131.5 |
136.6 |
144.5 |
5.4% |
4.8% |
Iraq |
2.1 |
1.4 |
0.9 |
1.3 |
1.3 |
1.3 |
1.7 |
1.0 |
1.2 |
0.8 |
0.7 |
-9.3% |
|
|
|||||||||||||
Kuwait |
8.5 |
9.9 |
10.7 |
11.0 |
11.3 |
10.9 |
11.5 |
10.3 |
10.6 |
12.2 |
13.1 |
7.2% |
0.4% |
Oman |
13.5 |
14.9 |
16.7 |
17.8 |
21.3 |
21.6 |
21.7 |
22.3 |
24.4 |
23.9 |
26.1 |
8.9% |
0.9% |
Qatar |
26.6 |
28.3 |
35.3 |
41.2 |
45.6 |
56.9 |
69.3 |
80.4 |
105.0 |
130.7 |
141.3 |
7.8% |
4.7% |
Saudi Arabia |
51.0 |
54.1 |
59.1 |
64.1 |
66.2 |
67.0 |
72.4 |
70.6 |
78.9 |
83.0 |
92.5 |
11.1% |
3.0% |
Syria |
5.5 |
5.6 |
5.8 |
4.9 |
5.1 |
5.0 |
4.8 |
5.0 |
7.2 |
7.9 |
6.8 |
-13.4% |
0.2% |
United Arab Emirates |
39.1 |
40.3 |
41.7 |
43.0 |
44.1 |
45.3 |
45.2 |
43.9 |
46.2 |
47.1 |
46.5 |
-1.5% |
1.5% |
Yemen |
– |
– |
– |
– |
– |
– |
– |
0.7 |
5.6 |
8.7 |
6.8 |
-21.3% |
0.2% |
Other Middle East |
0.2 |
0.2 |
1.3 |
1.7 |
2.3 |
2.7 |
3.3 |
2.7 |
3.0 |
4.0 |
2.4 |
-40.1% |
0.1% |
Total Middle East |
222.5 |
236.6 |
256.6 |
287.9 |
305.1 |
322.0 |
345.8 |
366.6 |
425.4 |
466.8 |
493.6 |
5.4% |
16.3% |
Algeria |
72.3 |
74.5 |
73.8 |
79.4 |
76.0 |
76.3 |
77.2 |
71.6 |
72.4 |
74.4 |
73.4 |
-1.7% |
2.4% |
Egypt |
24.6 |
27.1 |
29.7 |
38.3 |
49.2 |
50.1 |
53.1 |
56.4 |
55.2 |
55.3 |
54.8 |
-1.2% |
1.8% |
Libya |
5.3 |
5.0 |
7.3 |
10.2 |
11.9 |
13.8 |
14.3 |
14.3 |
15.1 |
7.1 |
11.0 |
54.8% |
0.4% |
Nigeria |
16.2 |
20.3 |
22.0 |
22.5 |
26.7 |
32.4 |
32.1 |
23.4 |
33.6 |
36.5 |
38.9 |
6.2% |
1.3% |
Other Africa |
6.0 |
6.5 |
8.0 |
8.9 |
9.4 |
11.1 |
14.2 |
14.7 |
16.6 |
16.7 |
16.6 |
-1.0% |
0.5% |
Total Africa |
124.4 |
133.4 |
140.7 |
159.3 |
173.2 |
183.7 |
190.9 |
180.4 |
192.8 |
190.0 |
194.6 |
2.1% |
6.4% |
Australia |
29.3 |
29.9 |
31.7 |
33.4 |
35.0 |
36.0 |
34.4 |
38.1 |
41.0 |
40.5 |
44.1 |
8.8% |
1.5% |
Bangladesh |
10.3 |
11.1 |
11.5 |
12.4 |
13.6 |
14.3 |
15.3 |
16.7 |
17.9 |
18.1 |
19.6 |
8.2% |
0.6% |
Brunei |
10.3 |
11.1 |
11.0 |
10.8 |
11.3 |
11.0 |
10.9 |
10.3 |
11.1 |
11.5 |
11.3 |
-2.1% |
0.4% |
China |
29.4 |
31.5 |
37.3 |
44.4 |
52.7 |
62.3 |
72.3 |
76.7 |
85.4 |
92.4 |
96.5 |
4.1% |
3.2% |
India |
24.8 |
26.6 |
26.3 |
26.7 |
26.4 |
27.1 |
27.5 |
35.3 |
45.8 |
41.5 |
36.2 |
-13.1% |
1.2% |
Indonesia |
62.7 |
65.9 |
63.3 |
64.1 |
63.2 |
60.9 |
62.7 |
64.7 |
73.8 |
68.3 |
64.0 |
-6.6% |
2.1% |
Malaysia |
43.5 |
46.6 |
48.5 |
55.0 |
57.0 |
58.1 |
58.2 |
57.0 |
58.7 |
58.7 |
58.7 |
-0.3% |
1.9% |
Myanmar |
7.6 |
8.6 |
9.2 |
11.0 |
11.3 |
12.2 |
11.2 |
10.4 |
11.2 |
11.5 |
11.5 |
-0.6% |
0.4% |
Pakistan |
22.1 |
27.4 |
31.0 |
32.0 |
32.5 |
33.1 |
33.8 |
34.6 |
35.7 |
35.2 |
37.3 |
5.6% |
1.2% |
Thailand |
18.5 |
19.3 |
20.1 |
21.3 |
21.9 |
23.4 |
25.9 |
27.8 |
32.7 |
33.3 |
37.3 |
11.5% |
1.2% |
Vietnam |
2.2 |
2.1 |
3.7 |
5.8 |
6.3 |
6.4 |
6.7 |
7.2 |
8.5 |
7.6 |
8.5 |
10.6% |
0.3% |
Other Asia Pacific |
9.7 |
9.6 |
9.0 |
9.9 |
13.1 |
15.6 |
16.5 |
16.7 |
16.3 |
16.5 |
16.3 |
-1.9% |
0.5% |
Total Asia Pacific |
270.5 |
289.8 |
302.7 |
326.7 |
344.3 |
360.4 |
375.4 |
395.6 |
437.8 |
435.2 |
441.2 |
1.1% |
14.5% |
Total World |
2279.0 |
2366.7 |
2429.3 |
2509.6 |
2599.9 |
2656.5 |
2756.6 |
2679.5 |
2879.3 |
2968.3 |
3033.5 |
1.9% |
100.0% |
of which: OECD |
985.9 |
992.4 |
989.9 |
983.0 |
995.7 |
998.2 |
1028.7 |
1025.4 |
1045.9 |
1062.7 |
1096.2 |
2.9% |
36.1% |
Non-OECD |
1293.1 |
1374.2 |
1439.4 |
1526.6 |
1604.2 |
1658.3 |
1727.9 |
1654.1 |
1833.4 |
1905.6 |
1937.2 |
1.4% |
63.9% |
European Union |
204.9 |
201.2 |
204.6 |
190.8 |
181.2 |
168.7 |
174.0 |
156.8 |
160.0 |
142.1 |
134.7 |
-5.5% |
4.4% |
Former Soviet Union |
603.2 |
631.3 |
644.9 |
655.8 |
674.1 |
685.8 |
704.4 |
608.4 |
667.7 |
698.9 |
690.9 |
-1.4% |
22.8% |
*Excluding gas flared or recycled.Less than 0.05%.
Note: Growth rates are adjusted for leap years.
Source: Includes data from Cedigaz.
24

Consumption
|
|
|
|
|
|
|
|
|
|
|
|
|
Change |
2012 |
|
|
|
|
|
|
|
|
|
|
|
|
|
2012 over |
share of |
|
Million tonnes oil equivalent |
2002 |
2003 |
2004 |
2005 |
2006 |
2007 |
2008 |
2009 |
2010 |
2011 |
2012 |
2011 |
total |
|
US |
593.7 |
575.3 |
577.3 |
568.5 |
560.0 |
597.3 |
600.6 |
590.1 |
619.3 |
626.5 |
654.0 |
4.1% |
21.9% |
|
Canada |
81.2 |
87.9 |
85.6 |
88.0 |
87.3 |
86.6 |
86.5 |
85.4 |
85.5 |
90.8 |
90.6 |
-0.4% |
3.0% |
|
Mexico |
41.8 |
46.3 |
48.9 |
54.9 |
60.0 |
57.1 |
59.6 |
65.2 |
65.2 |
69.0 |
75.3 |
8.9% |
2.5% |
|
Total North America |
716.6 |
709.5 |
711.8 |
711.5 |
707.2 |
741.0 |
746.7 |
740.7 |
770.1 |
786.2 |
820.0 |
4.0% |
27.5% |
|
Argentina |
27.2 |
31.1 |
34.1 |
36.4 |
37.6 |
39.5 |
40.0 |
38.8 |
39.0 |
41.1 |
42.6 |
3.3% |
1.4% |
|
Brazil |
12.7 |
14.2 |
16.9 |
17.6 |
18.5 |
19.1 |
22.4 |
18.1 |
24.1 |
24.0 |
26.2 |
8.9% |
0.9% |
|
Chile |
6.6 |
7.2 |
7.8 |
7.5 |
7.0 |
4.1 |
2.4 |
2.8 |
4.8 |
4.8 |
5.4 |
11.7% |
0.2% |
|
Colombia |
5.5 |
5.4 |
5.7 |
6.0 |
6.3 |
6.7 |
6.8 |
7.8 |
8.2 |
8.0 |
8.9 |
10.9% |
0.3% |
|
Ecuador |
0.1 |
0.2 |
0.3 |
0.3 |
0.4 |
0.4 |
0.4 |
0.5 |
0.5 |
0.5 |
0.6 |
30.8% |
♦ |
|
|
|||||||||||||
|
Peru |
0.4 |
0.5 |
0.8 |
1.4 |
1.6 |
2.4 |
3.1 |
3.1 |
4.9 |
5.5 |
6.7 |
21.7% |
0.2% |
|
Trinidad & Tobago |
10.8 |
12.0 |
13.3 |
14.7 |
19.1 |
19.7 |
19.2 |
19.9 |
20.9 |
20.8 |
19.5 |
-6.2% |
0.7% |
|
Venezuela |
25.6 |
22.7 |
25.6 |
24.7 |
28.3 |
26.6 |
28.3 |
27.5 |
29.9 |
30.0 |
31.4 |
4.4% |
1.1% |
|
Other S. & Cent. America |
2.2 |
2.8 |
2.7 |
2.9 |
3.5 |
4.0 |
4.3 |
4.5 |
4.8 |
6.0 |
7.1 |
18.4% |
0.2% |
|
Total S. & Cent. America |
91.2 |
96.1 |
107.1 |
111.5 |
122.4 |
122.7 |
126.8 |
123.1 |
137.0 |
140.8 |
148.6 |
5.3% |
5.0% |
|
Austria |
7.7 |
8.5 |
8.5 |
9.0 |
8.5 |
8.0 |
8.6 |
8.4 |
9.1 |
8.5 |
8.1 |
-4.8% |
0.3% |
|
Azerbaijan |
6.8 |
7.0 |
7.5 |
7.7 |
8.2 |
7.2 |
8.2 |
7.0 |
6.7 |
7.3 |
7.6 |
3.7% |
0.3% |
|
Belarus |
14.5 |
14.3 |
16.1 |
16.5 |
17.1 |
17.0 |
17.3 |
14.5 |
17.7 |
16.5 |
16.7 |
1.1% |
0.6% |
|
Belgium |
13.4 |
14.4 |
14.6 |
14.7 |
15.0 |
14.9 |
14.8 |
15.1 |
17.0 |
14.9 |
15.2 |
1.7% |
0.5% |
|
Bulgaria |
2.4 |
2.5 |
2.5 |
2.8 |
2.9 |
2.9 |
2.9 |
2.1 |
2.3 |
2.6 |
2.5 |
-7.1% |
0.1% |
|
Czech Republic |
7.8 |
7.8 |
8.2 |
8.5 |
8.4 |
7.8 |
7.8 |
7.4 |
8.4 |
7.6 |
7.4 |
-2.9% |
0.2% |
|
Denmark |
4.6 |
4.7 |
4.7 |
4.5 |
4.6 |
4.1 |
4.1 |
4.0 |
4.5 |
3.8 |
3.5 |
-6.9% |
0.1% |
|
Finland |
3.6 |
4.0 |
3.9 |
3.6 |
3.8 |
3.5 |
3.6 |
3.2 |
3.6 |
3.1 |
2.8 |
-10.9% |
0.1% |
|
France |
36.6 |
38.9 |
40.6 |
40.9 |
39.6 |
38.3 |
39.8 |
38.3 |
42.7 |
36.8 |
38.2 |
3.7% |
1.3% |
|
Germany |
74.3 |
77.0 |
77.3 |
77.6 |
78.5 |
74.6 |
73.1 |
70.2 |
75.0 |
67.1 |
67.7 |
0.7% |
2.3% |
|
Greece |
1.9 |
2.2 |
2.4 |
2.4 |
2.8 |
3.4 |
3.6 |
3.0 |
3.3 |
4.1 |
3.8 |
-7.9% |
0.1% |
|
Hungary |
10.6 |
11.9 |
11.7 |
12.1 |
11.5 |
10.7 |
10.6 |
9.1 |
9.8 |
9.4 |
8.8 |
-6.5% |
0.3% |
|
Republic of Ireland |
3.7 |
3.7 |
3.7 |
3.5 |
4.0 |
4.3 |
4.5 |
4.3 |
4.7 |
4.1 |
4.0 |
-3.2% |
0.1% |
|
Italy |
58.1 |
64.1 |
66.5 |
71.2 |
69.7 |
70.0 |
70.0 |
64.4 |
68.5 |
64.2 |
61.8 |
-4.0% |
2.1% |
|
Kazakhstan |
7.8 |
8.6 |
6.7 |
8.4 |
8.9 |
7.5 |
7.3 |
7.0 |
7.4 |
8.3 |
8.5 |
2.6% |
0.3% |
|
Lithuania |
2.6 |
2.8 |
2.8 |
2.9 |
2.9 |
3.3 |
2.9 |
2.5 |
2.8 |
3.1 |
3.0 |
-2.6% |
0.1% |
|
Netherlands |
35.8 |
36.0 |
36.8 |
35.4 |
34.3 |
33.3 |
34.7 |
35.0 |
39.2 |
34.3 |
32.8 |
-4.5% |
1.1% |
|
Norway |
3.6 |
3.9 |
4.1 |
4.0 |
4.0 |
3.8 |
3.9 |
3.7 |
3.7 |
3.9 |
3.9 |
-1.0% |
0.1% |
|
Poland |
10.1 |
11.3 |
11.9 |
12.2 |
12.4 |
12.4 |
13.5 |
13.0 |
14.0 |
14.1 |
14.9 |
5.1% |
0.5% |
|
Portugal |
2.8 |
2.7 |
3.4 |
3.8 |
3.7 |
3.9 |
4.3 |
4.2 |
4.6 |
4.7 |
4.2 |
-9.8% |
0.1% |
|
Romania |
15.5 |
16.5 |
15.7 |
15.8 |
16.3 |
14.5 |
14.3 |
11.9 |
12.2 |
12.5 |
12.1 |
-3.5% |
0.4% |
|
Russian Federation |
333.6 |
341.5 |
350.4 |
354.6 |
373.5 |
379.8 |
374.4 |
350.7 |
372.7 |
382.1 |
374.6 |
-2.2% |
12.5% |
|
Slovakia |
5.8 |
5.7 |
5.5 |
5.9 |
5.4 |
5.1 |
5.2 |
4.4 |
5.0 |
4.6 |
5.4 |
15.8% |
0.2% |
|
Spain |
18.8 |
21.3 |
24.7 |
29.1 |
30.3 |
31.6 |
34.8 |
31.1 |
31.2 |
29.0 |
28.2 |
-2.8% |
0.9% |
|
Sweden |
0.7 |
0.7 |
0.7 |
0.7 |
0.8 |
0.9 |
0.8 |
1.0 |
1.4 |
1.1 |
1.0 |
-12.8% |
♦ |
|
|
|||||||||||||
|
Switzerland |
2.5 |
2.6 |
2.7 |
2.8 |
2.7 |
2.6 |
2.8 |
2.7 |
3.0 |
2.7 |
2.9 |
7.6% |
0.1% |
|
Turkey |
15.6 |
18.8 |
19.9 |
24.2 |
27.4 |
32.5 |
33.8 |
32.1 |
35.1 |
41.2 |
41.7 |
0.9% |
1.4% |
|
Turkmenistan |
11.6 |
12.8 |
13.5 |
14.5 |
16.5 |
19.1 |
18.5 |
17.9 |
20.4 |
22.5 |
20.9 |
-7.1% |
0.7% |
|
Ukraine |
60.9 |
62.1 |
61.7 |
62.1 |
60.3 |
56.9 |
54.0 |
42.3 |
46.9 |
48.3 |
44.6 |
-7.8% |
1.5% |
|
United Kingdom |
85.6 |
85.8 |
87.7 |
85.5 |
81.1 |
81.9 |
89.4 |
82.1 |
89.3 |
74.5 |
70.5 |
-5.7% |
2.4% |
|
Uzbekistan |
45.8 |
41.2 |
39.1 |
38.4 |
37.7 |
41.3 |
43.8 |
39.2 |
41.0 |
44.2 |
43.1 |
-2.8% |
1.4% |
|
Other Europe & Eurasia |
13.3 |
13.4 |
14.8 |
15.0 |
15.6 |
16.0 |
15.3 |
12.6 |
13.6 |
14.2 |
14.5 |
1.9% |
0.5% |
|
Total Europe & Eurasia |
918.5 |
948.6 |
970.2 |
990.5 |
1008.2 |
1013.3 |
1022.7 |
944.5 |
1016.6 |
995.2 |
975.0 |
-2.3% |
32.6% |
|
Iran |
71.3 |
74.6 |
77.9 |
94.5 |
97.8 |
101.7 |
107.4 |
118.2 |
130.1 |
138.2 |
140.5 |
1.4% |
4.7% |
|
Israel |
† |
† |
1.1 |
1.5 |
2.1 |
2.5 |
3.7 |
4.1 |
4.8 |
4.5 |
2.3 |
-48.1% |
0.1% |
|
Kuwait |
8.5 |
9.9 |
10.7 |
11.0 |
11.3 |
10.9 |
11.5 |
11.1 |
13.1 |
15.3 |
15.5 |
0.9% |
0.5% |
|
Qatar |
10.0 |
11.0 |
13.5 |
16.8 |
17.6 |
17.4 |
17.4 |
18.0 |
17.9 |
19.7 |
23.5 |
18.9% |
0.8% |
|
Saudi Arabia |
51.0 |
54.1 |
59.1 |
64.1 |
66.2 |
67.0 |
72.4 |
70.6 |
78.9 |
83.0 |
92.5 |
11.1% |
3.1% |
|
United Arab Emirates |
32.8 |
34.1 |
36.2 |
37.8 |
39.0 |
44.3 |
53.5 |
53.2 |
54.7 |
56.2 |
56.6 |
0.4% |
1.9% |
|
Other Middle East |
22.2 |
22.5 |
23.9 |
25.5 |
28.3 |
29.1 |
32.9 |
35.0 |
39.6 |
38.3 |
39.6 |
3.1% |
1.3% |
|
Total Middle East |
195.8 |
206.1 |
222.4 |
251.3 |
262.3 |
272.9 |
298.8 |
310.2 |
339.1 |
355.3 |
370.6 |
4.0% |
12.4% |
|
Algeria |
18.2 |
19.3 |
19.8 |
20.9 |
21.4 |
21.9 |
22.8 |
24.5 |
23.7 |
25.1 |
27.8 |
10.8% |
0.9% |
|
Egypt |
23.9 |
26.7 |
28.5 |
28.4 |
32.9 |
34.5 |
36.8 |
38.3 |
40.6 |
44.7 |
47.3 |
5.7% |
1.6% |
|
South Africa |
0.9 |
0.9 |
1.9 |
2.8 |
3.1 |
3.1 |
3.4 |
3.0 |
3.5 |
3.5 |
3.4 |
-4.6% |
0.1% |
|
Other Africa |
19.6 |
20.4 |
22.8 |
24.9 |
23.1 |
26.3 |
27.8 |
24.3 |
29.2 |
29.3 |
32.0 |
8.8% |
1.1% |
|
Total Africa |
62.6 |
67.3 |
73.1 |
77.1 |
80.5 |
85.9 |
90.7 |
90.1 |
97.0 |
102.6 |
110.5 |
7.5% |
3.7% |
|
Australia |
20.2 |
20.2 |
20.5 |
19.9 |
22.0 |
23.9 |
23.0 |
22.7 |
23.1 |
23.0 |
22.9 |
-0.9% |
0.8% |
|
Bangladesh |
10.3 |
11.1 |
11.5 |
12.4 |
13.6 |
14.3 |
15.3 |
16.7 |
17.9 |
18.1 |
19.6 |
8.2% |
0.7% |
|
China |
26.3 |
30.5 |
35.7 |
42.1 |
50.5 |
63.5 |
73.2 |
80.6 |
96.2 |
117.5 |
129.5 |
9.9% |
4.3% |
|
China Hong Kong SAR |
2.6 |
1.7 |
2.4 |
2.4 |
2.6 |
2.5 |
2.9 |
2.8 |
3.4 |
2.7 |
2.5 |
-8.2% |
0.1% |
|
India |
24.8 |
26.6 |
28.7 |
32.1 |
33.5 |
36.1 |
37.2 |
45.9 |
55.7 |
55.0 |
49.1 |
-11.0% |
1.6% |
|
Indonesia |
29.6 |
31.5 |
29.0 |
29.9 |
29.9 |
28.2 |
30.0 |
33.6 |
36.3 |
33.5 |
32.2 |
-4.2% |
1.1% |
|
Japan |
65.4 |
71.8 |
69.3 |
70.7 |
75.4 |
81.2 |
84.4 |
78.7 |
85.1 |
95.0 |
105.1 |
10.3% |
3.5% |
|
Malaysia |
23.6 |
24.6 |
22.2 |
28.3 |
30.4 |
30.1 |
30.4 |
29.7 |
31.0 |
28.8 |
30.0 |
3.9% |
1.0% |
|
New Zealand |
5.1 |
3.9 |
3.5 |
3.2 |
3.3 |
3.6 |
3.4 |
3.6 |
3.9 |
3.5 |
3.8 |
8.8% |
0.1% |
|
Pakistan |
22.1 |
27.4 |
31.0 |
32.0 |
32.5 |
33.1 |
33.8 |
34.6 |
35.7 |
35.2 |
37.3 |
5.6% |
1.2% |
|
Philippines |
1.6 |
2.4 |
2.2 |
3.0 |
2.5 |
3.0 |
3.1 |
3.1 |
2.9 |
3.2 |
3.1 |
-4.3% |
0.1% |
|
Singapore |
3.2 |
3.6 |
4.5 |
6.2 |
6.3 |
7.8 |
7.4 |
7.3 |
7.6 |
7.9 |
7.5 |
-5.5% |
0.3% |
|
South Korea |
20.8 |
21.8 |
25.5 |
27.3 |
28.8 |
31.2 |
32.1 |
30.5 |
38.7 |
41.7 |
45.0 |
7.8% |
1.5% |
|
Taiwan |
6.7 |
6.9 |
8.4 |
8.5 |
9.1 |
9.6 |
10.5 |
10.2 |
12.7 |
14.0 |
14.7 |
4.7% |
0.5% |
|
Thailand |
24.2 |
25.7 |
26.9 |
29.3 |
30.0 |
31.8 |
33.6 |
35.3 |
40.6 |
41.9 |
46.1 |
9.6% |
1.5% |
|
Vietnam |
2.2 |
2.1 |
3.7 |
5.8 |
6.3 |
6.4 |
6.7 |
7.2 |
8.5 |
7.6 |
8.5 |
10.6% |
0.3% |
|
Other Asia Pacific |
3.3 |
3.8 |
4.1 |
4.7 |
4.9 |
5.4 |
5.1 |
4.6 |
5.1 |
5.6 |
5.6 |
1.1% |
0.2% |
|
Total Asia Pacific |
291.9 |
315.5 |
329.3 |
357.7 |
381.6 |
411.6 |
432.0 |
447.0 |
504.4 |
534.2 |
562.5 |
5.0% |
18.8% |
|
Total World |
2276.7 |
2343.1 |
2413.8 |
2499.5 |
2562.1 |
2647.3 |
2717.7 |
2655.7 |
2864.1 |
2914.2 |
2987.1 |
2.2% |
100.0% |
|
of which: OECD |
1241.1 |
1263.0 |
1281.7 |
1296.2 |
1297.0 |
1338.4 |
1362.2 |
1322.5 |
1406.0 |
1394.6 |
1433.6 |
2.5% |
48.0% |
|
Non-OECD |
1035.6 |
1080.1 |
1132.1 |
1203.3 |
1265.1 |
1308.9 |
1355.5 |
1333.2 |
1458.1 |
1519.6 |
1553.5 |
2.0% |
52.0% |
|
European Union |
406.5 |
426.5 |
438.0 |
446.5 |
440.7 |
433.9 |
447.6 |
418.6 |
452.6 |
407.7 |
399.5 |
-2.3% |
13.4% |
|
Former Soviet Union |
490.2 |
496.8 |
505.0 |
513.1 |
533.4 |
540.4 |
534.2 |
487.1 |
521.7 |
539.2 |
526.4 |
-2.6% |
17.6% |
†Less than 0.05. |
|
|
|
|
|
|
|
|
|
Source: Includes data from Cedigaz. |
||||
Less than 0.05%.
Notes: The difference between these world consumption figures and the world production statistics is due to variations in stocks at storage facilities and liquefaction plants, together with unavoidable disparities in the definition, measurement or conversion of gas supply and demand data.
Growth rates are adjusted for leap years.
25
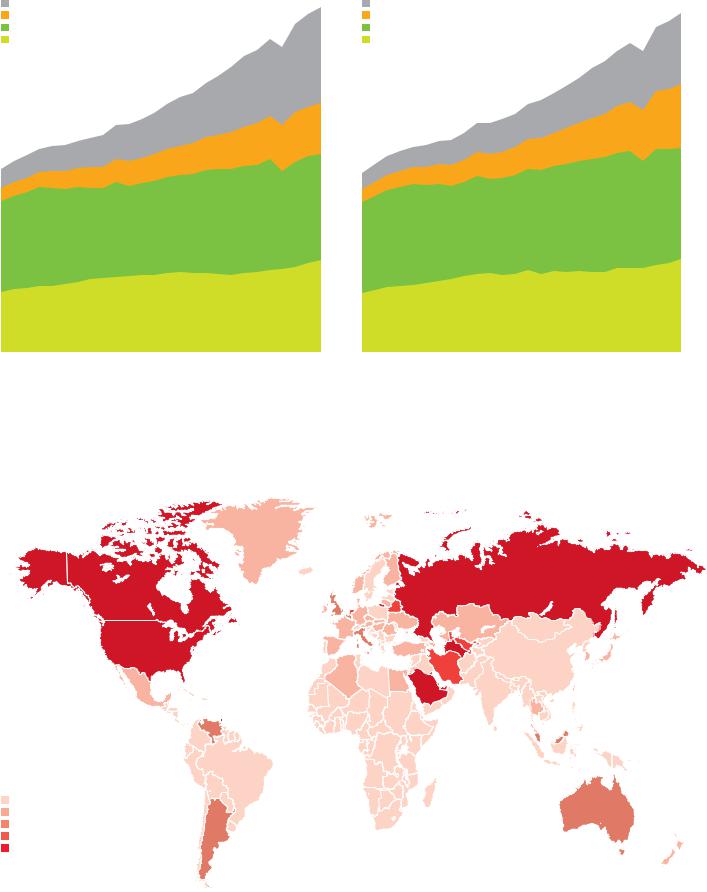
Production by region
Billion cubic metres
Rest of World |
3500 |
|
|
Asia Pacific |
|
Europe & Eurasia |
|
North America |
|
|
3000 |
|
|
|
2500 |
|
|
|
2000 |
|
|
|
1500 |
|
|
|
1000 |
|
|
|
500 |
Consumption by region
Billion cubic metres
Rest of World |
3500 |
|
|
Asia Pacific |
|
Europe & Eurasia |
|
North America |
|
|
3000 |
|
|
|
2500 |
|
|
|
2000 |
|
|
|
1500 |
|
|
|
1000 |
|
|
|
500 |
87 |
92 |
97 |
02 |
07 |
12 |
0 |
|
87 |
92 |
97 |
02 |
07 |
12 |
0 |
World natural gas production increased by 1.9% in 2012. The US once again recorded the largest national increase. Production grew in every region except Europe & Eurasia, where declines in Russia and the UK offset a gain in Norway. Natural gas consumption increased by a below-average 2.2%. As was the case with production, the US recorded the largest national increase and consumption rose in every region except Europe & Eurasia; EU consumption fell to the lowest level since 2000.
Consumption per capita 2012
Tonnes oil equivalent
0-0.5
0.5-1.0
1.0-1.5
1.5-2.0 > 2.0
Source: Includes data from Cedigaz.
26