


2012 in review
Darling Harbour, Sydney, Australia (above right).
+1.8%
Growth in global primary energy consumption.
2
On the back of slower economic growth, global energy consumption growth in 2012 slowed significantly.
Once again, all of the net growth took place in emerging economies, with China and India alone accounting for nearly 90% of the net increase in global energy consumption. OECD consumption declined for the fourth time in the past five years, led by a large decline in the US. Despite the slowdown, consumption and production reached record levels for all fuels except nuclear power and biofuels. The data suggests that growth in global CO2 emissions from energy use continued in 2012, but at a slower rate than in 2011.
Energy price developments were mixed. Brent, the international crude oil benchmark, saw annual average prices reach record levels (in money-of-the-day terms), although annual prices declined slightly on an inflation-adjusted basis. Crude oil prices peaked in March following a decline in Iranian exports, but eased thereafter in the face of rising output in the US, Libya, and other OPEC producers. Oil production growth in the US was the largest in the world in 2012, and the largest in the country’s history. In response, the differential between Brent and West Texas Intermediate (WTI) reached another record premium, although the gap began to narrow later in the year as infrastructure bottlenecks in the US eased.
Natural gas prices rose in Europe and Asia, but fell in North America, where rising US natural gas output pushed gas prices to record discounts against both crude oil and international gas prices. Coal prices declined in all regions.
Energy developments
World primary energy consumption grew by 1.8% in 2012, well below the 10-year average of 2.6%. Consumption in OECD countries fell by 1.2%, led by a decline of 2.8% in the US (the world’s largest decline in volumetric terms). Non-OECD consumption grew by 4.2%, below the 10-year average
of 5.3%. Global consumption growth was below average for each fossil fuel and for nuclear power; regionally growth was below average everywhere except Africa. Oil remains the world’s leading fuel, at 33.1% of global energy consumption, but it also continued to lose market share for the 13th consecutive year and its current market share is the lowest in our data set, which begins in 1965.
-1.3%
Decline in OECD oil consumption, the sixth decrease in the past seven years.
+1million b/d
Growth of US oil production, the largest in the world.
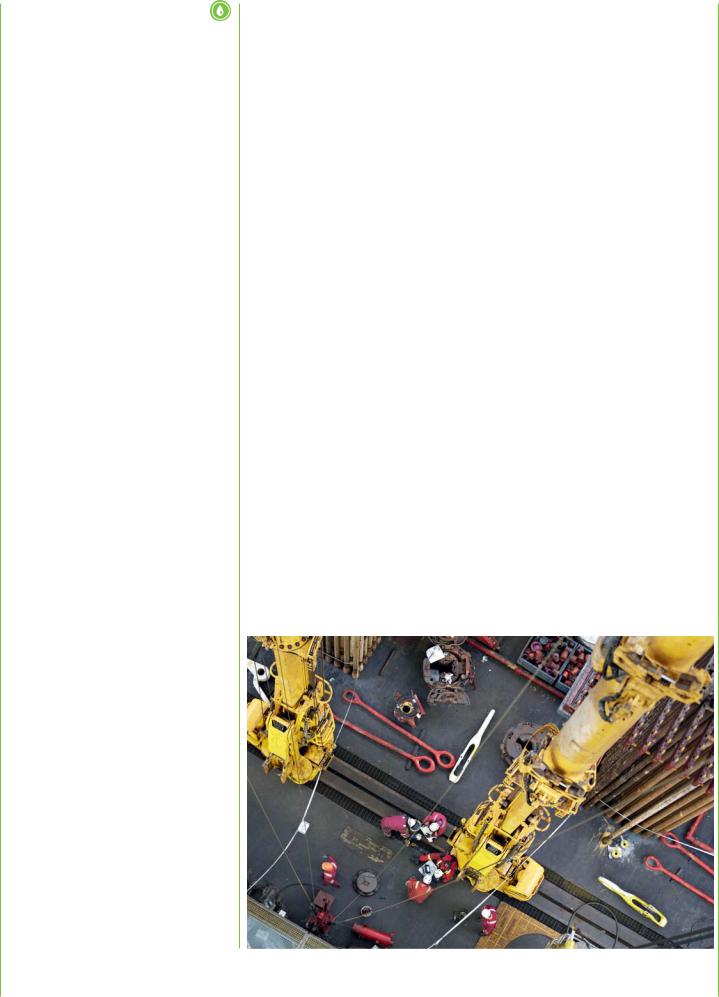
Discoverer Luanda drill ship, Angola (right).
Oil
Dated Brent averaged $111.67 per barrel in 2012, an increase of $0.40 per barrel from the 2011 level. The loss of Iranian supplies was more than offset by growth in the US, the recovery in Libyan production, and increases in Saudi Arabia and elsewhere in OPEC.
Global oil consumption grew by 890,000 barrels per day (b/d), or 0.9%, below the historical average. Oil had the weakest global growth rate among fossil fuels for the third consecutive year. OECD consumption declined by 1.3% (530,000 b/d), the sixth decrease in the past seven years; the OECD now accounts for just 50.2% of global consumption, the smallest share on record. Outside
the OECD, consumption grew by 1.4 million b/d, or 3.3%. China again recorded the largest increment to global consumption (+470,000 b/d, +5%) although the growth rate was below the 10-year average. Japanese consumption grew by 250,000 b/d (+6.3%), the strongest growth increment since 1994.
Light distillates were the fastest-growing refined product category by volume for the first time since 2009.
Global oil production, in contrast, increased by 1.9 million b/d, or 2.2%. OPEC accounted for about three-quarters of the global increase despite a decline in Iranian output (-680,000 b/d) due to international sanctions. Libyan output (+1 million b/d) nearly regained all of the ground lost in 2011. For a second consecutive year, output reached record levels in Saudi Arabia, the UAE and Qatar. Iraq and Kuwait also registered significant increases. Non-OPEC output grew by 490,000 b/d, with increases in the US (+1 million b/d), Canada, Russia and China offsetting unexpected outages in Sudan/South Sudan (-340,000 b/d) and Syria (-160,000 b/d), as well as declines in mature provinces such as the United Kingdom and Norway.
Global refinery crude runs increased by a below-average 480,000 b/d, or 0.6%. Non-OECD countries accounted for two-thirds of the net increase, rising by 320,000 b/d. OECD throughputs grew by 160,000 b/d, with continued throughput declines in Europe more than offset by throughput increases in North America, where the US consolidated its position as a net product exporter. Global refinery capacity utilization improved to 82.4%; global refining capacity increased by a modest 360,000 b/d overall, but large capacity additions East of Suez were largely offset by substantial capacity reductions in and around the Atlantic Basin.
Global oil trade in 2012 grew by 1.3%, or 0.7 million b/d. At 55.3 million b/d, trade accounted for 62% of global consumption, up from 57% a decade ago. The relatively small global increase hides large regional changes. US net imports fell by 930,000 b/d and are now 36% below their 2005 peak. Conversely, China’s net oil imports grew by 610,000 b/d, 86% of the global increase. Growth in net exports from Canada and North Africa, together with reduced US oil import dependence, offset declining exports from several regions.
3
-0.9%
The first decline on record for global LNG trade.
23.9%
Natural gas’s share of global primary energy consumption.
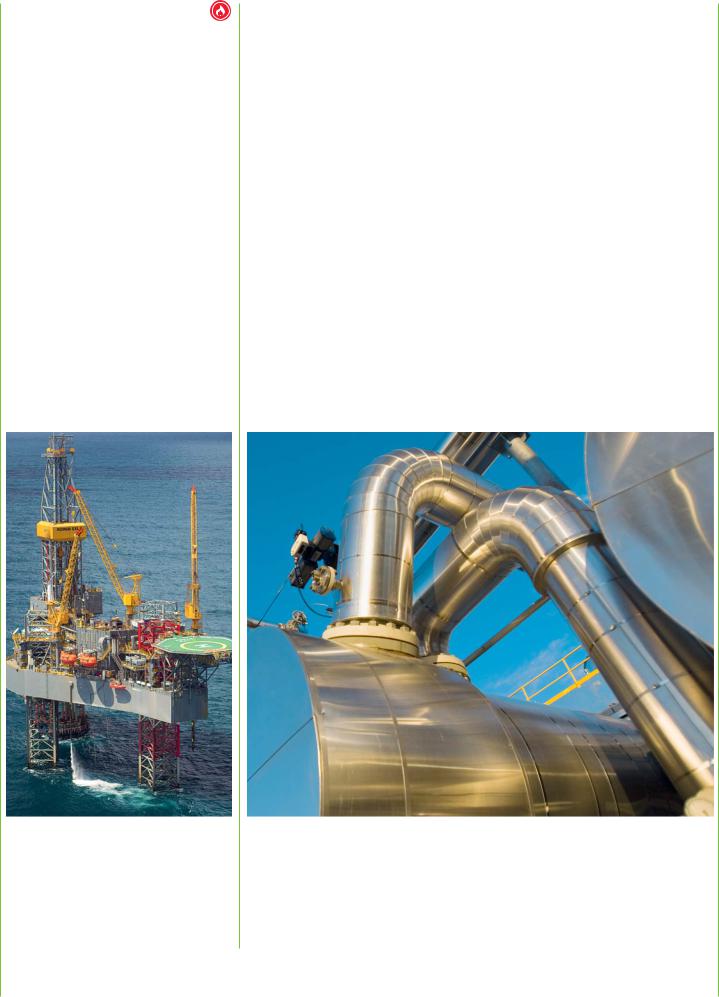
Rowan EXL II drill rig, offshore Trinidad (above).
4
Natural gas
World natural gas consumption grew by 2.2%, below the historical average of 2.7%. Consumption growth was above average in South & Central America, Africa, and North America, where the US (+4.1%) recorded the largest increment in the world. In Asia, China (+9.9%) and Japan (+10.3%) were responsible for the next-largest growth increments. These increases were partly offset by declines
in the EU (-2.3%) and the Former Soviet Union (FSU) (-2.6%). Globally, natural gas accounted for 23.9% of primary energy consumption. OECD consumption grew more rapidly than non-OECD consumption for the first time since 2000.
Global natural gas production grew by 1.9%. The US (+4.7%) once again recorded the largest volumetric increase and remained the world’s largest producer. Norway (+12.6%), Qatar (+7.8%), and Saudi Arabia (+11.1%) also saw significant production increases, while Russia (-2.7%) had the world’s largest decline in volumetric terms.
Global natural gas trade was very weak, growing by just 0.1% in 2012. Pipeline shipments grew by 0.5%, with declines in net Russian exports (-12%) partly offset by growth in Norwegian exports (+12%). US net pipeline imports dropped by 18.8%. Global LNG trade fell for the first time on record (-0.9%):
a decline in net European LNG imports (-28.2%) was offset by net increases in Asia (+22.8%). Among exporters, an increase in Qatari (+4.7%) shipments was nearly offset by a decline in Indonesia (-14.7%). LNG’s share of global gas trade declined slightly to 31.7%.

50.2%
China’s share of global coal consumption.
-89%
Decline in Japanese nuclear output.
4.7%
Share of global power generation met by renewables.
In detail
Additional information is available at bp.com/statisticalreview
Other fuels
Coal consumption grew by 2.5% in 2012, well below the 10-year average of 4.4% but still the fastest-growing fossil fuel. Consumption outside the OECD rose by a below-average 5.4%; Chinese consumption growth was a below-average 6.1%, but China still accounted for all of the net growth in global coal consumption, and China accounted for more than half of global coal consumption for the first time. OECD consumption declined by 4.2% with losses in the US (-11.9%) offsetting increases in Europe and Japan. Global coal production grew by 2%, with growth in China (+3.5%) and Indonesia (+9%) offsetting a decline in the US (-7.5%). Coal reached the highest share of global primary energy consumption (29.9%) since 1970.
Global nuclear output fell by 6.9%, the largest decline on record for a second consecutive year; Japanese output fell by 89%, accounting for 82% of the global decline. Nuclear output accounted for 4.5% of global energy consumption, the smallest share since 1984. Global hydroelectric output grew by an above-average 4.3%, with China accounting for all of the net increase. Hydroelectric output reached 6.7% of global energy consumption, the highest share on record.
Renewable energy sources saw mixed results in 2012. Global biofuels production recorded the first decline since 2000 (-0.4%, or -0.1 mtoe), due to a decline in the US (-4.3% or -1.2 mtoe). In contrast, renewable energy used in power generation grew by 15.2%, slower year-on-year growth for the first time since 2008 but still slightly above the historical average. Wind energy (+18.1%), accounted for more than half of renewable power generation growth, with China (+34.6%) accounting for the largest increment in wind generation. Solar power generation grew even more rapidly (+58%), but from a smaller base. Renewable forms of energy accounted for 2.4% of global energy consumption, up from 0.8% in 2002; renewables in power generation accounted for a record 4.7% of global power generation.
Additional information – including historical time series for the fuels reported in this review; further detail on renewable forms of energy; electricity generation; and CO2 emissions from energy use – is available at bp.com/statisticalreview.
Acknowledgements
We would like to express our sincere gratitude to the many contacts worldwide who provide the publicly available data for this publication, and to the researchers at the Heriot-Watt University Energy Academy who assist in the data compilation.
5

 Oil
Oil
Proved reserves
|
At end 1992 |
At end 2002 |
At end 2011 |
|
|
|
|
At end 2012 |
|
|
|
|
|
Thousand |
Thousand |
Thousand |
|
|
Thousand |
Thousand |
|
|
|
|
|
|
million |
million |
million |
|
|
million |
million |
|
Share |
R/P |
||
|
barrels |
barrels |
barrels |
|
|
tonnes |
barrels |
of total |
ratio |
|||
US |
31.2 |
30.7 |
35.0 |
4.2 |
35.0 |
2.1% |
10.7 |
|||||
Canada |
39.6 |
180.4 |
174.6 |
28.0 |
173.9 |
10.4% |
* |
|||||
Mexico |
51.2 |
17.2 |
11.4 |
1.6 |
11.4 |
0.7% |
10.7 |
|||||
Total North America |
122.1 |
228.3 |
221.0 |
33.8 |
220.2 |
13.2% |
38.7 |
|||||
Argentina |
2.0 |
2.8 |
2.5 |
0.3 |
2.5 |
0.1% |
10.2 |
|||||
Brazil |
5.0 |
9.8 |
15.0 |
2.2 |
15.3 |
0.9% |
19.5 |
|||||
Colombia |
3.2 |
1.6 |
2.0 |
0.3 |
2.2 |
0.1% |
6.4 |
|||||
Ecuador |
3.2 |
5.1 |
7.2 |
1.2 |
8.2 |
0.5% |
44.6 |
|||||
Peru |
0.8 |
1.0 |
1.2 |
0.2 |
1.2 |
0.1% |
31.5 |
|||||
Trinidad & Tobago |
0.5 |
1.1 |
0.8 |
0.1 |
0.8 |
|
|
18.8 |
||||
|
|
|||||||||||
Venezuela |
63.3 |
77.3 |
297.6 |
46.5 |
297.6 |
17.8% |
* |
|||||
Other S. & Cent. America |
0.6 |
1.6 |
0.5 |
0.1 |
0.5 |
|
|
9.7 |
||||
|
|
|||||||||||
Total S. & Cent. America |
78.8 |
100.3 |
326.9 |
50.9 |
328.4 |
19.7% |
* |
|||||
Azerbaijan |
n/a |
7.0 |
7.0 |
1.0 |
7.0 |
0.4% |
21.9 |
|||||
Denmark |
0.7 |
1.3 |
0.8 |
0.1 |
0.7 |
|
|
9.7 |
||||
|
|
|||||||||||
Italy |
0.6 |
0.8 |
1.4 |
0.2 |
1.4 |
0.1% |
33.7 |
|||||
Kazakhstan |
n/a |
5.4 |
30.0 |
3.9 |
30.0 |
1.8% |
47.4 |
|||||
Norway |
9.7 |
10.4 |
6.9 |
0.9 |
7.5 |
0.4% |
10.7 |
|||||
Romania |
1.2 |
0.5 |
0.6 |
0.1 |
0.6 |
|
|
19.1 |
||||
|
|
|||||||||||
Russian Federation |
n/a |
76.1 |
87.1 |
11.9 |
87.2 |
5.2% |
22.4 |
|||||
Turkmenistan |
n/a |
0.5 |
0.6 |
0.1 |
0.6 |
|
|
7.4 |
||||
|
|
|||||||||||
United Kingdom |
4.6 |
4.5 |
3.1 |
0.4 |
3.1 |
0.2% |
8.8 |
|||||
Uzbekistan |
n/a |
0.6 |
0.6 |
0.1 |
0.6 |
|
|
24.0 |
||||
|
|
|||||||||||
Other Europe & Eurasia |
61.3 |
2.2 |
2.2 |
0.3 |
2.1 |
0.1% |
14.8 |
|||||
Total Europe & Eurasia |
78.3 |
109.3 |
140.3 |
19.0 |
140.8 |
8.4% |
22.4 |
|||||
Iran |
92.9 |
130.7 |
154.6 |
21.6 |
157.0 |
9.4% |
* |
|||||
Iraq |
100.0 |
115.0 |
143.1 |
20.2 |
150.0 |
9.0% |
* |
|||||
Kuwait |
96.5 |
96.5 |
101.5 |
14.0 |
101.5 |
6.1% |
88.7 |
|||||
Oman |
4.7 |
5.7 |
5.5 |
0.7 |
5.5 |
0.3% |
16.3 |
|||||
Qatar |
3.1 |
27.6 |
23.9 |
2.5 |
23.9 |
1.4% |
33.2 |
|||||
Saudi Arabia |
261.2 |
262.8 |
265.4 |
36.5 |
265.9 |
15.9% |
63.0 |
|||||
Syria |
3.0 |
2.3 |
2.5 |
0.3 |
2.5 |
0.1% |
41.7 |
|||||
United Arab Emirates |
98.1 |
97.8 |
97.8 |
13.0 |
97.8 |
5.9% |
79.1 |
|||||
Yemen |
2.0 |
2.9 |
3.0 |
0.4 |
3.0 |
0.2% |
45.4 |
|||||
Other Middle East |
0.1 |
0.1 |
0.7 |
0.1 |
0.6 |
|
|
8.4 |
||||
|
|
|||||||||||
Total Middle East |
661.6 |
741.3 |
797.9 |
109.3 |
807.7 |
48.4% |
78.1 |
|||||
Algeria |
9.2 |
11.3 |
12.2 |
1.5 |
12.2 |
0.7% |
20.0 |
|||||
Angola |
1.3 |
8.9 |
10.5 |
1.7 |
12.7 |
0.8% |
19.4 |
|||||
Chad |
– |
0.9 |
1.5 |
0.2 |
1.5 |
0.1% |
40.7 |
|||||
Republic of Congo (Brazzaville) |
0.7 |
1.5 |
1.6 |
0.2 |
1.6 |
0.1% |
14.8 |
|||||
Egypt |
3.4 |
3.5 |
4.3 |
0.6 |
4.3 |
0.3% |
16.1 |
|||||
Equatorial Guinea |
0.3 |
1.1 |
1.7 |
0.2 |
1.7 |
0.1% |
16.5 |
|||||
Gabon |
0.8 |
2.4 |
2.0 |
0.3 |
2.0 |
0.1% |
22.3 |
|||||
Libya |
22.8 |
36.0 |
48.0 |
6.3 |
48.0 |
2.9% |
86.9 |
|||||
Nigeria |
21.0 |
34.3 |
37.2 |
5.0 |
37.2 |
2.2% |
42.1 |
|||||
South Sudan |
– |
– |
– |
0.5 |
3.5 |
0.2% |
* |
|||||
Sudan |
0.3 |
0.6 |
5.0 |
0.2 |
1.5 |
0.1% |
50.0 |
|||||
Tunisia |
0.5 |
0.5 |
0.4 |
0.1 |
0.4 |
|
|
17.9 |
||||
|
|
|||||||||||
Other Africa |
0.8 |
0.6 |
2.2 |
0.5 |
3.7 |
0.2% |
43.0 |
|||||
Total Africa |
61.1 |
101.6 |
126.6 |
17.3 |
130.3 |
7.8% |
37.7 |
|||||
Australia |
3.2 |
4.6 |
3.9 |
0.4 |
3.9 |
0.2% |
23.4 |
|||||
Brunei |
1.1 |
1.1 |
1.1 |
0.1 |
1.1 |
0.1% |
19.0 |
|||||
China |
15.2 |
15.5 |
17.3 |
2.4 |
17.3 |
1.0% |
11.4 |
|||||
India |
5.9 |
5.6 |
5.7 |
0.8 |
5.7 |
0.3% |
17.5 |
|||||
Indonesia |
5.6 |
4.7 |
3.7 |
0.5 |
3.7 |
0.2% |
11.1 |
|||||
Malaysia |
5.1 |
4.5 |
3.7 |
0.5 |
3.7 |
0.2% |
15.6 |
|||||
Thailand |
0.2 |
0.7 |
0.4 |
0.1 |
0.4 |
|
|
2.7 |
||||
|
|
|||||||||||
Vietnam |
0.3 |
2.8 |
4.4 |
0.6 |
4.4 |
0.3% |
34.5 |
|||||
Other Asia Pacific |
0.9 |
1.1 |
1.1 |
0.1 |
1.1 |
0.1% |
10.5 |
|||||
Total Asia Pacific |
37.5 |
40.6 |
41.4 |
5.5 |
41.5 |
2.5% |
13.6 |
|||||
Total World |
1039.3 |
1321.5 |
1654.1 |
235.8 |
1668.9 |
100.0% |
52.9 |
|||||
of which: OECD |
142.7 |
251.2 |
238.5 |
36.0 |
238.3 |
14.3% |
33.4 |
|||||
Non-OECD |
896.6 |
1070.3 |
1415.6 |
199.7 |
1430.7 |
85.7% |
58.6 |
|||||
OPEC |
772.7 |
903.3 |
1199.0 |
169.9 |
1211.9 |
72.6% |
88.5 |
|||||
Non-OPEC‡ |
207.1 |
327.9 |
329.4 |
48.8 |
331.0 |
19.8% |
25.8 |
|||||
European Union# |
8.3 |
8.0 |
6.9 |
0.9 |
6.8 |
0.4% |
12.1 |
|||||
Former Soviet Union |
59.6 |
90.3 |
125.8 |
17.1 |
126.0 |
7.5% |
25.2 |
|||||
Canadian oil sands: Total |
32.4 |
174.4 |
168.6 |
27.3 |
167.8 |
|
|
|
|
|||
of which: Under active development |
3.0 |
11.6 |
25.5 |
4.2 |
25.9 |
|
|
|
|
|||
Venezuela: Orinoco Belt |
– |
– |
220.0 |
35.3 |
220.0 |
|
|
|
|
|||
*More than 100 years.Less than 0.05%.
‡Excludes Former Soviet Union.
#Excludes Estonia, Latvia and Lithuania in 1992.
Notes: Proved reserves of oil – Generally taken to be those quantities that geological and engineering information indicates with reasonable certainty can be recovered in the future from
known reservoirs under existing economic and operating conditions.
Reserves-to-production (R/P) ratio – If the reserves remaining at the end of any year are divided by the production in that year, the result is the length of time that those remaining reserves
would last if production were to continue at that rate.
Source of data – The estimates in this table have been compiled using a combination of primary official sources, third-party data from the OPEC Secretariat, World Oil, Oil & Gas Journal and an independent estimate of Russian and Chinese reserves based on information in the public domain.
Canadian oil sands ‘under active development’ are an official estimate. Venezuelan Orinoco Belt reserves are based on the OPEC Secretariat and government announcements.
Reserves include gas condensate and natural gas liquids (NGLs) as well as crude oil. Shares of total and R/P ratios are calculated using thousand million barrels figures.
6
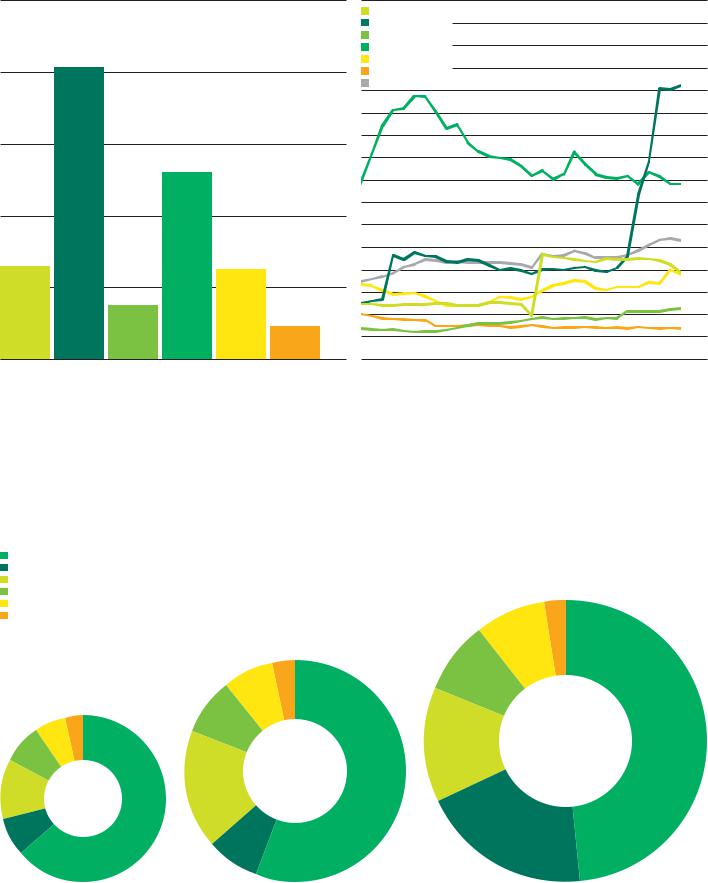
Reserves-to-production (R/P) ratios
Years
2012 by region |
History |
|
|
|
|
|
|
150 |
|
North America |
|
|
|
|
|
160 |
|
|
|
|
|
|
|
|
|
|
|
|
|
|
|
|
|
|
|
|
|
|
|
S. & Cent. America |
|
|
|
|
|
150 |
|
|
|
|
|
|
|
|
Europe & Eurasia |
|
|
|
|
|
|
|
|
|
|
|
|
|
|
|
|
|
|
|
|
|
|
|
|
|
|
|
|
|
Middle East |
|
|
|
|
|
140 |
|
|
|
|
|
|
|
|
Africa |
|
|
|
|
|
|
|
|
|
|
|
|
|
|
|
|
|
|
|
|
|
|
|
|
|
|
|
120 |
|
Asia Pacific |
|
|
|
|
|
130 |
|
|
|
|
|
|
|
World |
|
|
|
|
|
||
|
|
|
|
|
|
|
|
|
|
|
|
|
||
|
|
|
|
|
|
|
|
|
|
|
|
|
|
|
|
|
|
|
|
|
|
|
|
|
|
|
|
|
120 |
|
|
|
|
|
|
|
|
|
|
|
|
|
|
110 |
|
|
|
|
|
|
90 |
|
|
|
|
|
|
|
100 |
|
|
|
|
|
|
|
|
|
|
|
|
|
|
|
|
|
|
|
|
|
|
|
|
|
|
|
|
|
90 |
|
|
|
|
|
|
|
|
|
|
|
|
|
|
80 |
|
|
|
|
|
|
|
|
|
|
|
|
|
|
70 |
|
|
|
|
|
|
60 |
|
|
|
|
|
|
|
60 |
|
|
|
|
|
|
|
|
|
|
|
|
|
|
|
|
|
|
|
|
|
|
|
|
|
|
|
|
|
50 |
|
|
|
|
|
|
|
|
|
|
|
|
|
|
40 |
|
|
|
|
|
|
30 |
|
|
|
|
|
|
|
30 |
|
|
|
|
|
|
|
|
|
|
|
|
|
|
|
|
|
|
|
|
|
|
|
|
|
|
|
|
|
20 |
|
|
|
|
|
|
|
|
|
|
|
|
|
|
10 |
North |
S. & Cent. |
Europe & |
Middle |
Africa |
Asia |
0 |
82 |
87 |
92 |
97 |
02 |
07 |
12 |
0 |
America |
America |
Eurasia |
East |
|
Pacific |
|
|
|
|
|
|
|
|
|
World proved oil reserves at the end of 2012 reached 1668.9 billion barrels, sufficient to meet 52.9 years of global production. An increase in official Iraqi reserves was the single largest addition, adding 6.9 billion barrels. OPEC members continue to dominate, holding 72.6% of the global total. South & Central America continues to hold the highest R/P ratio. Global proved reserves have increased by 26%, or nearly 350 billion barrels, over the past decade.
Distribution of proved reserves in 1992, 2002 and 2012
Percentage
Middle East
S. & Cent. America
North America
Europe & Eurasia
Africa
2.5 48.4
Asia Pacific
7.8
3.156.1
|
|
7.7 |
8.4 |
|
|
|
|
3.6 |
63.7 |
8.3 |
2012 |
5.9 |
|
Total 1668.9 |
|
|
|
||
|
|
|
|
|
|
|
thousand million |
7.5 |
|
2002 |
barrels |
|
|
Total 1321.5 |
|
1992 |
thousand million |
13.2 |
|
barrels |
|||
Total 1039.3 |
|
|
|
11.7 |
thousand million |
|
barrels |
||
|
||
|
17.3 |
|
7.6 |
|
|
|
7.6 |
|
|
19.7 |
7

Production*
|
|
|
|
|
|
|
|
|
|
|
|
Change |
2012 |
|
|
|
|
|
|
|
|
|
|
|
|
2012 over |
share |
Thousand barrels daily |
2002 |
2003 |
2004 |
2005 |
2006 |
2007 |
2008 |
2009 |
2010 |
2011 |
2012 |
2011 |
of total |
US |
7626 |
7362 |
7244 |
6903 |
6828 |
6862 |
6783 |
7263 |
7552 |
7868 |
8905 |
13.9% |
9.6% |
Canada |
2858 |
3003 |
3080 |
3041 |
3208 |
3290 |
3207 |
3202 |
3332 |
3526 |
3741 |
6.8% |
4.4% |
Mexico |
3593 |
3795 |
3830 |
3766 |
3689 |
3479 |
3165 |
2978 |
2959 |
2940 |
2911 |
-0.7% |
3.5% |
Total North America |
14077 |
14160 |
14154 |
13709 |
13725 |
13631 |
13156 |
13444 |
13843 |
14335 |
15557 |
8.9% |
17.5% |
Argentina |
899 |
900 |
868 |
839 |
838 |
813 |
772 |
743 |
722 |
687 |
664 |
-3.8% |
0.8% |
Brazil |
1497 |
1548 |
1537 |
1699 |
1804 |
1833 |
1895 |
2024 |
2137 |
2193 |
2149 |
-2.0% |
2.7% |
Colombia |
578 |
541 |
528 |
526 |
529 |
531 |
588 |
671 |
786 |
915 |
944 |
3.2% |
1.2% |
Ecuador |
394 |
420 |
528 |
534 |
538 |
513 |
507 |
488 |
488 |
501 |
505 |
0.8% |
0.7% |
Peru |
95 |
89 |
86 |
92 |
97 |
96 |
99 |
107 |
113 |
110 |
107 |
-3.0% |
0.1% |
Trinidad & Tobago |
161 |
175 |
165 |
181 |
193 |
166 |
174 |
153 |
148 |
140 |
121 |
-13.7% |
0.1% |
Venezuela |
2974 |
2868 |
3305 |
3308 |
3336 |
3230 |
3222 |
3033 |
2838 |
2766 |
2725 |
-1.5% |
3.4% |
Other S. & Cent. America |
149 |
149 |
144 |
146 |
140 |
142 |
138 |
134 |
134 |
137 |
145 |
4.5% |
0.2% |
Total S. & Cent. America |
6747 |
6691 |
7161 |
7325 |
7474 |
7324 |
7395 |
7353 |
7367 |
7449 |
7359 |
-1.2% |
9.2% |
Azerbaijan |
307 |
308 |
309 |
445 |
646 |
856 |
895 |
1014 |
1023 |
919 |
872 |
-5.2% |
1.1% |
Denmark |
371 |
368 |
390 |
377 |
342 |
311 |
287 |
265 |
249 |
225 |
207 |
-8.0% |
0.2% |
Italy |
115 |
116 |
113 |
127 |
120 |
122 |
108 |
95 |
106 |
110 |
112 |
1.4% |
0.1% |
Kazakhstan |
1021 |
1111 |
1283 |
1330 |
1403 |
1453 |
1526 |
1664 |
1740 |
1758 |
1728 |
-1.6% |
2.0% |
Norway |
3333 |
3264 |
3180 |
2961 |
2772 |
2551 |
2466 |
2351 |
2137 |
2040 |
1916 |
-7.0% |
2.1% |
Romania |
128 |
124 |
120 |
114 |
105 |
100 |
99 |
94 |
90 |
89 |
86 |
-2.8% |
0.1% |
Russian Federation |
7755 |
8602 |
9335 |
9598 |
9818 |
10044 |
9950 |
10139 |
10365 |
10510 |
10643 |
1.2% |
12.8% |
Turkmenistan |
183 |
203 |
194 |
193 |
187 |
199 |
208 |
211 |
217 |
217 |
222 |
2.5% |
0.3% |
United Kingdom |
2495 |
2288 |
2056 |
1838 |
1662 |
1663 |
1568 |
1480 |
1357 |
1114 |
967 |
-13.4% |
1.1% |
Uzbekistan |
153 |
151 |
138 |
115 |
114 |
104 |
102 |
95 |
78 |
77 |
68 |
-12.0% |
0.1% |
Other Europe & Eurasia |
487 |
495 |
482 |
454 |
445 |
442 |
420 |
409 |
394 |
394 |
390 |
-0.7% |
0.5% |
Total Europe & Eurasia |
16346 |
17029 |
17600 |
17551 |
17615 |
17843 |
17630 |
17817 |
17755 |
17451 |
17211 |
-1.4% |
20.3% |
Iran |
3580 |
4002 |
4201 |
4184 |
4260 |
4303 |
4396 |
4249 |
4356 |
4358 |
3680 |
-16.2% |
4.2% |
Iraq |
2116 |
1344 |
2030 |
1833 |
1999 |
2143 |
2428 |
2452 |
2490 |
2801 |
3115 |
11.2% |
3.7% |
Kuwait |
2032 |
2370 |
2523 |
2668 |
2737 |
2663 |
2786 |
2511 |
2536 |
2880 |
3127 |
8.9% |
3.7% |
Oman |
900 |
822 |
783 |
777 |
740 |
713 |
759 |
815 |
867 |
891 |
922 |
3.5% |
1.1% |
Qatar |
803 |
949 |
1082 |
1149 |
1241 |
1279 |
1449 |
1416 |
1676 |
1836 |
1966 |
6.3% |
2.0% |
Saudi Arabia |
8907 |
10141 |
10458 |
10931 |
10671 |
10268 |
10663 |
9663 |
10075 |
11144 |
11530 |
3.7% |
13.3% |
Syria |
677 |
652 |
487 |
448 |
421 |
404 |
406 |
401 |
385 |
327 |
164 |
-49.9% |
0.2% |
United Arab Emirates |
2439 |
2722 |
2836 |
2922 |
3099 |
3001 |
3026 |
2723 |
2895 |
3319 |
3380 |
1.6% |
3.7% |
Yemen |
457 |
451 |
424 |
421 |
387 |
341 |
315 |
306 |
291 |
228 |
180 |
-21.4% |
0.2% |
Other Middle East |
48 |
48 |
48 |
185 |
182 |
190 |
188 |
192 |
192 |
203 |
206 |
1.3% |
0.2% |
Total Middle East |
21960 |
23501 |
24873 |
25518 |
25736 |
25304 |
26415 |
24728 |
25763 |
27988 |
28270 |
0.9% |
32.5% |
Algeria |
1653 |
1826 |
1921 |
1990 |
1979 |
1992 |
1969 |
1774 |
1698 |
1684 |
1667 |
-0.9% |
1.8% |
Angola |
905 |
870 |
1103 |
1404 |
1421 |
1684 |
1901 |
1804 |
1863 |
1726 |
1784 |
3.4% |
2.1% |
Chad |
– |
24 |
168 |
173 |
153 |
144 |
127 |
118 |
122 |
114 |
101 |
-11.3% |
0.1% |
Republic of Congo (Brazzaville) |
227 |
208 |
217 |
239 |
271 |
221 |
235 |
269 |
294 |
293 |
296 |
0.8% |
0.4% |
Egypt |
751 |
750 |
701 |
672 |
704 |
698 |
715 |
730 |
725 |
727 |
728 |
0.1% |
0.9% |
Equatorial Guinea |
230 |
266 |
351 |
358 |
342 |
350 |
347 |
307 |
274 |
252 |
283 |
13.4% |
0.3% |
Gabon |
256 |
274 |
273 |
270 |
242 |
246 |
240 |
241 |
255 |
254 |
245 |
-3.5% |
0.3% |
Libya |
1375 |
1485 |
1623 |
1745 |
1816 |
1820 |
1820 |
1652 |
1659 |
479 |
1509 |
215.1% |
1.7% |
Nigeria |
2087 |
2233 |
2430 |
2502 |
2392 |
2265 |
2113 |
2211 |
2523 |
2460 |
2417 |
-1.9% |
2.8% |
South Sudan |
– |
– |
– |
– |
– |
– |
– |
– |
– |
– |
31 |
– |
|
Sudan |
241 |
265 |
301 |
305 |
331 |
468 |
480 |
475 |
465 |
453 |
82 |
-81.9% |
0.1% |
Tunisia |
74 |
68 |
71 |
73 |
70 |
97 |
89 |
83 |
80 |
68 |
65 |
-4.7% |
0.1% |
Other Africa |
136 |
141 |
165 |
172 |
224 |
193 |
190 |
183 |
167 |
232 |
234 |
1.0% |
0.3% |
Total Africa |
7937 |
8408 |
9322 |
9902 |
9945 |
10179 |
10226 |
9848 |
10123 |
8742 |
9442 |
7.7% |
10.9% |
Australia |
737 |
624 |
542 |
553 |
534 |
551 |
556 |
559 |
576 |
496 |
458 |
-8.6% |
0.5% |
Brunei |
210 |
214 |
210 |
206 |
221 |
194 |
175 |
168 |
172 |
165 |
158 |
-4.3% |
0.2% |
China |
3351 |
3406 |
3486 |
3642 |
3711 |
3742 |
3814 |
3805 |
4077 |
4074 |
4155 |
2.0% |
5.0% |
India |
800 |
802 |
816 |
785 |
809 |
809 |
809 |
796 |
873 |
903 |
894 |
-0.9% |
1.0% |
Indonesia |
1289 |
1176 |
1130 |
1096 |
1018 |
972 |
1006 |
994 |
1003 |
952 |
918 |
-3.9% |
1.1% |
Malaysia |
740 |
760 |
776 |
757 |
713 |
742 |
741 |
701 |
703 |
640 |
657 |
2.6% |
0.7% |
Thailand |
210 |
244 |
241 |
297 |
325 |
341 |
362 |
376 |
388 |
397 |
440 |
9.1% |
0.4% |
Vietnam |
356 |
361 |
424 |
389 |
355 |
334 |
311 |
342 |
312 |
317 |
348 |
9.8% |
0.4% |
Other Asia Pacific |
190 |
192 |
233 |
284 |
303 |
318 |
338 |
330 |
315 |
301 |
285 |
-4.9% |
0.3% |
Total Asia Pacific |
7882 |
7779 |
7858 |
8008 |
7988 |
8003 |
8111 |
8071 |
8420 |
8246 |
8313 |
0.7% |
9.6% |
Total World |
74948 |
77568 |
80968 |
82014 |
82482 |
82285 |
82932 |
81261 |
83272 |
84210 |
86152 |
2.2% |
100.0% |
of which: OECD |
21480 |
21165 |
20766 |
19870 |
19452 |
19147 |
18461 |
18496 |
18560 |
18607 |
19495 |
4.9% |
21.9% |
Non-OECD |
53469 |
56402 |
60203 |
62144 |
63030 |
63138 |
64471 |
62765 |
64712 |
65603 |
66657 |
1.5% |
78.1% |
OPEC |
29266 |
31231 |
34040 |
35170 |
35489 |
35161 |
36279 |
33977 |
35097 |
35954 |
37405 |
3.9% |
43.2% |
Non-OPEC‡ |
36118 |
35808 |
35515 |
35010 |
34676 |
34321 |
33830 |
34015 |
34617 |
34648 |
35088 |
1.2% |
40.5% |
European Union |
3365 |
3153 |
2924 |
2680 |
2442 |
2409 |
2258 |
2111 |
1966 |
1707 |
1538 |
-9.9% |
1.8% |
Former Soviet Union |
9565 |
10530 |
11414 |
11835 |
12318 |
12803 |
12824 |
13269 |
13558 |
13609 |
13659 |
0.4% |
16.3% |
*Includes crude oil, shale oil, oil sands and NGLs (the liquid content of natural gas where this is recovered separately). Excludes liquid fuels from other sources such as biomass and coal derivatives.Less than 0.05%.
‡Excludes Former Soviet Union.
Notes: Annual changes and shares of total are calculated using million tonnes per annum figures. Growth rates are adjusted for leap years.
8
Consumption*
|
|
|
|
|
|
|
|
|
|
|
|
Change |
2012 |
|
|
|
|
|
|
|
|
|
|
|
|
2012 over |
share |
Thousand barrels daily |
2002 |
2003 |
2004 |
2005 |
2006 |
2007 |
2008 |
2009 |
2010 |
2011 |
2012 |
2011 |
of total |
US |
19761 |
20033 |
20732 |
20802 |
20687 |
20680 |
19490 |
18769 |
19134 |
18949 |
18555 |
-2.3% |
19.8% |
Canada |
2172 |
2228 |
2309 |
2288 |
2295 |
2361 |
2315 |
2195 |
2316 |
2404 |
2412 |
-0.9% |
2.5% |
Mexico |
1864 |
1909 |
1983 |
2030 |
2019 |
2067 |
2054 |
1995 |
2014 |
2043 |
2074 |
2.3% |
2.2% |
Total North America |
23797 |
24170 |
25023 |
25119 |
25002 |
25109 |
23860 |
22959 |
23464 |
23397 |
23040 |
-1.8% |
24.6% |
Argentina |
394 |
405 |
425 |
449 |
471 |
523 |
534 |
522 |
557 |
598 |
612 |
2.3% |
0.7% |
Brazil |
2031 |
1973 |
2050 |
2097 |
2134 |
2286 |
2439 |
2467 |
2676 |
2740 |
2805 |
2.5% |
3.0% |
Chile |
225 |
228 |
244 |
250 |
278 |
358 |
372 |
367 |
329 |
367 |
376 |
1.9% |
0.4% |
Colombia |
221 |
222 |
225 |
230 |
235 |
234 |
234 |
241 |
257 |
271 |
274 |
1.0% |
0.3% |
Ecuador |
146 |
151 |
155 |
169 |
180 |
183 |
188 |
191 |
220 |
226 |
234 |
3.6% |
0.3% |
Peru |
146 |
139 |
152 |
152 |
147 |
153 |
172 |
176 |
187 |
203 |
212 |
3.2% |
0.2% |
Trinidad & Tobago |
25 |
24 |
25 |
26 |
29 |
34 |
37 |
35 |
39 |
33 |
33 |
0.2% |
|
|
|||||||||||||
Venezuela |
660 |
535 |
582 |
623 |
658 |
662 |
746 |
755 |
766 |
764 |
781 |
2.5% |
0.9% |
Other S. & Cent. America |
1156 |
1184 |
1200 |
1189 |
1202 |
1219 |
1171 |
1167 |
1192 |
1203 |
1205 |
0.2% |
1.4% |
Total S. & Cent. America |
5004 |
4860 |
5059 |
5185 |
5332 |
5651 |
5892 |
5921 |
6222 |
6405 |
6533 |
2.0% |
7.3% |
Austria |
270 |
292 |
283 |
287 |
291 |
276 |
274 |
264 |
276 |
259 |
257 |
-1.2% |
0.3% |
Azerbaijan |
73 |
84 |
88 |
106 |
96 |
91 |
74 |
73 |
71 |
89 |
93 |
5.4% |
0.1% |
Belarus |
142 |
141 |
144 |
145 |
162 |
150 |
168 |
188 |
146 |
180 |
182 |
1.1% |
0.2% |
Belgium |
650 |
688 |
680 |
679 |
671 |
676 |
747 |
650 |
672 |
662 |
636 |
-5.4% |
0.7% |
Bulgaria |
88 |
95 |
92 |
102 |
105 |
103 |
102 |
92 |
82 |
80 |
80 |
0.1% |
0.1% |
Czech Republic |
172 |
184 |
202 |
210 |
207 |
205 |
209 |
204 |
194 |
193 |
194 |
0.2% |
0.2% |
Denmark |
197 |
189 |
185 |
196 |
198 |
200 |
196 |
178 |
176 |
169 |
160 |
-6.3% |
0.2% |
Finland |
222 |
235 |
221 |
229 |
222 |
223 |
222 |
209 |
219 |
204 |
190 |
-6.2% |
0.2% |
France |
1953 |
1952 |
1963 |
1946 |
1942 |
1911 |
1889 |
1822 |
1763 |
1742 |
1687 |
-3.6% |
2.0% |
Germany |
2697 |
2648 |
2619 |
2592 |
2609 |
2380 |
2502 |
2409 |
2445 |
2369 |
2358 |
-0.7% |
2.7% |
Greece |
406 |
396 |
426 |
424 |
442 |
435 |
425 |
405 |
368 |
347 |
313 |
-9.5% |
0.4% |
Hungary |
139 |
131 |
136 |
158 |
168 |
168 |
164 |
154 |
146 |
140 |
129 |
-7.7% |
0.1% |
Republic of Ireland |
179 |
175 |
181 |
191 |
191 |
195 |
187 |
166 |
158 |
141 |
130 |
-7.7% |
0.2% |
Italy |
1915 |
1900 |
1850 |
1798 |
1791 |
1740 |
1661 |
1563 |
1532 |
1475 |
1345 |
-9.2% |
1.6% |
Kazakhstan |
169 |
183 |
196 |
204 |
210 |
233 |
229 |
188 |
196 |
242 |
265 |
10.2% |
0.3% |
Lithuania |
51 |
50 |
53 |
57 |
58 |
58 |
63 |
54 |
55 |
53 |
53 |
-1.2% |
0.1% |
Netherlands |
934 |
946 |
983 |
1039 |
1047 |
1065 |
991 |
971 |
977 |
971 |
933 |
-4.5% |
1.1% |
Norway |
216 |
232 |
221 |
224 |
229 |
237 |
228 |
236 |
235 |
240 |
247 |
1.3% |
0.3% |
Poland |
430 |
441 |
469 |
487 |
512 |
531 |
549 |
549 |
576 |
574 |
542 |
-5.8% |
0.6% |
Portugal |
332 |
311 |
315 |
324 |
294 |
296 |
278 |
263 |
259 |
240 |
226 |
-6.2% |
0.3% |
Romania |
220 |
194 |
224 |
218 |
214 |
218 |
216 |
195 |
184 |
191 |
182 |
-3.6% |
0.2% |
Russian Federation |
2559 |
2679 |
2660 |
2679 |
2761 |
2777 |
2862 |
2772 |
2892 |
3089 |
3174 |
2.5% |
3.6% |
Slovakia |
75 |
70 |
67 |
80 |
72 |
76 |
82 |
79 |
82 |
81 |
73 |
-9.3% |
0.1% |
Spain |
1493 |
1539 |
1575 |
1594 |
1592 |
1613 |
1557 |
1473 |
1394 |
1377 |
1278 |
-7.2% |
1.5% |
Sweden |
346 |
352 |
339 |
339 |
344 |
342 |
332 |
307 |
321 |
305 |
295 |
-4.8% |
0.3% |
Switzerland |
264 |
257 |
255 |
260 |
266 |
241 |
256 |
260 |
242 |
235 |
238 |
1.6% |
0.3% |
Turkey |
643 |
641 |
655 |
662 |
696 |
716 |
681 |
683 |
694 |
673 |
685 |
2.3% |
0.8% |
Turkmenistan |
81 |
91 |
88 |
90 |
85 |
95 |
104 |
96 |
93 |
97 |
100 |
3.3% |
0.1% |
Ukraine |
282 |
295 |
310 |
296 |
308 |
338 |
322 |
287 |
281 |
277 |
282 |
1.9% |
0.3% |
United Kingdom |
1700 |
1723 |
1766 |
1806 |
1788 |
1716 |
1683 |
1610 |
1588 |
1532 |
1468 |
-4.0% |
1.7% |
Uzbekistan |
131 |
162 |
149 |
100 |
101 |
93 |
91 |
88 |
75 |
80 |
82 |
2.1% |
0.1% |
Other Europe & Eurasia |
535 |
567 |
601 |
624 |
640 |
663 |
673 |
663 |
665 |
668 |
668 |
-0.3% |
0.8% |
Total Europe & Eurasia |
19563 |
19842 |
19998 |
20142 |
20311 |
20062 |
20017 |
19149 |
19057 |
18974 |
18543 |
-2.5% |
21.3% |
Iran |
1486 |
1581 |
1639 |
1705 |
1826 |
1868 |
1962 |
1996 |
1936 |
1878 |
1971 |
4.3% |
2.2% |
Israel |
260 |
267 |
251 |
257 |
251 |
264 |
259 |
244 |
236 |
249 |
289 |
17.8% |
0.3% |
Kuwait |
285 |
334 |
374 |
411 |
378 |
383 |
405 |
453 |
489 |
466 |
476 |
2.5% |
0.5% |
Qatar |
84 |
95 |
106 |
121 |
134 |
150 |
171 |
173 |
212 |
235 |
250 |
2.5% |
0.2% |
Saudi Arabia |
1668 |
1780 |
1913 |
2013 |
2084 |
2203 |
2378 |
2592 |
2790 |
2835 |
2935 |
3.9% |
3.1% |
United Arab Emirates |
412 |
453 |
484 |
493 |
527 |
565 |
586 |
576 |
631 |
699 |
720 |
2.2% |
0.8% |
Other Middle East |
1257 |
1176 |
1258 |
1335 |
1248 |
1263 |
1425 |
1492 |
1567 |
1629 |
1714 |
5.3% |
2.0% |
Total Middle East |
5452 |
5686 |
6026 |
6335 |
6449 |
6696 |
7185 |
7526 |
7861 |
7992 |
8354 |
4.5% |
9.1% |
Algeria |
221 |
230 |
239 |
250 |
258 |
286 |
309 |
327 |
327 |
345 |
367 |
6.9% |
0.4% |
Egypt |
524 |
540 |
556 |
617 |
602 |
642 |
687 |
726 |
766 |
718 |
744 |
4.4% |
0.9% |
South Africa |
480 |
497 |
513 |
514 |
528 |
549 |
528 |
517 |
547 |
547 |
561 |
2.6% |
0.7% |
Other Africa |
1342 |
1380 |
1459 |
1531 |
1532 |
1590 |
1694 |
1734 |
1822 |
1749 |
1850 |
5.8% |
2.1% |
Total Africa |
2568 |
2646 |
2767 |
2911 |
2920 |
3068 |
3218 |
3302 |
3463 |
3359 |
3523 |
5.1% |
4.0% |
Australia |
844 |
854 |
863 |
896 |
929 |
936 |
949 |
943 |
962 |
1007 |
1019 |
0.9% |
1.1% |
Bangladesh |
80 |
83 |
86 |
89 |
89 |
86 |
84 |
78 |
86 |
108 |
114 |
6.3% |
0.1% |
China |
5262 |
5771 |
6738 |
6944 |
7439 |
7823 |
7947 |
8229 |
9272 |
9750 |
10221 |
5.0% |
11.7% |
China Hong Kong SAR |
267 |
269 |
313 |
285 |
305 |
324 |
293 |
334 |
362 |
364 |
360 |
-1.2% |
0.4% |
India |
2413 |
2485 |
2556 |
2606 |
2737 |
2941 |
3077 |
3237 |
3319 |
3488 |
3652 |
5.0% |
4.2% |
Indonesia |
1184 |
1210 |
1278 |
1263 |
1234 |
1271 |
1263 |
1316 |
1426 |
1549 |
1565 |
0.4% |
1.7% |
Japan |
5357 |
5461 |
5308 |
5391 |
5210 |
5053 |
4882 |
4429 |
4473 |
4465 |
4714 |
6.3% |
5.3% |
Malaysia |
561 |
561 |
585 |
580 |
615 |
672 |
661 |
662 |
672 |
682 |
697 |
2.1% |
0.7% |
New Zealand |
139 |
145 |
150 |
151 |
153 |
154 |
154 |
148 |
150 |
149 |
149 |
-0.1% |
0.2% |
Pakistan |
356 |
319 |
324 |
311 |
354 |
387 |
388 |
414 |
411 |
417 |
402 |
-4.2% |
0.5% |
Philippines |
330 |
329 |
336 |
314 |
284 |
301 |
266 |
283 |
286 |
279 |
282 |
0.7% |
0.3% |
Singapore |
739 |
689 |
763 |
830 |
884 |
963 |
1015 |
1083 |
1193 |
1246 |
1255 |
0.4% |
1.6% |
South Korea |
2320 |
2340 |
2294 |
2312 |
2320 |
2399 |
2308 |
2339 |
2370 |
2394 |
2458 |
2.5% |
2.6% |
Taiwan |
957 |
998 |
1043 |
1053 |
1043 |
1096 |
992 |
987 |
1028 |
951 |
939 |
-1.8% |
1.0% |
Thailand |
798 |
863 |
930 |
959 |
973 |
984 |
994 |
1071 |
1076 |
1171 |
1212 |
3.6% |
1.3% |
Vietnam |
205 |
220 |
263 |
258 |
254 |
283 |
300 |
304 |
329 |
358 |
361 |
0.7% |
0.4% |
Other Asia Pacific |
275 |
284 |
293 |
296 |
302 |
317 |
307 |
349 |
351 |
376 |
382 |
1.3% |
0.4% |
Total Asia Pacific |
22086 |
22880 |
24124 |
24535 |
25124 |
25989 |
25881 |
26205 |
27766 |
28754 |
29781 |
3.7% |
33.6% |
Total World |
78470 |
80085 |
82996 |
84228 |
85138 |
86575 |
86052 |
85064 |
87833 |
88879 |
89774 |
0.9% |
100.0% |
of which: OECD |
48322 |
48915 |
49687 |
50064 |
49880 |
49682 |
48070 |
46042 |
46460 |
46117 |
45587 |
-1.3% |
50.2% |
Non-OECD |
30149 |
31170 |
33309 |
34164 |
35259 |
36893 |
37983 |
39021 |
41373 |
42762 |
44187 |
3.3% |
49.8% |
European Union |
14708 |
14759 |
14891 |
15021 |
15023 |
14700 |
14610 |
13880 |
13741 |
13377 |
12796 |
-4.6% |
14.8% |
Former Soviet Union |
3593 |
3791 |
3805 |
3798 |
3906 |
3981 |
4059 |
3889 |
3963 |
4261 |
4391 |
2.9% |
5.0% |
*Inland demand plus international aviation and marine bunkers and refinery fuel and loss. Consumption of fuel ethanol and biodiesel is also included.Less than 0.05%.
Notes: Differences between these world consumption figures and world production statistics are accounted for by stock changes, consumption of non-petroleum additives and substitute fuels, and unavoidable disparities in the definition, measurement or conversion of oil supply and demand data.
Annual changes and shares of total are calculated using million tonnes per annum figures. Growth rates are adjusted for leap years.
9

Production*
|
|
|
|
|
|
|
|
|
|
|
|
Change |
2012 |
|
|
|
|
|
|
|
|
|
|
|
|
2012 over |
share |
Million tonnes |
2002 |
2003 |
2004 |
2005 |
2006 |
2007 |
2008 |
2009 |
2010 |
2011 |
2012 |
2011 |
of total |
US |
342.0 |
332.3 |
325.1 |
309.1 |
304.7 |
305.2 |
302.3 |
322.4 |
332.9 |
345.7 |
394.9 |
13.9% |
9.6% |
Canada |
132.6 |
140.2 |
144.8 |
142.3 |
150.6 |
155.3 |
152.9 |
152.8 |
160.3 |
170.4 |
182.6 |
6.8% |
4.4% |
Mexico |
177.8 |
188.2 |
190.0 |
186.5 |
182.5 |
172.2 |
156.9 |
146.7 |
145.6 |
144.5 |
143.9 |
-0.7% |
3.5% |
Total North America |
652.4 |
660.7 |
659.9 |
637.9 |
637.8 |
632.7 |
612.0 |
621.9 |
638.8 |
660.7 |
721.4 |
8.9% |
17.5% |
Argentina |
43.1 |
42.8 |
40.9 |
39.4 |
39.1 |
38.0 |
36.5 |
34.9 |
34.0 |
32.2 |
31.0 |
-3.8% |
0.8% |
Brazil |
78.4 |
81.1 |
80.6 |
88.7 |
93.7 |
95.2 |
98.8 |
105.6 |
111.4 |
114.2 |
112.2 |
-2.0% |
2.7% |
Colombia |
30.4 |
28.5 |
27.9 |
27.7 |
27.9 |
28.0 |
31.1 |
35.3 |
41.4 |
48.2 |
49.9 |
3.2% |
1.2% |
Ecuador |
21.1 |
22.5 |
28.3 |
28.6 |
28.8 |
27.5 |
27.2 |
26.1 |
26.1 |
26.8 |
27.1 |
0.8% |
0.7% |
Peru |
4.9 |
4.6 |
4.4 |
4.5 |
4.6 |
4.6 |
4.7 |
4.8 |
5.1 |
4.9 |
4.8 |
-3.0% |
0.1% |
Trinidad & Tobago |
8.0 |
8.7 |
8.2 |
9.0 |
9.6 |
8.2 |
8.7 |
7.6 |
7.4 |
6.9 |
6.0 |
-13.7% |
0.1% |
Venezuela |
152.8 |
147.5 |
170.1 |
169.7 |
171.0 |
165.5 |
165.6 |
155.7 |
145.7 |
141.5 |
139.7 |
-1.5% |
3.4% |
Other S. & Cent. America |
7.7 |
7.8 |
7.4 |
7.4 |
7.1 |
7.2 |
7.1 |
6.9 |
6.9 |
7.0 |
7.3 |
4.5% |
0.2% |
Total S. & Cent. America |
346.4 |
343.3 |
367.8 |
374.9 |
381.8 |
374.2 |
379.7 |
376.9 |
377.9 |
381.7 |
378.0 |
-1.2% |
9.2% |
Azerbaijan |
15.3 |
15.4 |
15.5 |
22.2 |
32.3 |
42.6 |
44.5 |
50.4 |
50.8 |
45.6 |
43.4 |
-5.2% |
1.1% |
Denmark |
18.1 |
17.9 |
19.1 |
18.4 |
16.7 |
15.2 |
14.0 |
12.9 |
12.2 |
10.9 |
10.1 |
-8.0% |
0.2% |
Italy |
5.5 |
5.6 |
5.5 |
6.1 |
5.8 |
5.9 |
5.2 |
4.6 |
5.1 |
5.3 |
5.4 |
1.4% |
0.1% |
Kazakhstan |
48.2 |
52.4 |
60.6 |
62.6 |
66.1 |
68.4 |
72.0 |
78.2 |
81.6 |
82.4 |
81.3 |
-1.6% |
2.0% |
Norway |
157.9 |
153.9 |
150.3 |
138.7 |
129.0 |
118.6 |
114.7 |
108.8 |
98.9 |
93.8 |
87.5 |
-7.0% |
2.1% |
Romania |
6.1 |
5.9 |
5.7 |
5.4 |
5.0 |
4.7 |
4.7 |
4.5 |
4.3 |
4.2 |
4.1 |
-2.8% |
0.1% |
Russian Federation |
383.7 |
425.7 |
463.3 |
474.8 |
485.6 |
496.8 |
493.7 |
500.8 |
511.8 |
518.5 |
526.2 |
1.2% |
12.8% |
Turkmenistan |
9.0 |
10.0 |
9.6 |
9.5 |
9.2 |
9.8 |
10.3 |
10.4 |
10.7 |
10.7 |
11.0 |
2.5% |
0.3% |
United Kingdom |
115.7 |
105.8 |
95.2 |
84.6 |
76.5 |
76.7 |
72.0 |
68.2 |
62.8 |
51.9 |
45.0 |
-13.4% |
1.1% |
Uzbekistan |
7.2 |
7.1 |
6.6 |
5.4 |
5.4 |
4.9 |
4.8 |
4.5 |
3.6 |
3.6 |
3.2 |
-12.0% |
0.1% |
Other Europe & Eurasia |
23.6 |
24.0 |
23.4 |
22.0 |
21.7 |
21.6 |
20.6 |
19.9 |
19.2 |
19.2 |
19.2 |
-0.7% |
0.5% |
Total Europe & Eurasia |
790.3 |
823.7 |
854.6 |
849.8 |
853.2 |
865.2 |
856.6 |
863.1 |
861.0 |
846.1 |
836.4 |
-1.4% |
20.3% |
Iran |
177.5 |
198.5 |
208.2 |
206.4 |
209.2 |
210.9 |
214.5 |
205.5 |
208.8 |
208.2 |
174.9 |
-16.2% |
4.2% |
Iraq |
103.9 |
66.0 |
99.9 |
89.9 |
98.0 |
105.1 |
119.3 |
119.9 |
121.5 |
136.7 |
152.4 |
11.2% |
3.7% |
Kuwait |
98.9 |
115.6 |
123.4 |
130.4 |
133.7 |
129.9 |
136.1 |
121.2 |
122.5 |
139.7 |
152.5 |
8.9% |
3.7% |
Oman |
44.6 |
40.7 |
38.9 |
38.5 |
36.6 |
35.3 |
37.7 |
40.3 |
42.9 |
44.1 |
45.8 |
3.5% |
1.1% |
Qatar |
37.4 |
43.8 |
50.0 |
52.6 |
56.8 |
57.9 |
65.0 |
62.4 |
72.1 |
78.2 |
83.3 |
6.3% |
2.0% |
Saudi Arabia |
425.2 |
486.2 |
500.4 |
521.3 |
508.9 |
488.9 |
509.9 |
456.7 |
473.8 |
526.0 |
547.0 |
3.7% |
13.3% |
Syria |
33.7 |
32.4 |
24.3 |
22.3 |
21.0 |
20.1 |
20.3 |
20.0 |
19.2 |
16.3 |
8.2 |
-49.9% |
0.2% |
United Arab Emirates |
112.5 |
126.2 |
132.0 |
135.8 |
144.3 |
139.6 |
141.4 |
126.2 |
133.3 |
151.3 |
154.1 |
1.6% |
3.7% |
Yemen |
21.6 |
21.2 |
20.0 |
19.8 |
18.1 |
15.9 |
14.8 |
14.3 |
13.5 |
10.6 |
8.3 |
-21.4% |
0.2% |
Other Middle East |
2.3 |
2.3 |
2.3 |
9.1 |
8.9 |
9.3 |
9.3 |
9.4 |
9.4 |
10.0 |
10.1 |
1.3% |
0.2% |
Total Middle East |
1057.5 |
1133.0 |
1199.4 |
1226.0 |
1235.7 |
1213.0 |
1268.2 |
1176.1 |
1217.2 |
1321.0 |
1336.8 |
0.9% |
32.5% |
Algeria |
70.9 |
79.0 |
83.6 |
86.4 |
86.2 |
86.5 |
85.6 |
77.2 |
74.1 |
73.5 |
73.0 |
-0.9% |
1.8% |
Angola |
44.6 |
42.8 |
54.5 |
68.9 |
69.3 |
82.1 |
93.1 |
87.6 |
90.5 |
83.8 |
86.9 |
3.4% |
2.1% |
Chad |
– |
1.2 |
8.8 |
9.1 |
8.0 |
7.5 |
6.7 |
6.2 |
6.4 |
6.0 |
5.3 |
-11.3% |
0.1% |
Republic of Congo (Brazzaville) |
11.7 |
10.7 |
11.2 |
12.3 |
14.0 |
11.4 |
12.1 |
13.9 |
15.1 |
15.1 |
15.3 |
0.8% |
0.4% |
Egypt |
37.2 |
37.1 |
34.8 |
33.2 |
34.5 |
33.8 |
34.7 |
35.3 |
35.0 |
35.3 |
35.4 |
0.1% |
0.9% |
Equatorial Guinea |
11.1 |
12.7 |
16.5 |
16.4 |
15.6 |
15.9 |
16.1 |
14.2 |
12.6 |
11.6 |
13.2 |
13.4% |
0.3% |
Gabon |
12.8 |
13.7 |
13.7 |
13.5 |
12.1 |
12.3 |
12.0 |
12.0 |
12.7 |
12.7 |
12.3 |
-3.5% |
0.3% |
Libya |
64.6 |
69.8 |
76.5 |
82.2 |
85.3 |
85.3 |
85.5 |
77.4 |
77.7 |
22.5 |
71.1 |
215.1% |
1.7% |
Nigeria |
101.7 |
109.0 |
119.0 |
122.1 |
116.6 |
110.2 |
102.8 |
106.6 |
121.3 |
118.2 |
116.2 |
-1.9% |
2.8% |
South Sudan |
– |
– |
– |
– |
– |
– |
– |
– |
– |
– |
1.5 |
– |
|
Sudan |
11.9 |
13.1 |
14.9 |
15.0 |
16.3 |
23.1 |
23.7 |
23.4 |
22.9 |
22.3 |
4.1 |
-81.9% |
0.1% |
Tunisia |
3.5 |
3.2 |
3.4 |
3.4 |
3.3 |
4.6 |
4.2 |
4.0 |
3.8 |
3.2 |
3.1 |
-4.7% |
0.1% |
Other Africa |
6.8 |
7.0 |
8.2 |
8.6 |
11.2 |
9.7 |
9.5 |
9.2 |
8.3 |
11.5 |
11.6 |
1.0% |
0.3% |
Total Africa |
376.8 |
399.3 |
445.1 |
471.1 |
472.3 |
482.2 |
486.0 |
466.8 |
480.6 |
415.7 |
449.0 |
7.7% |
10.9% |
Australia |
33.4 |
27.8 |
24.0 |
24.2 |
23.3 |
24.3 |
24.8 |
24.6 |
25.4 |
21.7 |
19.9 |
-8.6% |
0.5% |
Brunei |
10.3 |
10.5 |
10.3 |
10.1 |
10.8 |
9.5 |
8.6 |
8.3 |
8.5 |
8.1 |
7.8 |
-4.3% |
0.2% |
China |
166.9 |
169.6 |
174.1 |
181.4 |
184.8 |
186.3 |
190.4 |
189.5 |
203.0 |
202.9 |
207.5 |
2.0% |
5.0% |
India |
37.2 |
37.3 |
38.2 |
36.6 |
37.8 |
37.9 |
37.9 |
37.2 |
40.8 |
42.3 |
42.0 |
-0.9% |
1.0% |
Indonesia |
63.3 |
57.6 |
55.6 |
53.7 |
50.2 |
47.8 |
49.4 |
48.4 |
48.6 |
46.3 |
44.6 |
-3.9% |
1.1% |
Malaysia |
34.2 |
35.4 |
36.3 |
34.6 |
32.7 |
33.8 |
34.0 |
32.2 |
32.0 |
28.9 |
29.7 |
2.6% |
0.7% |
Thailand |
8.1 |
9.5 |
9.3 |
11.4 |
12.5 |
13.2 |
14.0 |
14.6 |
14.8 |
14.8 |
16.2 |
9.1% |
0.4% |
Vietnam |
17.3 |
17.6 |
20.7 |
19.0 |
17.2 |
16.3 |
15.2 |
16.7 |
15.3 |
15.5 |
17.0 |
9.8% |
0.4% |
Other Asia Pacific |
8.7 |
8.8 |
10.4 |
12.4 |
13.1 |
13.9 |
14.8 |
14.4 |
13.8 |
13.1 |
12.5 |
-4.9% |
0.3% |
Total Asia Pacific |
379.3 |
374.2 |
378.8 |
383.3 |
382.4 |
383.1 |
389.3 |
385.8 |
402.3 |
393.6 |
397.3 |
0.7% |
9.6% |
Total World |
3602.7 |
3734.3 |
3905.5 |
3943.1 |
3963.3 |
3950.4 |
3991.8 |
3890.6 |
3977.8 |
4018.8 |
4118.9 |
2.2% |
100.0% |
of which: OECD |
1000.1 |
988.7 |
970.0 |
924.8 |
903.7 |
889.0 |
858.6 |
855.9 |
857.5 |
858.4 |
903.0 |
4.9% |
21.9% |
Non-OECD |
2602.6 |
2745.6 |
2935.6 |
3018.3 |
3059.7 |
3061.3 |
3133.2 |
3034.7 |
3120.3 |
3160.4 |
3215.9 |
1.5% |
78.1% |
OPEC |
1411.0 |
1506.9 |
1645.9 |
1694.2 |
1708.2 |
1689.2 |
1746.0 |
1622.5 |
1667.6 |
1706.2 |
1778.4 |
3.9% |
43.2% |
Non-OPEC‡ |
1721.5 |
1709.5 |
1696.9 |
1667.1 |
1649.5 |
1631.7 |
1613.8 |
1617.1 |
1645.3 |
1645.8 |
1669.6 |
1.2% |
40.5% |
European Union |
158.0 |
147.9 |
137.5 |
125.6 |
114.4 |
113.1 |
105.7 |
99.1 |
92.5 |
80.8 |
73.0 |
-9.9% |
1.8% |
Former Soviet Union |
470.2 |
517.8 |
562.7 |
581.8 |
605.6 |
629.4 |
632.0 |
651.0 |
664.8 |
666.7 |
670.9 |
0.4% |
16.3% |
*Includes crude oil, shale oil, oil sands and NGLs (the liquid content of natural gas where this is recovered separately). Excludes liquid fuels from other sources such as biomass and coal derivatives.Less than 0.05%.
‡Excludes Former Soviet Union.
Note: Growth rates are adjusted for leap years.
10

Consumption*
|
|
|
|
|
|
|
|
|
|
|
|
Change |
2012 |
|
|
|
|
|
|
|
|
|
|
|
|
2012 over |
share |
Million tonnes |
2002 |
2003 |
2004 |
2005 |
2006 |
2007 |
2008 |
2009 |
2010 |
2011 |
2012 |
2011 |
of total |
US |
884.9 |
900.7 |
936.5 |
939.8 |
930.7 |
928.8 |
875.4 |
833.0 |
847.4 |
837.0 |
819.9 |
-2.3% |
19.8% |
Canada |
93.8 |
97.3 |
100.8 |
99.9 |
99.4 |
102.3 |
101.2 |
95.2 |
101.3 |
105.0 |
104.3 |
-0.9% |
2.5% |
Mexico |
82.8 |
85.0 |
88.5 |
90.8 |
89.7 |
92.0 |
91.6 |
88.5 |
88.5 |
90.3 |
92.6 |
2.3% |
2.2% |
Total North America |
1061.5 |
1083.0 |
1125.9 |
1130.5 |
1119.7 |
1123.1 |
1068.2 |
1016.8 |
1037.3 |
1032.3 |
1016.8 |
-1.8% |
24.6% |
Argentina |
18.0 |
18.5 |
19.4 |
20.7 |
21.7 |
24.0 |
24.7 |
24.0 |
26.0 |
27.5 |
28.2 |
2.3% |
0.7% |
Brazil |
91.5 |
88.7 |
92.0 |
94.2 |
95.8 |
101.8 |
108.6 |
109.1 |
118.3 |
122.2 |
125.6 |
2.5% |
3.0% |
Chile |
10.4 |
10.6 |
11.5 |
11.8 |
13.2 |
17.0 |
17.8 |
17.4 |
15.4 |
17.5 |
17.9 |
1.9% |
0.4% |
Colombia |
10.0 |
10.0 |
10.3 |
10.5 |
10.7 |
10.7 |
10.8 |
11.1 |
11.9 |
12.5 |
12.7 |
1.0% |
0.3% |
Ecuador |
6.8 |
7.0 |
7.2 |
7.9 |
8.3 |
8.5 |
8.7 |
8.9 |
10.3 |
10.5 |
11.0 |
3.6% |
0.3% |
Peru |
6.9 |
6.5 |
7.3 |
7.1 |
6.9 |
7.1 |
8.0 |
8.1 |
8.5 |
9.2 |
9.6 |
3.2% |
0.2% |
Trinidad & Tobago |
1.2 |
1.1 |
1.2 |
1.2 |
1.4 |
1.7 |
1.8 |
1.7 |
1.9 |
1.6 |
1.6 |
0.2% |
|
|
|||||||||||||
Venezuela |
30.3 |
24.9 |
27.2 |
28.8 |
30.3 |
30.4 |
34.8 |
35.2 |
35.8 |
35.6 |
36.6 |
2.5% |
0.9% |
Other S. & Cent. America |
57.2 |
58.5 |
59.6 |
58.8 |
59.5 |
60.1 |
57.8 |
57.0 |
58.2 |
58.7 |
59.0 |
0.2% |
1.4% |
Total S. & Cent. America |
232.5 |
226.1 |
235.8 |
241.0 |
247.7 |
261.3 |
272.9 |
272.5 |
286.1 |
295.4 |
302.2 |
2.0% |
7.3% |
Austria |
13.2 |
14.2 |
13.9 |
14.0 |
14.2 |
13.4 |
13.4 |
12.8 |
13.4 |
12.6 |
12.4 |
-1.2% |
0.3% |
Azerbaijan |
3.7 |
4.3 |
4.5 |
5.4 |
4.8 |
4.5 |
3.6 |
3.3 |
3.2 |
4.0 |
4.2 |
5.4% |
0.1% |
Belarus |
7.1 |
7.0 |
7.1 |
7.1 |
8.1 |
7.3 |
8.3 |
9.4 |
7.3 |
9.0 |
9.1 |
1.1% |
0.2% |
Belgium |
31.7 |
33.8 |
33.5 |
33.5 |
33.4 |
33.7 |
36.8 |
32.2 |
33.5 |
32.3 |
30.6 |
-5.4% |
0.7% |
Bulgaria |
4.2 |
4.4 |
4.3 |
4.8 |
5.0 |
4.8 |
4.8 |
4.3 |
3.9 |
3.8 |
3.8 |
0.1% |
0.1% |
Czech Republic |
8.1 |
8.7 |
9.5 |
9.9 |
9.8 |
9.7 |
9.9 |
9.7 |
9.1 |
9.0 |
9.1 |
0.2% |
0.2% |
Denmark |
9.6 |
9.2 |
9.0 |
9.4 |
9.6 |
9.7 |
9.5 |
8.5 |
8.4 |
8.1 |
7.6 |
-6.3% |
0.2% |
Finland |
10.9 |
11.4 |
10.6 |
11.0 |
10.6 |
10.6 |
10.5 |
9.9 |
10.4 |
9.7 |
9.1 |
-6.2% |
0.2% |
France |
92.9 |
93.1 |
94.0 |
93.1 |
93.0 |
91.4 |
90.8 |
87.5 |
84.5 |
83.7 |
80.9 |
-3.6% |
2.0% |
Germany |
127.4 |
125.1 |
124.0 |
122.4 |
123.6 |
112.5 |
118.9 |
113.9 |
115.4 |
112.0 |
111.5 |
-0.7% |
2.7% |
Greece |
20.3 |
19.7 |
21.3 |
21.1 |
22.1 |
21.7 |
21.3 |
20.1 |
18.0 |
17.0 |
15.4 |
-9.5% |
0.4% |
Hungary |
6.4 |
6.1 |
6.3 |
7.4 |
7.8 |
7.7 |
7.5 |
7.1 |
6.7 |
6.4 |
6.0 |
-7.7% |
0.1% |
Republic of Ireland |
8.8 |
8.5 |
8.9 |
9.3 |
9.3 |
9.4 |
9.0 |
8.0 |
7.6 |
6.7 |
6.2 |
-7.7% |
0.2% |
Italy |
92.9 |
92.1 |
89.7 |
86.7 |
86.7 |
84.0 |
80.4 |
75.1 |
73.1 |
70.5 |
64.2 |
-9.2% |
1.6% |
Kazakhstan |
8.3 |
8.9 |
9.5 |
9.8 |
10.3 |
11.3 |
11.0 |
8.9 |
9.3 |
11.6 |
12.8 |
10.2% |
0.3% |
Lithuania |
2.5 |
2.4 |
2.6 |
2.8 |
2.8 |
2.8 |
3.1 |
2.6 |
2.7 |
2.6 |
2.6 |
-1.2% |
0.1% |
Netherlands |
44.7 |
45.1 |
47.1 |
50.1 |
50.8 |
50.7 |
47.3 |
45.9 |
45.9 |
46.1 |
44.1 |
-4.5% |
1.1% |
Norway |
9.8 |
10.4 |
10.0 |
10.2 |
10.5 |
10.7 |
10.4 |
10.6 |
10.8 |
10.6 |
10.8 |
1.3% |
0.3% |
Poland |
19.9 |
20.2 |
21.6 |
22.4 |
23.3 |
24.2 |
25.3 |
25.3 |
26.7 |
26.6 |
25.1 |
-5.8% |
0.6% |
Portugal |
16.2 |
15.2 |
15.4 |
16.0 |
14.4 |
14.4 |
13.6 |
12.8 |
12.5 |
11.6 |
10.9 |
-6.2% |
0.3% |
Romania |
10.6 |
9.4 |
10.9 |
10.5 |
10.3 |
10.3 |
10.4 |
9.2 |
8.8 |
9.1 |
8.8 |
-3.6% |
0.2% |
Russian Federation |
122.3 |
127.3 |
126.2 |
126.1 |
130.3 |
130.0 |
133.9 |
128.2 |
134.3 |
143.5 |
147.5 |
2.5% |
3.6% |
Slovakia |
3.5 |
3.3 |
3.2 |
3.8 |
3.4 |
3.6 |
3.9 |
3.7 |
3.9 |
3.9 |
3.5 |
-9.3% |
0.1% |
Spain |
73.7 |
76.2 |
78.5 |
79.3 |
79.3 |
80.3 |
77.9 |
73.5 |
69.6 |
68.5 |
63.8 |
-7.2% |
1.5% |
Sweden |
16.3 |
16.9 |
16.2 |
16.1 |
16.5 |
16.0 |
15.7 |
14.6 |
15.3 |
14.5 |
13.8 |
-4.8% |
0.3% |
Switzerland |
12.4 |
12.1 |
12.0 |
12.2 |
12.6 |
11.3 |
12.1 |
12.3 |
11.4 |
11.0 |
11.2 |
1.6% |
0.3% |
Turkey |
30.5 |
30.5 |
30.8 |
30.9 |
32.7 |
33.5 |
31.9 |
31.6 |
31.8 |
30.7 |
31.5 |
2.3% |
0.8% |
Turkmenistan |
3.9 |
4.4 |
4.3 |
4.3 |
4.1 |
4.6 |
5.1 |
4.6 |
4.5 |
4.7 |
4.8 |
3.3% |
0.1% |
Ukraine |
13.3 |
13.6 |
14.3 |
13.7 |
14.2 |
15.6 |
14.9 |
13.4 |
13.0 |
12.9 |
13.2 |
1.9% |
0.3% |
United Kingdom |
78.0 |
79.0 |
81.7 |
83.0 |
82.3 |
79.2 |
77.9 |
74.4 |
73.5 |
71.1 |
68.5 |
-4.0% |
1.7% |
Uzbekistan |
6.6 |
8.2 |
7.7 |
5.0 |
5.0 |
4.6 |
4.5 |
4.3 |
3.6 |
3.8 |
3.9 |
2.1% |
0.1% |
Other Europe & Eurasia |
26.5 |
28.1 |
29.7 |
30.8 |
31.5 |
32.5 |
33.1 |
32.6 |
32.8 |
32.8 |
32.8 |
-0.3% |
0.8% |
Total Europe & Eurasia |
936.1 |
948.7 |
958.3 |
962.0 |
972.1 |
956.4 |
956.7 |
910.6 |
904.7 |
900.3 |
879.8 |
-2.5% |
21.3% |
Iran |
70.0 |
74.3 |
76.9 |
80.7 |
86.5 |
88.6 |
92.2 |
93.5 |
88.3 |
85.6 |
89.6 |
4.3% |
2.2% |
Israel |
12.4 |
12.8 |
12.0 |
12.2 |
11.9 |
12.4 |
12.2 |
11.4 |
10.9 |
11.5 |
13.6 |
17.8% |
0.3% |
Kuwait |
13.2 |
15.6 |
17.8 |
19.5 |
17.7 |
17.9 |
19.0 |
20.3 |
21.7 |
20.4 |
20.9 |
2.5% |
0.5% |
Qatar |
3.0 |
3.1 |
3.4 |
4.0 |
4.5 |
5.2 |
6.0 |
6.0 |
6.9 |
7.8 |
8.0 |
2.5% |
0.2% |
Saudi Arabia |
76.6 |
81.7 |
88.3 |
88.2 |
92.4 |
98.1 |
106.8 |
115.8 |
123.5 |
124.4 |
129.7 |
3.9% |
3.1% |
United Arab Emirates |
20.0 |
22.1 |
23.9 |
24.5 |
26.3 |
28.2 |
29.4 |
28.1 |
30.0 |
31.8 |
32.6 |
2.2% |
0.8% |
Other Middle East |
61.5 |
57.3 |
60.5 |
63.5 |
59.3 |
60.0 |
68.6 |
71.3 |
74.6 |
77.1 |
81.4 |
5.3% |
2.0% |
Total Middle East |
256.7 |
266.9 |
282.7 |
292.7 |
298.6 |
310.3 |
334.1 |
346.4 |
356.1 |
358.7 |
375.8 |
4.5% |
9.1% |
Algeria |
9.7 |
10.1 |
10.6 |
11.0 |
11.5 |
12.9 |
14.0 |
14.9 |
14.8 |
15.5 |
16.7 |
6.9% |
0.4% |
Egypt |
25.2 |
25.9 |
26.8 |
29.8 |
28.7 |
30.6 |
32.6 |
34.4 |
36.3 |
33.7 |
35.2 |
4.4% |
0.9% |
South Africa |
23.1 |
23.9 |
24.7 |
24.6 |
25.3 |
26.2 |
25.3 |
24.7 |
26.1 |
26.2 |
26.9 |
2.6% |
0.7% |
Other Africa |
64.1 |
65.6 |
69.7 |
73.1 |
72.9 |
75.7 |
80.5 |
82.1 |
86.4 |
82.7 |
87.7 |
5.8% |
2.1% |
Total Africa |
122.1 |
125.5 |
131.8 |
138.5 |
138.4 |
145.4 |
152.5 |
156.0 |
163.6 |
158.0 |
166.5 |
5.1% |
4.0% |
Australia |
38.2 |
38.8 |
39.5 |
40.7 |
42.1 |
42.4 |
43.2 |
42.9 |
43.7 |
46.1 |
46.7 |
0.9% |
1.1% |
Bangladesh |
3.9 |
4.0 |
4.2 |
4.3 |
4.3 |
4.2 |
4.1 |
3.8 |
4.2 |
5.3 |
5.6 |
6.3% |
0.1% |
China |
247.5 |
271.7 |
318.9 |
327.8 |
351.2 |
369.3 |
376.0 |
388.2 |
437.7 |
459.4 |
483.7 |
5.0% |
11.7% |
China Hong Kong SAR |
12.9 |
13.0 |
15.4 |
13.8 |
15.0 |
16.1 |
14.6 |
16.6 |
17.9 |
18.1 |
17.9 |
-1.2% |
0.4% |
India |
113.2 |
116.5 |
119.5 |
121.9 |
128.3 |
138.1 |
144.7 |
152.6 |
155.4 |
163.0 |
171.6 |
5.0% |
4.2% |
Indonesia |
56.2 |
57.3 |
60.5 |
59.5 |
57.8 |
59.3 |
58.7 |
60.6 |
65.2 |
71.1 |
71.6 |
0.4% |
1.7% |
Japan |
246.4 |
252.1 |
245.5 |
248.8 |
239.6 |
232.6 |
226.3 |
202.2 |
204.1 |
204.7 |
218.2 |
6.3% |
5.3% |
Malaysia |
24.7 |
24.5 |
25.5 |
25.0 |
26.6 |
29.2 |
28.8 |
28.3 |
28.4 |
29.1 |
29.8 |
2.1% |
0.7% |
New Zealand |
6.5 |
6.8 |
7.0 |
7.0 |
7.1 |
7.2 |
7.2 |
6.9 |
7.0 |
7.0 |
7.0 |
-0.1% |
0.2% |
Pakistan |
17.9 |
15.8 |
16.0 |
15.3 |
17.6 |
19.3 |
19.4 |
20.8 |
20.6 |
20.8 |
20.0 |
-4.2% |
0.5% |
Philippines |
15.6 |
15.5 |
15.9 |
14.8 |
13.3 |
14.1 |
12.3 |
13.1 |
13.2 |
12.8 |
13.0 |
0.7% |
0.3% |
Singapore |
38.1 |
35.5 |
39.4 |
43.2 |
46.5 |
50.5 |
53.7 |
57.3 |
62.9 |
65.7 |
66.2 |
0.4% |
1.6% |
South Korea |
105.3 |
106.4 |
104.6 |
104.6 |
104.7 |
107.6 |
103.1 |
103.7 |
105.0 |
105.8 |
108.8 |
2.5% |
2.6% |
Taiwan |
44.9 |
46.7 |
48.9 |
49.3 |
48.6 |
50.4 |
45.1 |
44.3 |
46.3 |
42.8 |
42.2 |
-1.8% |
1.0% |
Thailand |
36.9 |
40.1 |
43.5 |
44.3 |
44.4 |
44.4 |
44.3 |
47.2 |
47.1 |
50.5 |
52.4 |
3.6% |
1.3% |
Vietnam |
9.8 |
10.5 |
12.5 |
12.2 |
12.0 |
13.3 |
14.1 |
14.1 |
15.1 |
16.5 |
16.6 |
0.7% |
0.4% |
Other Asia Pacific |
13.2 |
13.6 |
14.1 |
14.2 |
14.5 |
15.2 |
14.7 |
16.7 |
16.7 |
18.0 |
18.3 |
1.3% |
0.4% |
Total Asia Pacific |
1031.3 |
1068.7 |
1130.8 |
1146.9 |
1173.6 |
1213.3 |
1210.5 |
1219.3 |
1290.5 |
1336.6 |
1389.4 |
3.7% |
33.6% |
Total World |
3640.2 |
3719.0 |
3865.2 |
3911.6 |
3950.1 |
4009.7 |
3994.8 |
3921.6 |
4038.2 |
4081.4 |
4130.5 |
0.9% |
100.0% |
of which: OECD |
2215.1 |
2248.3 |
2290.8 |
2305.3 |
2292.0 |
2278.3 |
2210.6 |
2098.7 |
2112.6 |
2095.2 |
2072.8 |
-1.3% |
50.2% |
Non-OECD |
1425.1 |
1470.7 |
1574.4 |
1606.3 |
1658.1 |
1731.4 |
1784.2 |
1822.9 |
1925.6 |
1986.2 |
2057.7 |
3.3% |
49.8% |
European Union |
703.6 |
706.3 |
715.1 |
719.7 |
721.2 |
703.8 |
701.9 |
664.4 |
656.5 |
639.1 |
611.3 |
-4.6% |
14.8% |
Former Soviet Union |
172.7 |
181.1 |
181.7 |
180.0 |
185.5 |
187.8 |
191.2 |
181.7 |
185.2 |
199.5 |
205.9 |
2.9% |
5.0% |
*Inland demand plus international aviation and marine bunkers and refinery fuel and loss. Consumption of fuel ethanol and biodiesel is also included.Less than 0.05%.
Notes: Differences between these world consumption figures and world production statistics are accounted for by stock changes, consumption of non-petroleum additives and substitute fuels, and unavoidable disparities in the definition, measurement or conversion of oil supply and demand data.
Growth rates are adjusted for leap years.
11
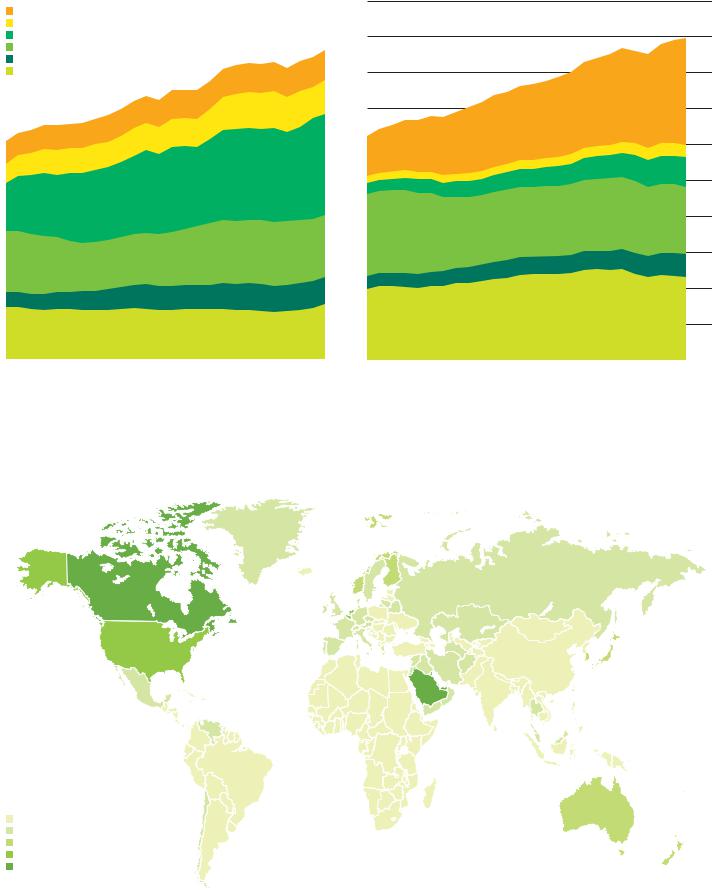
Production by region
Million barrels daily
|
Asia Pacific |
|
|
|
|
100 |
|
|
|
|
|
|
|
|
Africa |
|
|
|
|
|
|
Middle East |
|
|
|
|
|
|
|
|
|
|
90 |
|
|
Europe & Eurasia |
|
|
|
|
|
|
|
|
|
|
|
|
|
S. & Cent. America |
|
|
|
|
|
|
North America |
|
|
|
|
|
|
|
|
|
|
80 |
|
|
|
|
|
|
|
|
|
|
|
|
|
|
|
|
|
|
|
|
|
70 |
|
|
|
|
|
|
|
|
|
|
|
|
|
60 |
|
|
|
|
|
|
|
|
|
|
|
|
|
50 |
|
|
|
|
|
|
|
|
|
|
|
|
|
40 |
|
|
|
|
|
|
|
|
|
|
|
|
|
30 |
|
|
|
|
|
|
|
|
|
|
|
|
|
20 |
|
|
|
|
|
|
|
|
|
|
|
|
|
10 |
|
|
|
|
|
|
|
87 |
92 |
97 |
02 |
07 |
12 |
0 |
Consumption by region
Million barrels daily
100
90
80
70
60
50
40
30
20
10
87 |
92 |
97 |
02 |
07 |
12 |
0 |
World oil production increased by 1.9 million b/d in 2012, more than double the growth of global consumption. US output grew by 1 million b/d, the largest increase in the world and in the country’s history. The recovery in Libyan production drove robust growth in African output. Global oil consumption grew by just 890,000 b/d, with declines in Europe and North America offsetting gains elsewhere.
Consumption per capita 2012
Tonnes
0-0.75
0.75-1.5
1.5-2.25
2.25-3.0 > 3.0
12

Regional consumption by product group
|
|
|
|
|
|
|
|
|
|
|
|
Change |
2012 |
|
|
|
|
|
|
|
|
|
|
|
|
2012 over |
share |
Thousand barrels daily |
2002 |
2003 |
2004 |
2005 |
2006 |
2007 |
2008 |
2009 |
2010 |
2011 |
2012 |
2011 |
of total |
North America |
|
|
|
|
|
|
|
|
|
|
10594 |
|
|
Light distillates |
10514 |
10666 |
10978 |
11019 |
11131 |
11200 |
10859 |
10839 |
10943 |
10697 |
-1.0% |
46.0% |
|
Middle distillates |
6654 |
6860 |
7133 |
7249 |
7297 |
7318 |
6934 |
6284 |
6565 |
6694 |
6417 |
-4.1% |
27.9% |
Fuel oil |
1187 |
1253 |
1340 |
1396 |
1055 |
1081 |
941 |
799 |
764 |
745 |
635 |
-14.8% |
2.8% |
Others |
5442 |
5392 |
5572 |
5455 |
5519 |
5509 |
5126 |
5037 |
5192 |
5260 |
5394 |
2.5% |
23.4% |
Total North America |
23797 |
24170 |
25023 |
25119 |
25002 |
25109 |
23860 |
22959 |
23464 |
23397 |
23040 |
-1.5% |
100.0% |
of which: US |
|
|
|
|
|
|
|
|
|
|
8955 |
|
|
Light distillates |
9167 |
9275 |
9518 |
9548 |
9599 |
9597 |
9253 |
9257 |
9263 |
9022 |
-0.7% |
48.3% |
|
Middle distillates |
5735 |
5886 |
6116 |
6198 |
6226 |
6199 |
5801 |
5241 |
5464 |
5518 |
5281 |
-4.3% |
28.5% |
Fuel oil |
686 |
763 |
859 |
914 |
683 |
718 |
609 |
505 |
487 |
459 |
343 |
-25.3% |
1.8% |
Others |
4172 |
4109 |
4239 |
4143 |
4178 |
4166 |
3827 |
3766 |
3921 |
3951 |
3976 |
0.6% |
21.4% |
Total US |
19761 |
20033 |
20732 |
20802 |
20687 |
20680 |
19490 |
18769 |
19134 |
18949 |
18555 |
-2.1% |
100.0% |
S. & Cent. America |
|
|
|
|
|
|
|
|
|
|
1898 |
|
|
Light distillates |
1401 |
1379 |
1397 |
1462 |
1494 |
1584 |
1663 |
1765 |
1830 |
1848 |
2.7% |
29.1% |
|
Middle distillates |
1706 |
1711 |
1854 |
1866 |
1893 |
2082 |
2153 |
2126 |
2343 |
2451 |
2535 |
3.4% |
38.8% |
Fuel oil |
752 |
702 |
707 |
709 |
726 |
739 |
741 |
723 |
695 |
676 |
678 |
0.3% |
10.4% |
Others |
1146 |
1068 |
1101 |
1148 |
1218 |
1246 |
1335 |
1307 |
1354 |
1430 |
1422 |
-0.6% |
21.8% |
Total S. & Cent. America |
5004 |
4860 |
5059 |
5185 |
5332 |
5651 |
5892 |
5921 |
6222 |
6405 |
6533 |
2.0% |
100.0% |
Europe |
|
|
|
|
|
|
|
|
|
|
2976 |
|
|
Light distillates |
4125 |
4025 |
3987 |
3887 |
3756 |
3681 |
3477 |
3390 |
3350 |
3126 |
-4.8% |
21.0% |
|
Middle distillates |
6939 |
7129 |
7338 |
7527 |
7703 |
7583 |
7802 |
7531 |
7547 |
7521 |
7389 |
-1.8% |
52.2% |
Fuel oil |
1866 |
1831 |
1751 |
1746 |
1711 |
1611 |
1545 |
1379 |
1257 |
1189 |
1063 |
-10.6% |
7.5% |
Others |
3040 |
3065 |
3118 |
3184 |
3235 |
3205 |
3134 |
2960 |
2940 |
2876 |
2724 |
-5.3% |
19.2% |
Total Europe |
15970 |
16051 |
16194 |
16344 |
16406 |
16081 |
15959 |
15260 |
15094 |
14712 |
14152 |
-3.8% |
100.0% |
Former Soviet Union |
|
|
|
|
|
|
|
|
|
|
1352 |
|
|
Light distillates |
1056 |
1093 |
1095 |
1110 |
1147 |
1228 |
1283 |
1243 |
1283 |
1290 |
4.8% |
30.8% |
|
Middle distillates |
1039 |
1085 |
1113 |
1142 |
1194 |
1267 |
1336 |
1191 |
1292 |
1417 |
1453 |
2.5% |
33.1% |
Fuel oil |
635 |
598 |
535 |
515 |
567 |
459 |
427 |
399 |
388 |
401 |
418 |
4.2% |
9.5% |
Others |
863 |
1015 |
1061 |
1031 |
997 |
1027 |
1012 |
1056 |
1000 |
1154 |
1169 |
1.3% |
26.6% |
Total Former Soviet Union |
3593 |
3791 |
3805 |
3798 |
3906 |
3981 |
4059 |
3889 |
3963 |
4261 |
4391 |
3.1% |
100.0% |
Middle East |
|
|
|
|
|
|
|
|
|
|
1886 |
|
|
Light distillates |
1175 |
1242 |
1341 |
1417 |
1495 |
1516 |
1645 |
1696 |
1784 |
1825 |
3.4% |
22.6% |
|
Middle distillates |
1740 |
1800 |
1918 |
2047 |
2085 |
2195 |
2294 |
2386 |
2437 |
2533 |
2753 |
8.7% |
33.0% |
Fuel oil |
1374 |
1398 |
1432 |
1477 |
1484 |
1567 |
1721 |
1844 |
1918 |
1892 |
1916 |
1.2% |
22.9% |
Others |
1163 |
1247 |
1334 |
1393 |
1385 |
1418 |
1525 |
1600 |
1723 |
1741 |
1799 |
3.3% |
21.5% |
Total Middle East |
5452 |
5686 |
6026 |
6335 |
6449 |
6696 |
7185 |
7526 |
7861 |
7992 |
8354 |
4.5% |
100.0% |
Africa |
|
|
|
|
|
|
|
|
|
|
873 |
|
|
Light distillates |
602 |
643 |
678 |
701 |
690 |
710 |
767 |
799 |
854 |
827 |
5.7% |
24.8% |
|
Middle distillates |
1135 |
1166 |
1195 |
1248 |
1299 |
1398 |
1483 |
1509 |
1576 |
1569 |
1641 |
4.6% |
46.6% |
Fuel oil |
388 |
393 |
409 |
456 |
425 |
432 |
426 |
436 |
470 |
412 |
431 |
4.6% |
12.2% |
Others |
443 |
445 |
485 |
506 |
506 |
528 |
542 |
559 |
563 |
550 |
577 |
4.9% |
16.4% |
Total Africa |
2568 |
2646 |
2767 |
2911 |
2920 |
3068 |
3218 |
3302 |
3463 |
3359 |
3523 |
4.9% |
100.0% |
Asia Pacific |
|
|
|
|
|
|
|
|
|
|
9281 |
|
|
Light distillates |
6198 |
6446 |
6800 |
6952 |
7149 |
7539 |
7547 |
7869 |
8584 |
8888 |
4.4% |
31.2% |
|
Middle distillates |
8182 |
8352 |
8792 |
9031 |
9117 |
9272 |
9387 |
9452 |
9914 |
10300 |
10487 |
1.8% |
35.2% |
Fuel oil |
3383 |
3514 |
3536 |
3515 |
3630 |
3731 |
3612 |
3343 |
3407 |
3417 |
3633 |
6.3% |
12.2% |
Others |
4323 |
4567 |
4997 |
5037 |
5228 |
5447 |
5335 |
5542 |
5862 |
6148 |
6379 |
3.7% |
21.4% |
Total Asia Pacific |
22086 |
22880 |
24124 |
24535 |
25124 |
25989 |
25881 |
26205 |
27766 |
28754 |
29781 |
3.6% |
100.0% |
of which: China |
|
|
|
|
|
|
|
|
|
|
3182 |
|
|
Light distillates |
1359 |
1498 |
1681 |
1787 |
1900 |
2036 |
2125 |
2230 |
2726 |
2985 |
6.6% |
31.1% |
|
Middle distillates |
1785 |
1938 |
2277 |
2518 |
2713 |
2869 |
3079 |
3178 |
3430 |
3660 |
3741 |
2.2% |
36.6% |
Fuel oil |
783 |
869 |
943 |
893 |
945 |
973 |
900 |
865 |
923 |
764 |
820 |
7.4% |
8.0% |
Others |
1335 |
1467 |
1837 |
1745 |
1881 |
1946 |
1843 |
1955 |
2194 |
2341 |
2477 |
5.8% |
24.2% |
Total China |
5262 |
5771 |
6738 |
6944 |
7439 |
7823 |
7947 |
8229 |
9272 |
9750 |
10221 |
4.8% |
100.0% |
Japan |
|
|
|
|
|
|
|
|
|
|
1632 |
|
|
Light distillates |
1728 |
1755 |
1766 |
1817 |
1794 |
1770 |
1650 |
1669 |
1727 |
1659 |
-1.6% |
34.6% |
|
Middle distillates |
1944 |
1918 |
1869 |
1878 |
1760 |
1621 |
1502 |
1380 |
1391 |
1343 |
1360 |
1.3% |
28.9% |
Fuel oil |
632 |
749 |
653 |
676 |
657 |
657 |
707 |
450 |
442 |
577 |
811 |
40.7% |
17.2% |
Others |
1053 |
1039 |
1019 |
1021 |
999 |
1005 |
1024 |
931 |
913 |
887 |
911 |
2.7% |
19.3% |
Total Japan |
5357 |
5461 |
5308 |
5391 |
5210 |
5053 |
4882 |
4429 |
4473 |
4465 |
4714 |
5.6% |
100.0% |
World |
|
|
|
|
|
|
|
|
|
|
28862 |
|
|
Light distillates |
25071 |
25495 |
26275 |
26548 |
26860 |
27460 |
27241 |
27600 |
28627 |
28501 |
1.3% |
32.1% |
|
Middle distillates |
27395 |
28103 |
29343 |
30110 |
30590 |
31116 |
31389 |
30478 |
31673 |
32486 |
32675 |
0.6% |
36.4% |
Fuel oil |
9584 |
9689 |
9710 |
9815 |
9600 |
9619 |
9414 |
8924 |
8899 |
8733 |
8773 |
0.5% |
9.8% |
Others |
16421 |
16799 |
17667 |
17755 |
18089 |
18380 |
18008 |
18061 |
18634 |
19160 |
19463 |
1.6% |
21.7% |
Total World |
78470 |
80085 |
82996 |
84228 |
85138 |
86575 |
86052 |
85064 |
87833 |
88879 |
89774 |
1.0% |
100.0% |
OECD |
|
|
|
|
|
|
|
|
|
|
16890 |
|
|
Light distillates |
17621 |
17733 |
17979 |
18018 |
18008 |
18097 |
17408 |
17375 |
17547 |
17075 |
-1.1% |
37.0% |
|
Middle distillates |
16542 |
16912 |
17330 |
17669 |
17783 |
17609 |
17304 |
16228 |
16573 |
16669 |
16332 |
-2.0% |
35.8% |
Fuel oil |
4086 |
4230 |
4137 |
4201 |
3797 |
3715 |
3506 |
2907 |
2722 |
2746 |
2746 |
|
6.0% |
|
|||||||||||||
Others |
10072 |
10041 |
10241 |
10176 |
10291 |
10260 |
9851 |
9532 |
9618 |
9628 |
9620 |
-0.1% |
21.1% |
Total OECD |
48322 |
48915 |
49687 |
50064 |
49880 |
49682 |
48070 |
46042 |
46460 |
46117 |
45587 |
-1.2% |
100.0% |
Non-OECD |
|
|
|
|
|
|
|
|
|
|
11972 |
|
|
Light distillates |
7450 |
7762 |
8296 |
8530 |
8852 |
9363 |
9833 |
10225 |
11080 |
11425 |
4.8% |
27.1% |
|
Middle distillates |
10853 |
11191 |
12014 |
12441 |
12807 |
13507 |
14085 |
14250 |
15100 |
15817 |
16344 |
3.3% |
37.0% |
Fuel oil |
5498 |
5459 |
5573 |
5614 |
5802 |
5904 |
5908 |
6017 |
6177 |
5987 |
6028 |
0.7% |
13.6% |
Others |
6348 |
6758 |
7426 |
7579 |
7798 |
8120 |
8157 |
8529 |
9016 |
9532 |
9843 |
3.3% |
22.3% |
Total Non-OECD |
30149 |
31170 |
33309 |
34164 |
35259 |
36893 |
37983 |
39021 |
41373 |
42762 |
44187 |
3.3% |
100.0% |
European Union |
|
|
|
|
|
|
|
|
|
|
2776 |
|
|
Light distillates |
3869 |
3787 |
3739 |
3649 |
3511 |
3460 |
3274 |
3169 |
3128 |
2917 |
-4.8% |
21.7% |
|
Middle distillates |
6412 |
6585 |
6773 |
6942 |
7074 |
6938 |
7119 |
6853 |
6882 |
6846 |
6691 |
-2.3% |
52.3% |
Fuel oil |
1673 |
1629 |
1590 |
1591 |
1574 |
1489 |
1440 |
1279 |
1186 |
1113 |
987 |
-11.3% |
7.7% |
Others |
2755 |
2757 |
2790 |
2839 |
2864 |
2814 |
2777 |
2580 |
2545 |
2501 |
2342 |
-6.4% |
18.3% |
Total European Union |
14708 |
14759 |
14891 |
15021 |
15023 |
14700 |
14610 |
13880 |
13741 |
13377 |
12796 |
-4.3% |
100.0% |
Less than 0.05%.
Notes: Annual changes and shares of total are calculated using thousand barrels daily figures.
‘Light distillates’ consists of aviation and motor gasolines and light distillate feedstock (LDF).
‘Middle distillates’ consists of jet and heating kerosenes, and gas and diesel oils (including marine bunkers). ‘Fuel oil’ includes marine bunkers and crude oil used directly as fuel.
‘Others’ consists of refinery gas, liquefied petroleum gas (LPG), solvents, petroleum coke, lubricants, bitumen, wax, other refined products and refinery fuel and loss.
13
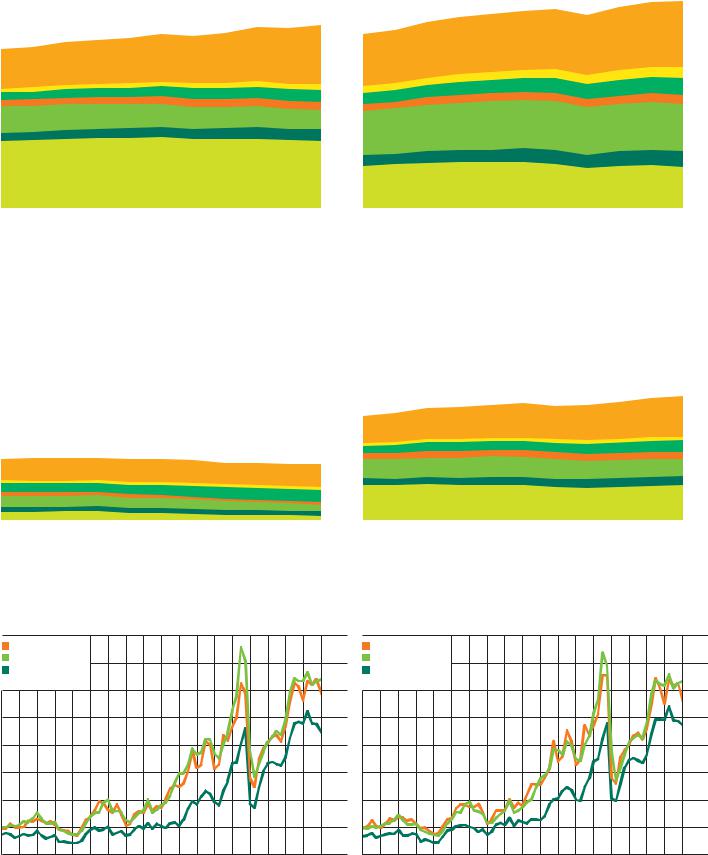
Product consumption by region
Million barrels daily
Light distillates |
|
|
|
|
|
|
|
|
|
|
|
|
Middle distillates |
|
|
|
|
|
|
|
|
|
|
|
|||||
|
|
|
|
|
|
|
|
|
|
|
|
|
|
|
|
|
|
|
|
|
|
|
|
|
|
|
|
|
|
|
|
Asia Pacific |
|
|
|
Europe |
|
|
|
|
|
35 |
|
|
|
|
|
|
|
|
|
|
|
|
35 |
||||
|
|
Africa |
|
|
|
S. & Cent. America |
|
|
|
|
|
|
|
|
|
|
|
|
|
|
|
|
|
|
|
|
|
||
|
|
|
|
|
|
|
|
|
|
|
|
|
|
|
|
|
|
|
|
|
|
|
|
|
|
||||
|
|
|
|
|
|
|
|
|
|
|
|
|
|
|
|
|
|
|
|
|
|
|
|
|
|
||||
|
|
Middle East |
|
|
|
North America |
|
|
|
|
|
|
|
|
|
|
|
|
|
|
|
|
|
|
|
|
|
||
|
|
|
|
|
|
|
|
|
30 |
|
|
|
|
|
|
|
|
|
|
|
|
|
30 |
|
|
||||
|
|
|
|
|
|
|
|
|
|
|
|
|
|
|
|
|
|
|
|
|
|
|
|
||||||
|
|
Former Soviet Union |
|
|
|
|
|
|
|
|
|
|
|
|
|
|
|
|
|
|
|
|
|
|
|
|
|
||
|
|
|
|
|
|
|
|
|
|
|
|
|
|
|
|
|
|
|
|
|
|
|
|
|
|
|
|||
|
|
|
|
|
|
|
|
|
|
|
|
|
|
|
|
|
|
|
|
|
|
|
|
|
|
|
|||
|
|
|
|
|
|
|
|
|
|
|
|
|
|
|
|
|
|
|
|
|
|
|
|
|
|
|
|
|
|
|
|
|
|
|
|
|
|
|
|
|
|
|
25 |
|
|
|
|
|
|
|
|
|
|
|
|
|
25 |
|
|
|
|
|
|
|
|
|
|
|
|
|
|
|
|
|
|
|
|
|
|
|
|
|
|
|
|
|
|
|
|
|
|
|
|
|
|
|
|
|
|
|
|
|
20 |
|
|
|
|
|
|
|
|
|
|
|
20 |
||||
|
|
|
|
|
|
|
|
|
|
|
|
|
|
|
|
|
|
|
|
|
|
|
|
|
|
|
|
|
|
|
|
|
|
|
|
|
|
|
|
|
|
|
15 |
|
|
|
|
|
|
|
|
|
|
|
15 |
||||
|
|
|
|
|
|
|
|
|
|
|
|
|
|
|
|
|
|
|
|
|
|
|
|
|
|
|
|
|
|
|
|
|
|
|
|
|
|
|
|
|
|
|
10 |
|
|
|
|
|
|
|
|
|
|
|
|
10 |
|||
|
|
|
|
|
|
|
|
|
|
|
|
|
|
|
|
|
|
|
|
|
|
|
|
|
|
|
|
|
|
|
|
|
|
|
|
|
|
|
|
|
|
|
5 |
|
|
|
|
|
|
|
|
|
|
|
|
|
5 |
||
|
|
|
|
|
|
|
|
|
|
|
|
|
|
|
|
|
|
|
|
|
|
|
|
|
|
|
|
|
|
02 |
03 |
04 |
05 |
06 |
07 |
08 |
09 |
10 |
11 |
12 |
0 |
|
02 |
03 |
04 |
05 |
06 |
07 |
08 |
09 |
10 |
11 |
12 |
0 |
|
||||
Fuel oil |
|
|
|
|
|
|
|
|
|
|
|
|
Others |
|
|
|
|
|
|
|
|
|
|
|
|
|
||
|
|
|
|
|
|
|
|
|
|
|
|
|
|
|
|
|
|
|
|
|
|
|
|
|
|
|
|
|
|
|
|
|
|
|
|
|
|
|
|
35 |
|
|
|
|
|
|
|
|
|
|
|
|
|
35 |
|||
|
|
|
|
|
|
|
|
|
|
|
|
|
|
|
|
|
|
|
|
|
|
|
|
|
|
|||
|
|
|
|
|
|
|
|
|
|
|
30 |
|
|
|
|
|
|
|
|
|
|
|
|
30 |
||||
|
|
|
|
|
|
|
|
|
|
|
|
|
|
|
|
|
|
|
|
|
|
|
|
|
||||
|
|
|
|
|
|
|
|
|
|
|
25 |
|
|
|
|
|
|
|
|
|
|
|
|
25 |
|
|||
|
|
|
|
|
|
|
|
|
|
|
|
|
|
|
|
|
|
|
|
|
|
|
|
|
|
|
|
|
|
|
|
|
|
|
|
|
|
|
|
20 |
|
|
|
|
|
|
|
|
|
|
|
|
20 |
||||
|
|
|
|
|
|
|
|
|
|
|
|
|
|
|
|
|
|
|
|
|
|
|
|
|
|
|
|
|
|
|
|
|
|
|
|
|
|
|
|
15 |
|
|
|
|
|
|
|
|
|
|
|
|
15 |
||||
|
|
|
|
|
|
|
|
|
|
|
|
|
|
|
|
|
|
|
|
|
|
|
|
|
|
|||
|
|
|
|
|
|
|
|
|
|
|
10 |
|
|
|
|
|
|
|
|
|
|
|
|
10 |
||||
|
|
|
|
|
|
|
|
|
|
|
|
|
|
|
|
|
|
|
|
|
|
|
|
|
||||
|
|
|
|
|
|
|
|
|
|
|
5 |
|
|
|
|
|
|
|
|
|
|
|
|
5 |
|
|||
|
|
|
|
|
|
|
|
|
|
|
|
|
|
|
|
|
|
|
|
|
|
|
|
|
|
|
|
|
02 |
03 |
04 |
05 |
06 |
07 |
08 |
09 |
10 |
11 |
12 |
0 |
02 |
03 |
04 |
05 |
06 |
07 |
08 |
09 |
10 |
11 |
12 |
0 |
|||||
Rotterdam product prices |
US Gulf Coast product prices |
US dollars per barrel |
US dollars per barrel |
Gasoline |
|
|
|
|
|
|
|
|
|
|
|
|
|
|
|
160 |
||
|
|
|
|
|
|
|
|
|
|
|
|
|
|
|
|
|||
Gas oil |
|
|
|
|
|
|
|
|
|
|
|
|
|
|
|
|
|
|
Heavy fuel oil |
|
|
|
|
|
|
|
|
|
|
|
|
|
|
140 |
|||
|
|
|
|
|
|
|
|
|
|
|
|
|
|
|
|
|
|
120 |
|
|
|
|
|
|
|
|
|
|
|
|
|
|
|
|
|
|
100 |
|
|
|
|
|
|
|
|
|
|
|
|
|
|
|
|
|
|
80 |
|
|
|
|
|
|
|
|
|
|
|
|
|
|
|
|
|
|
60 |
|
|
|
|
|
|
|
|
|
|
|
|
|
|
|
|
|
|
40 |
|
|
|
|
|
|
|
|
|
|
|
|
|
|
|
|
|
|
20 |
95 |
96 |
97 |
98 |
99 |
00 |
01 |
02 |
03 |
04 |
05 |
06 |
07 |
08 |
09 |
10 |
11 |
12 |
0 |
Source: Platts.
14
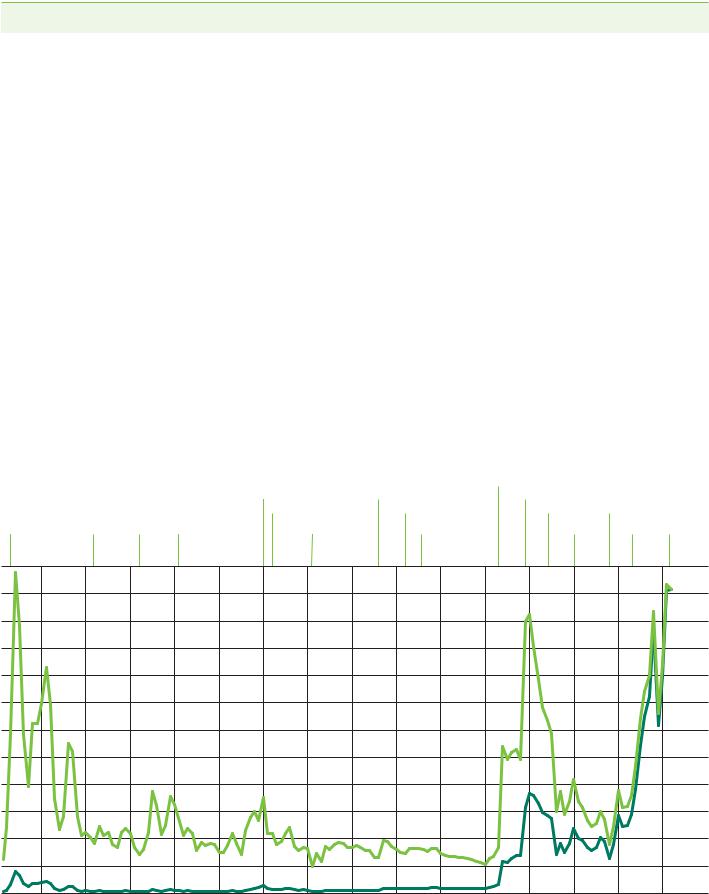
Spot crude prices
|
|
|
|
Nigerian |
West Texas |
|
|
Dubai |
Brent |
Forcados |
Intermediate |
|
US dollars per barrel |
$/bbl* |
$/bbl† |
$/bbl |
$/bbl‡ |
1975 |
10.70 |
– |
– |
– |
|
1976 |
11.63 |
12.80 |
12.87 |
12.23 |
|
1977 |
12.38 |
13.92 |
14.21 |
14.22 |
|
1978 |
13.03 |
14.02 |
13.65 |
14.55 |
|
1979 |
29.75 |
31.61 |
29.25 |
25.08 |
|
1980 |
35.69 |
36.83 |
36.98 |
37.96 |
|
1981 |
34.32 |
35.93 |
36.18 |
36.08 |
|
1982 |
31.80 |
32.97 |
33.29 |
33.65 |
|
1983 |
28.78 |
29.55 |
29.54 |
30.30 |
|
1984 |
28.06 |
28.78 |
28.14 |
29.39 |
|
1985 |
27.53 |
27.56 |
27.75 |
27.98 |
|
1986 |
13.10 |
14.43 |
14.46 |
15.10 |
|
1987 |
16.95 |
18.44 |
18.39 |
19.18 |
|
1988 |
13.27 |
14.92 |
15.00 |
15.97 |
|
1989 |
15.62 |
18.23 |
18.30 |
19.68 |
|
1990 |
20.45 |
23.73 |
23.85 |
24.50 |
|
1991 |
16.63 |
20.00 |
20.11 |
21.54 |
|
1992 |
17.17 |
19.32 |
19.61 |
20.57 |
|
1993 |
14.93 |
16.97 |
17.41 |
18.45 |
|
1994 |
14.74 |
15.82 |
16.25 |
17.21 |
|
1995 |
16.10 |
17.02 |
17.26 |
18.42 |
|
1996 |
18.52 |
20.67 |
21.16 |
22.16 |
|
1997 |
18.23 |
19.09 |
19.33 |
20.61 |
|
1998 |
12.21 |
12.72 |
12.62 |
14.39 |
|
1999 |
17.25 |
17.97 |
18.00 |
19.31 |
|
2000 |
26.20 |
28.50 |
28.42 |
30.37 |
|
2001 |
22.81 |
24.44 |
24.23 |
25.93 |
|
2002 |
23.74 |
25.02 |
25.04 |
26.16 |
|
2003 |
26.78 |
28.83 |
28.66 |
31.07 |
|
2004 |
33.64 |
38.27 |
38.13 |
41.49 |
|
2005 |
49.35 |
54.52 |
55.69 |
56.59 |
|
2006 |
61.50 |
65.14 |
67.07 |
66.02 |
|
2007 |
68.19 |
72.39 |
74.48 |
72.20 |
|
2008 |
94.34 |
97.26 |
101.43 |
100.06 |
|
2009 |
61.39 |
61.67 |
63.35 |
61.92 |
|
2010 |
78.06 |
79.50 |
81.05 |
79.45 |
|
2011 |
106.18 |
111.26 |
113.65 |
95.04 |
|
|
2012 |
109.08 |
111.67 |
114.21 |
94.13 |
*1975-1985 Arabian Light, 1986-2012 Dubai dated. |
|
|
|
Source: Platts. |
|
†1976-1983 Forties, 1984-2012 Brent dated. |
|
|
|
|
|
‡1976-1983 Posted WTI prices, 1984-2012 Spot WTI (Cushing) prices. |
|
|
|
|
|
Crude oil prices 1861-2012
US dollars per barrel
World events
|
|
Yom Kippur war |
Fears of shortage in US |
Post-war reconstruction |
Iranian revolution |
Growth of Venezuelan |
Loss of Iranian |
Netback pricing Asian financial crisis |
production |
supplies |
introduced |
Pennsylvanian |
Russian |
Sumatra |
Discovery of |
|
|
East Texas field |
Suez crisis |
|
|
Iraq |
Invasion |
‘Arab |
|
|||
oil boom |
|
oil exports |
production |
Spindletop, |
|
|
discovered |
|
|
|
|
|
invaded |
of Iraq |
Spring’ |
|
|
|
began |
began |
Texas |
|
|
|
|
|
|
|
|
Kuwait |
|
|
|
|
|
|
|
|
|
|
|
|
|
|
|
|
|
|
|
120 |
|
|
|
|
|
|
|
|
|
|
|
|
|
|
|
|
110 |
|
|
|
|
|
|
|
|
|
|
|
|
|
|
|
|
100 |
|
|
|
|
|
|
|
|
|
|
|
|
|
|
|
|
90 |
|
|
|
|
|
|
|
|
|
|
|
|
|
|
|
|
80 |
|
|
|
|
|
|
|
|
|
|
|
|
|
|
|
|
70 |
|
|
|
|
|
|
|
|
|
|
|
|
|
|
|
|
60 |
|
|
|
|
|
|
|
|
|
|
|
|
|
|
|
|
50 |
|
|
|
|
|
|
|
|
|
|
|
|
|
|
|
|
40 |
|
|
|
|
|
|
|
|
|
|
|
|
|
|
|
|
30 |
|
|
|
|
|
|
|
|
|
|
|
|
|
|
|
|
20 |
|
|
|
|
|
|
|
|
|
|
|
|
|
|
|
|
10 |
1861-69 |
1870-79 |
1880-89 |
1890-99 |
1900-09 |
1910-19 |
1920-29 |
1930-39 |
1940-49 |
1950-59 |
1960-69 |
1970-79 |
1980-89 |
1990-99 |
2000-09 |
2010-19 |
0 |
|
$ 2012 |
1861-1944 US average. |
|
||
|
||
|
$ money of the day |
1945-1983 Arabian Light posted at Ras Tanura. |
|
||
|
|
1984-2012 Brent dated. |
15

Refinery capacities
|
|
|
|
|
|
|
|
|
|
|
|
Change |
2012 |
|
|
|
|
|
|
|
|
|
|
|
|
2012 over |
share |
Thousand barrels daily* |
2002 |
2003 |
2004 |
2005 |
2006 |
2007 |
2008 |
2009 |
2010 |
2011 |
2012 |
2011 |
of total |
US |
16757 |
16894 |
17125 |
17339 |
17443 |
17594 |
17672 |
17584 |
17736 |
17322 |
17388 |
0.4% |
18.8% |
Canada |
1923 |
1959 |
1915 |
1896 |
1914 |
1907 |
1951 |
1976 |
1951 |
2046 |
2063 |
0.8% |
2.2% |
Mexico |
1463 |
1463 |
1463 |
1463 |
1463 |
1463 |
1463 |
1463 |
1463 |
1606 |
1606 |
– |
1.7% |
Total North America |
20143 |
20316 |
20503 |
20698 |
20821 |
20964 |
21086 |
21023 |
21151 |
20974 |
21057 |
0.4% |
22.8% |
Argentina |
619 |
620 |
623 |
627 |
623 |
634 |
634 |
636 |
640 |
649 |
654 |
0.8% |
0.7% |
Brazil |
1854 |
1915 |
1915 |
1916 |
1916 |
1935 |
2045 |
2093 |
2093 |
2010 |
2000 |
-0.5% |
2.2% |
Netherlands Antilles |
320 |
320 |
320 |
320 |
320 |
320 |
320 |
320 |
320 |
320 |
320 |
– |
0.3% |
Venezuela |
1269 |
1269 |
1284 |
1291 |
1294 |
1303 |
1303 |
1303 |
1303 |
1303 |
1303 |
– |
1.4% |
Other S. & Cent. America |
2234 |
2229 |
2235 |
2251 |
2260 |
2310 |
2356 |
2326 |
2295 |
2201 |
1635 |
-25.7% |
1.8% |
Total S. & Cent. America |
6296 |
6353 |
6377 |
6405 |
6413 |
6502 |
6658 |
6678 |
6651 |
6483 |
5912 |
-8.8% |
6.4% |
Belgium |
803 |
805 |
782 |
778 |
774 |
745 |
745 |
823 |
813 |
823 |
792 |
-3.8% |
0.9% |
France |
1987 |
1967 |
1982 |
1978 |
1959 |
1962 |
1971 |
1873 |
1702 |
1610 |
1478 |
-8.2% |
1.6% |
Germany |
2286 |
2304 |
2320 |
2322 |
2390 |
2390 |
2366 |
2362 |
2091 |
2077 |
2097 |
0.9% |
2.3% |
Greece |
412 |
412 |
412 |
418 |
425 |
425 |
425 |
425 |
440 |
495 |
498 |
0.6% |
0.5% |
Italy |
2485 |
2485 |
2497 |
2515 |
2526 |
2497 |
2396 |
2396 |
2396 |
2311 |
2200 |
-4.8% |
2.4% |
Netherlands |
1282 |
1282 |
1284 |
1274 |
1274 |
1236 |
1280 |
1280 |
1274 |
1276 |
1274 |
-0.1% |
1.4% |
Norway |
310 |
310 |
310 |
310 |
310 |
310 |
310 |
310 |
310 |
310 |
310 |
– |
0.3% |
Russian Federation |
5466 |
5340 |
5343 |
5405 |
5488 |
5501 |
5422 |
5401 |
5508 |
5569 |
5754 |
3.3% |
6.2% |
Spain |
1330 |
1347 |
1372 |
1377 |
1362 |
1362 |
1362 |
1362 |
1416 |
1416 |
1537 |
8.5% |
1.7% |
Sweden |
422 |
422 |
422 |
422 |
422 |
422 |
422 |
422 |
422 |
434 |
434 |
– |
0.5% |
Turkey |
713 |
713 |
693 |
613 |
613 |
613 |
613 |
613 |
613 |
613 |
613 |
– |
0.7% |
United Kingdom |
1785 |
1813 |
1848 |
1819 |
1836 |
1819 |
1827 |
1757 |
1757 |
1787 |
1631 |
-8.8% |
1.8% |
Other Europe & Eurasia |
5706 |
5623 |
5599 |
5562 |
5450 |
5487 |
5473 |
5515 |
5629 |
5536 |
5248 |
-5.2% |
5.7% |
Total Europe & Eurasia |
24987 |
24823 |
24864 |
24794 |
24828 |
24770 |
24612 |
24538 |
24372 |
24259 |
23865 |
-1.6% |
25.8% |
Iran |
1597 |
1607 |
1642 |
1642 |
1727 |
1772 |
1805 |
1860 |
1860 |
1860 |
1892 |
1.7% |
2.0% |
Iraq |
750 |
750 |
750 |
753 |
758 |
765 |
754 |
786 |
907 |
996 |
1042 |
4.6% |
1.1% |
Kuwait |
814 |
914 |
936 |
936 |
936 |
936 |
936 |
936 |
936 |
936 |
936 |
– |
1.0% |
Saudi Arabia |
1814 |
1894 |
2079 |
2107 |
2107 |
2107 |
2107 |
2107 |
2107 |
2117 |
2122 |
0.2% |
2.3% |
United Arab Emirates |
711 |
645 |
620 |
620 |
620 |
625 |
680 |
700 |
700 |
705 |
710 |
0.7% |
0.8% |
Other Middle East |
1248 |
1248 |
1248 |
1248 |
1298 |
1381 |
1390 |
1536 |
1541 |
1553 |
1553 |
– |
1.7% |
Total Middle East |
6934 |
7058 |
7275 |
7306 |
7446 |
7586 |
7672 |
7925 |
8051 |
8167 |
8255 |
1.1% |
8.9% |
Total Africa |
3189 |
3138 |
3051 |
3138 |
2990 |
3007 |
3121 |
2982 |
3175 |
3123 |
3323 |
6.4% |
3.6% |
Australia |
829 |
756 |
763 |
711 |
694 |
733 |
734 |
734 |
740 |
742 |
663 |
-10.6% |
0.7% |
China |
5933 |
6295 |
6603 |
7165 |
7865 |
8399 |
8722 |
9479 |
10302 |
10834 |
11547 |
6.6% |
12.5% |
India |
2303 |
2293 |
2558 |
2558 |
2872 |
2983 |
2992 |
3574 |
3703 |
3795 |
4099 |
8.0% |
4.4% |
Indonesia |
1092 |
1057 |
1057 |
1057 |
1127 |
1150 |
1052 |
1085 |
1139 |
1141 |
1142 |
0.1% |
1.2% |
Japan |
4728 |
4645 |
4531 |
4531 |
4588 |
4650 |
4650 |
4630 |
4291 |
4274 |
4254 |
-0.5% |
4.6% |
Singapore |
1255 |
1255 |
1255 |
1255 |
1255 |
1255 |
1385 |
1385 |
1385 |
1395 |
1395 |
– |
1.5% |
South Korea |
2598 |
2598 |
2598 |
2598 |
2633 |
2671 |
2712 |
2712 |
2712 |
2860 |
2887 |
1.0% |
3.1% |
Taiwan |
1159 |
1159 |
1159 |
1159 |
1140 |
1197 |
1197 |
1197 |
1197 |
1197 |
1197 |
– |
1.3% |
Thailand |
1068 |
1068 |
1068 |
1078 |
1125 |
1125 |
1195 |
1255 |
1260 |
1260 |
1260 |
– |
1.4% |
Other Asia Pacific |
1487 |
1416 |
1410 |
1439 |
1448 |
1460 |
1472 |
1621 |
1654 |
1673 |
1676 |
0.2% |
1.8% |
Total Asia Pacific |
22451 |
22541 |
23001 |
23551 |
24747 |
25623 |
26111 |
27671 |
28383 |
29170 |
30119 |
3.3% |
32.6% |
Total World |
83998 |
84228 |
85072 |
85892 |
87245 |
88451 |
89259 |
90817 |
91782 |
92176 |
92531 |
0.4% |
100.0% |
of which: OECD |
44907 |
44986 |
45133 |
45204 |
45453 |
45673 |
45774 |
45628 |
45109 |
45007 |
44686 |
-0.7% |
48.3% |
Non-OECD |
39091 |
39242 |
39939 |
40688 |
41792 |
42778 |
43485 |
45189 |
46673 |
47168 |
47845 |
1.4% |
51.7% |
European Union |
15701 |
15739 |
15813 |
15821 |
15851 |
15779 |
15653 |
15552 |
15253 |
15171 |
14797 |
-2.5% |
16.0% |
Former Soviet Union |
7951 |
7745 |
7728 |
7730 |
7753 |
7767 |
7738 |
7743 |
7876 |
7843 |
7853 |
0.1% |
8.5% |
*Atmospheric distillation capacity on a calendar-day basis.
Note: Annual changes and shares of total are calculated using thousand barrels daily figures.
Source: Includes data from ICIS Parpinelli Tecnon.
Refinery throughputs
|
|
|
|
|
|
|
|
|
|
|
|
Change |
2012 |
|
|
|
|
|
|
|
|
|
|
|
|
2012 over |
share |
Thousand barrels daily* |
2002 |
2003 |
2004 |
2005 |
2006 |
2007 |
2008 |
2009 |
2010 |
2011 |
2012 |
2011 |
of total |
US |
14947 |
15304 |
15475 |
15220 |
15242 |
15156 |
14648 |
14336 |
14724 |
14806 |
15006 |
1.4% |
19.7% |
Canada |
1862 |
1880 |
1957 |
1883 |
1835 |
1908 |
1839 |
1773 |
1832 |
1734 |
1796 |
3.6% |
2.4% |
Mexico |
1390 |
1436 |
1436 |
1415 |
1407 |
1395 |
1392 |
1392 |
1184 |
1166 |
1199 |
2.8% |
1.6% |
S. & Cent. America |
4918 |
5009 |
5401 |
5378 |
5334 |
5456 |
5363 |
4889 |
4834 |
5047 |
4624 |
-8.4% |
6.1% |
Europe & Eurasia |
19431 |
19920 |
20371 |
20736 |
20783 |
20716 |
20635 |
19509 |
19595 |
19507 |
19459 |
-0.2% |
25.5% |
Middle East |
5484 |
5602 |
5796 |
6008 |
6300 |
6397 |
6396 |
6297 |
6396 |
6519 |
6444 |
-1.1% |
8.5% |
Africa |
2377 |
2301 |
2304 |
2491 |
2372 |
2372 |
2456 |
2293 |
2449 |
2149 |
2201 |
2.4% |
2.9% |
Australasia |
855 |
823 |
820 |
757 |
749 |
767 |
756 |
762 |
756 |
789 |
779 |
-1.2% |
1.0% |
China |
4395 |
4823 |
5382 |
5916 |
6155 |
6563 |
6953 |
7488 |
8571 |
9059 |
9371 |
3.4% |
12.3% |
India |
2212 |
2380 |
2559 |
2561 |
2860 |
3107 |
3213 |
3641 |
3899 |
4085 |
4302 |
5.3% |
5.6% |
Japan |
3986 |
4118 |
4038 |
4136 |
4026 |
3995 |
3946 |
3627 |
3619 |
3410 |
3400 |
-0.3% |
4.5% |
Other Asia Pacific |
6638 |
6886 |
7355 |
7474 |
7469 |
7493 |
7351 |
7229 |
7434 |
7486 |
7652 |
2.2% |
10.0% |
Total World |
68496 |
70482 |
72893 |
73976 |
74533 |
75325 |
74949 |
73234 |
75293 |
75757 |
76233 |
0.6% |
100.0% |
of which: OECD |
39017 |
39814 |
40368 |
40166 |
39980 |
39720 |
38791 |
36975 |
37242 |
36926 |
37087 |
0.4% |
48.6% |
Non-OECD |
29479 |
30667 |
32526 |
33809 |
34553 |
35605 |
36159 |
36260 |
38051 |
38831 |
39146 |
0.8% |
51.4% |
European Union |
13443 |
13687 |
14029 |
14105 |
13945 |
13705 |
13595 |
12586 |
12514 |
12206 |
12049 |
-1.3% |
15.8% |
Former Soviet Union |
5060 |
5276 |
5417 |
5713 |
5873 |
6017 |
6188 |
6170 |
6367 |
6565 |
6665 |
1.5% |
8.7% |
*Input to primary distillation units only.
Note: Annual changes and shares of total are calculated using thousand barrels daily figures.
Source: Includes data from Energy Security Analysis, Inc. (ESAI).
16
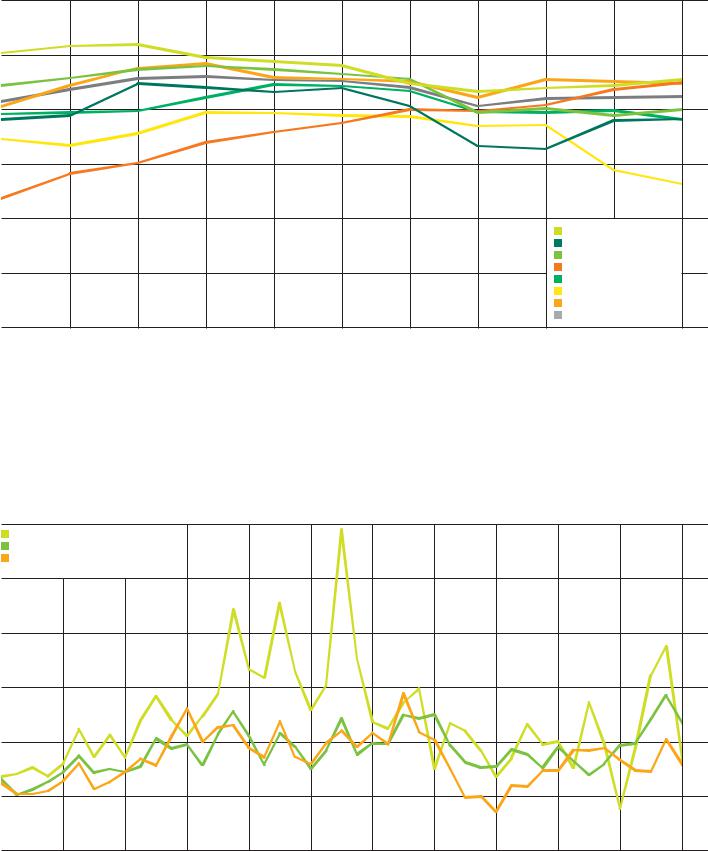
Refinery utilization
Percentage |
|
|
|
|
|
|
|
|
|
|
|
|
|
|
|
|
|
|
|
|
|
|
100 |
|
|
|
|
|
|
|
|
|
|
|
90 |
|
|
|
|
|
|
|
|
|
|
|
80 |
|
|
|
|
|
|
|
|
|
|
|
70 |
|
|
|
|
|
|
|
|
|
North America |
|
60 |
|
|
|
|
|
|
|
|
|
|
|
|
|
|
|
|
|
|
|
|
|
S. & Cent. America |
|
|
|
|
|
|
|
|
|
|
|
Europe |
|
|
|
|
|
|
|
|
|
|
|
Former Soviet Union |
|
|
|
|
|
|
|
|
|
|
|
Middle East |
|
50 |
|
|
|
|
|
|
|
|
|
Africa |
|
|
|
|
|
|
|
|
|
|
|
Asia Pacific |
|
|
|
|
|
|
|
|
|
|
|
World |
|
|
02 |
03 |
04 |
05 |
06 |
07 |
08 |
09 |
10 |
11 |
12 |
40 |
Global crude runs grew by 0.5 million b/d in 2012, with increases in China, India and the US more than offsetting declines in Europe and South & Central America. Global refining capacity growth of a net 0.4 million b/d masks large additions in Asia Pacific and significant capacity reductions in Europe and the Caribbean. Global average refinery utilization improved marginally to 82.4%, the highest since 2008.
Regional refining margins
US dollars per barrel
USGC Heavy Sour Coking |
|
|
|
|
|
|
|
|
|
25 |
|
NWE Light Sweet Cracking |
|
|
|
|
|
|
|
|
|
|
|
Singapore Medium Sour Hydrocracking |
|
|
|
|
|
|
|
|
|
||
|
|
|
|
|
|
|
|
|
|
|
20 |
|
|
|
|
|
|
|
|
|
|
|
15 |
|
|
|
|
|
|
|
|
|
|
|
10 |
|
|
|
|
|
|
|
|
|
|
|
5 |
|
|
|
|
|
|
|
|
|
|
|
0 |
02 |
03 |
04 |
05 |
06 |
07 |
08 |
09 |
10 |
11 |
12 |
-5 |
Note: The refining margins presented are benchmark margins for three major global refining centres: US Gulf Coast (USGC), North West Europe (NWE – Rotterdam) and Singapore. In each case they are based on a single crude oil appropriate for that region and have optimized product yields based on a generic refinery configuration
(cracking, hydrocracking or coking), again appropriate for that region. The margins are on a semi-variable basis, i.e. the margin after all variable costs and fixed energy costs.
17