

823
.pdfТаблица 3
Влияние удобрений и сорта на посевные качества и период послеуборочного дозревания семян ячменя, 2008 - 2010 гг.
|
|
|
|
Энергия |
|
Лабораторная |
Продолжительность |
||||||
Фон удоб- |
|
Сорт |
|
|
послеуборочного |
||||||||
|
прорастания, % |
всхожесть, % |
|||||||||||
|
дозревания, дней |
||||||||||||
рения (А) |
|
(В) |
|||||||||||
|
|
|
|
|
|
|
|
|
|||||
|
|
|
|
|
|
|
|
|
|
|
|
||
|
|
|
|
|
|
|
|
|
|
|
|
|
|
|
|
|
2008 |
|
2009 |
|
2010 |
2008 |
2009 |
2010 |
2008 |
2009 |
2010 |
|
|
|
|
|
|
|
|
|
|
|
|
|
|
без |
|
Эколог |
83 |
|
74 |
|
84 |
96 |
95 |
96 |
45 |
26 |
7 |
|
|
|
|
|
|
|
|
|
|
|
|
|
|
удобрений |
|
Гонар |
77 |
|
63 |
|
89 |
97 |
95 |
93 |
35 |
28 |
9 |
|
|
|
|
||||||||||
|
|
|
|
|
|
|
|
|
|
|
|
|
|
NРК |
|
Эколог |
81 |
|
66 |
|
87 |
95 |
95 |
95 |
31 |
23 |
6 |
|
|
|
|
|
|
|
|
|
|
|
|
|
|
|
Гонар |
80 |
|
63 |
|
88 |
96 |
92 |
97 |
34 |
24 |
9 |
|
|
|
|
|
||||||||||
|
|
|
|
|
|
|
|
|
|
|
|
|
|
Среднее по В1 |
|
82 |
|
70 |
|
86 |
96 |
95 |
96 |
40 |
25 |
7 |
|
|
|
|
|
|
|
|
|
|
|
|
|
|
|
Среднее по В2 |
|
78 |
|
63 |
|
89 |
97 |
93 |
95 |
34 |
26 |
9 |
|
|
|
|
|
|
|
|
|
|
|
|
|
|
|
После прохождения послеуборочного дозревания видно, что семена ячменя имеют высокую лабораторную всхожесть от 92 до 97% и различий по вариантам не выявлено. Также семена имеют и высокую энергию прорастания, однако на этот показатель оказывают влияние погодные условия. Так в менее благоприятный год (2009 г.) данный показатель ниже по сравнению с показателем семян полученных в 2008 и 2010 годы. Небольшие дозы удобрений на лабораторную всхожесть семян ячменя существенного влияния не оказывают.
Выводы. Таким образом, из результатов проведенных исследований следует, что на дерново-подзолистой среднеокультуренной почве при низких дозах удобрений и нормальных условиях увлажнения урожайность ячменя может достигать 3 – 4,5 т/га, что на 1,04 – 1,83 т/га больше, чем в годы с недостаточным количеством осадков в период закладки генеративных органов. В среднем за три года исследований урожайность обоих сортов на фоне удобрений была выше. Сорт Гонар урожайней сорта Эколог в среднем на 0,16 т/га.
Независимо от фона минерального питания в годы исследований сорта ячменя формировали семена, которые соответствуют требованиям посевного стандарта. Период послеуборочного дозревания семян сортов ячменя продолжается от 7 до 45 дней, и зависит от погодных условий в период созревания семян на материнском растении.
Литература Посевные площади и валовые сборы сельскохозяйственных культур по категори-
ям хозяйства в Пермском крае в 2011 году. Статистический бюллетень. Пермьстат, -
Пермь, 2012. – 322 с.
151
UDC 635.649:631.67:635.044
Demet Yıldırım1, Bilal Cemek2
1Black Sea Agricultural Research Institute, Samsun, Turkey
2 Ondokuz Mayıs University, Faculty of Agriculture,
Department of Agricultural Structures and Irrigation, Samsun, Turkey
EFFECTS OF DIFFERENT IRRIGATION TREATMENTS ON GROWTH, YIELD
AND QUALITY PARAMETERS OF PEPPER
UNDER GREENHOUSE CONDITIONS
Present study was conducted to determine the effects of full and deficit irrigation treatments on growth, yield and quality parameters of pepper under greenhouse conditions. Four different irrigation treatments (S1, irrigation until field capacity; S2, 70% irrigation; S3, 40% irrigation; S4, non-irrigated) were used in experiments. Plant height, net assimilation ratio, relative growth rate, leaf area index (LAI) were analyzed as growth parameters and fruit acidity (%), water soluble dry matter (WSDM) content (%) were analyzed as yield-water relationship parameters. The highest LAI value was obtained from S1 (5.8) and the lowest value was obtained from S4 (1.8) treatment. Significant variations were observed in plant growth parameters with the amount of applied irrigation water and plant water consumptions. The highest pepper yield (3077.1kg da-1) was obtained from S1 treatments and it was respectively followed by S2(2532.5 kg da- 1), S3(2329.5 kg da-1) andS4(1466.6 kg da-1)treatments.A high level relationship (R2 0.901) was observed between the yield and plant water consumption. Variations were also observed in fruit quality parameters of different irrigation treatments applied during the plant growth season. Acidity and WSDM content respectively varied between 0.231-0.171% and 3.5-4.6% and such differences between irrigation treatments were found to be significant (P<0.05).
Key words: Water deficit, Greenhouse, Growth, Yield, Quality, Pepper.
Introduction. Pepper is cultivated over more than 3 million hectare worldwide and annual production was 28 million tons in the year 2009. China is the greatest producer with 14.5 million ton, Mexico is the second (1.9 million tons) and Turkey is the third (1.8 million tons) country in world pepper production. Turkey meets almost 6% of world fresh pepper production [10]. Compared to other plants, pepper is a hydrophilic plant and has an annual water consumption of 600-700 mm.Under deficit water resources, it is possible to grow pepper with deficit irrigation without significant yield losses. Therefore, water-yield relationships, yields under full and deficit irrigation conditions should be investigated to be sure about possible use of deficit irrigation in pepper culture. Such investigations should provide optimum conditions for irrigation planners and producers and also provide deficit irrigation programs optimizing water use and minimizing the yield losses.
Irrigation planning is needed when the soil water deficit goes below a threshold value for certain plant and soil conditions.Such plans either allow efficient water use in early stages or prevent water stress in later stages [15]. Several researchers performed greenhouse experiments to investigate the effects of different irrigation levels on plant growth and yield.Water-yield relationships under different irrigation levels were inves-
152

tigated by Mao et al.(2003) andCemeket al. (2005) in cucumber, by Kırnaket al. (2004) in tomato, by Yuan et al. (2003) in strawberry. Demirtaşand Ayaş (2009) evaluated wa- ter-yield relationships of pepper with different irrigation water levels under greenhouse conditions. Kurunçet al. (2011) also investigated water-yield relationships of pepper under greenhouse conditions with four different irrigation levels and six different irrigation water salinity levels. Aladenola andMadramootoo (2012) investigated the effects of different irrigation water levels on yield and water stress threshold value of long green pepper under greenhouse condition and pointed out the significance of proper irrigation timing for optimum yields.
Efficient water-use and water saving technologies without a negative impact on plant production should be provided for a sustainable agriculture. In greenhouse production activities, new and modern irrigation techniques have been developed for efficient water-use and optimum yields.Efficient water-use may require the investigation of deficit irrigation practices and water saving technologies [16].Deficit irrigation is especially avodied during the sensitive phonological stages, flowering and fruit setting periods of peppers.
The present study was conducted under greenhouse conditions to investigate the water-yield relationships in pepper and to determine the effects of different irrigation levels on plant growth, yield and quality parameters. Plant height, leaf area index (LAI),leaf area ratio (LAR), specific leaf area (SLA), leaf weight ratio (LWR), stem weight ratio (RWR), root weight ratio (RWR), net assimilation rate (NAR), relative growth rate (RGR) and leaf thickness (LT) were investigated as plant growth parameters;fruit weight was investigated as yield parameters; fruit acidity (%) and water soluble dry matter content (%)were investigated as fruit quality parameters.
Materialsandmethods. Experiments were conducted under greenhouse conditions at Samsun OndokuzMayısUniversity (410 21‘47.3‘‘ Nlatitudes, 36011‘30.10‘‘ E longitudesand 70 m altitude). Two plastic-cover greenhouses (6 x 20 m) oriented along North-South direction were used for experiments. Greenhouses are arc-roofed with continuous ventilation openings over the side walls and roofs. The province Samsun has a semi-humid climate. Annual average temperature is 14.4 C and precipitation is 698 mm. The average lowest temperature is 3.9 C in January and the average highest temperature is 32.5 C in August.Indoor temperature and relative humidity were measured with a data-logger during the entire growth period. BafraDemrehybrid long pepper cultivar was used as the plant material. Four different irrigation treatments (S1, irrigation until field capacity-full irrigation; S2, 70% irrigation; S3, 40% irrigation; S4, nonirrigated) were used in experiments. Experiments were carried out in randomized block design with four replications. Experiments were initiated on 25.05.2010 and equal irrigation water was applied to all treatments through drip irrigation until 25.06.2010. The first harvest was made on 07.07.2010 and the last harvest was made on 15.09.2010 in experiments.Pepper seedlings were planted in 1 m wide soil bed systems at 40 cm row spacing and 50 cm on-row spacing and plots were created for each treatment. Each treatment had 4 rows and measurements were performed on previously marked 6 different pepper seedlings of inner 2 rows. Harvest was performed to estimate the yields.
153
Plant height, fruit weight, leaf area index (LAI), water-yield relationships, fruit acidity (%) and water soluble dry matter content (WSDM) (%)were determined. Fruits weights were measured with a balance.Measurements were also performed to determine the relationships among plant growth parameters of previously marked 6 different plants under greenhouse conditions with different irrigation treatments.The time period elapsed from plantation of seedlings to flowering and harvest dates was considered as growth stages. Plant growth analyses were performed in accordance with Uzun (1996). Leaf area ratio (LAR), specific leaf area (SLA), leaf weight ratio (LWR), stem weight ratio (SWR), root weight ratio (RWR), net assimilation rate (NAR), relative growth rate (RGR) andleaf thicknes(LT) were determined as plant growth parameters (Table 1). Leaf, root, stem and fruit dry matter contents were determined. Plant dry weights were obtained by drying plants at 80 C until a constant weight [20]. For leaf area index values, leaf samples were taken in every 20 days, width and lengths of harvested leaves were measured and LAI calculated as the ratio of leaf area to unit plant area.Fruit acidity (%) was determined by titration method water soluble dry matter contents were determined from fruit juice extracts.
Statistical analyses were carried out by using SPSS software [18]. General Linear Model was used for variance analysis. Significances were evaluated at 0.01 and 0.05 levels. Duncan‘s multiple range test was used to assess the differences in mean plant growth and yield parameters.
Table 1
|
Plant growth parameters |
|
Growth parameters |
Explanation of the growth parameter models |
|
|
|
|
Leaf area ratio (LAR) |
The total leaf area of the plant (cm2)/The total dry weight of |
|
the plant (g) |
||
|
||
Specific leaf area (SLA) |
The leaf area of the plant (g)/The total leaf area dry weight |
|
of the plant (g) |
||
|
||
Leaf weight ratio (LWR) |
The total leaf area dry weight of plant (g)/The total dry |
|
weight of the plant (g) |
||
|
||
Net assimilation rate (NAR) |
(1 / LA) dA / dt (g cm-2 gün-1) |
|
Relative growth rate (RGR) |
Net assimilation rate (NAR) Leaf area ratio (LAR) (day-1) |
|
|
|
Results and discussion
Climate parameters. Indoor temperature and relative humidity values were measured during the experiments and indoor-outdoor temperature, relativity humidity and vapor pressure deficit (VPD) values are presented in Table 2 for the experimental period.The highest indoor temperature (34.75 C) was observed in August and the lowest (14.42 C) in September.The highest indoor VPD value was also observed in August with 4.37. Outdoor VPD value in August was determined as 1.02.
154

Table 2
Variation of monthly average indoor and outdoor temperatures
Mon |
|
|
Outdoor |
|
|
|
|
Indoor |
|
|
|
|
|
|
|
|
|
|
|
|
|
||
ths |
|
|
|
|
|
|
|
|
|
|
|
T avr. |
T max. |
T min. |
RH |
VPD |
T avr. |
T max. |
T minş. |
RH |
VPD |
||
|
|||||||||||
M |
17 |
20.63 |
12.79 |
77 |
0.44 |
27.13* |
30.85 * |
14.42* |
41* |
3.78* |
|
J |
22.34 |
25.75 |
18.91 |
81 |
0.52 |
31.76 |
34.62 |
15.80 |
58 |
2.68 |
|
Jl |
25.45 |
28.22 |
22.04 |
76 |
0.80 |
33.60 |
35.25 |
18.64 |
46 |
3.17 |
|
A |
26.96 |
30.68 |
22.83 |
71 |
1.02 |
34.75 |
39.46 |
18.90 |
42 |
4.37 |
|
S |
22.29 |
26.05 |
19.07 |
77 |
0.63 |
23.14** |
29.98 ** |
16.95** |
59** |
2.16** |
* Initial 7-day temperatures of May* *Initial 15-day temperatures of September M:May ; J : June; Jl: july ; A : August; S : September
Plant growth parameters. Plant heights of different irrigation treatments (S1, S2, S3 and S4) are presented in Figure 1. Aparabolic increase was observed in plant height with number days after the planting (NDAP). While there were not significant differences between treatments with regard to plant height until 40th day, significant differences were observed in subsequent days. The highest plant height was observed in full-irrigation treatment with 160 cmand it was followed by S2, S3 and S4 treatments respectively with 150 cm, 125 cm and 117 cm. Estimation values (R2) of S1, S2, S3 and S4 treatments were respectively determined as 0.973, 0.969, 0.975 and 0.988.Shao et al. (2008) investigated seasonal variations in plant height, yield and fruit quality parameters of chili pepper under greenhouse conditions with four different furrow irrigation treatments and observed significant variations in plant height with irrigation treatments. Researchers observed the highest plant height (59 cm) in control treatment (irrigation until field capacity) and the lowest plant height (40.3 cm) in D150 treatment (soil moisture level below 50%).Pepper fruit weights of S1, S2, S3 and S4 irrigation treatments were respectively found to be 29.38, 28.14, 25.31 and 19.97 g (Figure 2). Differences in fruit weights of treatments were found to be significant (p<0.05). Duncan‘s multiple range test was performed and three groups were formed with regard to fruit weights. S1 and S2 were placed into the first group (a), S3 into the second group (ab) and S4 into the third group (c). Such findings are also supported by previous researches.Variation of LAI values under different irrigation treatments are presented in Figure 3. While LAI values of irrigation treatments were not significantly different until 60th day, significant differences were observed in subsequent days. Pepper LAI values varied between 5.8 - 0.8. The highest value was observed in S1 treatment in the middle of growth period, the lowest value was observed in S4 treatment.The highest LAI of S1 treatment was 5.8 and the lowest value of S1 was 1.8. While the highest value of S4 was 1.6, the lowest value was observed as 0.8. Differences in LAI values of irrigation treatments were found to be significant (p<0.05) and mean values were placed into three different groups. Moreno et al., (2003) investigated the pepper leaf area index values under four different irrigation water level (125%, 1005, 75% and 50%) and observed the lowest leaf area index in deficit irrigation treatment and the highest in full (100%) irrigation treatment. Shao et al. (2010) investigated the effects of different irrigation water levels on yield and fruit quality parameters of hot pepper. Researchers tried nine different irrigation levels over four
155
growth periods and observed higher variations in LAI and higher fresh fruit weights under field capacities below 80%.
Figure 1. Variation of plants height with different irrigation treatments
|
55 |
|
|
S1 |
S2 |
S3 |
S4 |
|
50 |
|
|
|
|
|
|
(g)) |
45 |
|
|
|
|
|
|
40 |
|
|
|
|
|
|
|
weights |
35 |
|
|
|
|
|
|
30 |
|
|
|
|
|
|
|
25 |
|
|
|
|
|
|
|
Fruit |
|
|
|
|
|
|
|
20 |
|
|
|
|
|
|
|
|
|
|
|
|
|
|
|
|
15 |
|
|
|
|
|
|
|
10 |
|
|
|
|
|
|
|
40 |
50 |
60 |
70 |
80 |
90 |
100 |
|
|
|
|
DAP |
|
|
|
|
a |
a |
ab |
c |
|
weights(g)) |
40 |
|
|
|
|
30 |
|
|
|
||
20 |
|
|
|
||
fruit |
|
|
|
||
10 |
|
|
|
||
Mean |
0 |
|
|
|
|
S1 |
S2 |
S3 |
S4 |
||
|
Irrigation treatments
Figure 2. Fruit weights of irrigation treatments (g) (standard error bars were placed based on 5% probability level)
|
200 |
|
|
S1 Treatment |
|
|
|
|
160 |
|
|
|
|
|
|
(cm) |
120 |
|
|
|
|
|
|
Height |
80 |
|
|
|
|
|
|
|
|
|
|
|
2 + 2,5646x + 2,7023 |
|
|
Plant |
|
|
|
y = -0,0101x |
|
||
40 |
|
|
|
R2 = 0,973 |
|
||
|
0 |
|
|
|
|
|
|
|
0 |
20 |
40 |
60 |
80 |
100 |
120 |
|
|
|
|
DAP |
|
|
|
|
140 |
|
|
S3 Treatment |
|
|
|
|
120 |
|
|
|
|
|
|
(cm) |
100 |
|
|
|
|
|
|
80 |
|
|
|
|
|
|
|
Height |
|
|
|
|
|
|
|
60 |
|
|
|
|
|
|
|
Plant |
|
|
|
|
|
|
|
40 |
|
|
y = -0,0108x |
2 + 2,3109x + 5,5496 |
|
||
|
|
|
|
||||
|
20 |
|
|
R2 = 0,9759 |
|
|
|
|
0 |
|
|
|
|
|
|
|
0 |
20 |
40 |
60 |
80 |
100 |
120 |
DAP
|
160 |
|
|
S2 Treatment |
|
|
|
|
|
|
|
|
|
|
|
|
|
|
120 |
|
|
|
|
|
|
|
(cm) |
80 |
|
|
|
|
|
|
|
Height |
|
|
|
|
|
|
|
|
|
|
|
y = -0,0102x |
2 |
+ 2,4229x + 3,326 |
|
||
|
|
|
|
|
||||
Plant |
|
|
|
|
|
|||
40 |
|
|
|
2 |
|
|
|
|
|
|
|
R = 0,9693 |
|
|
|||
|
0 |
|
|
|
|
|
|
|
|
0 |
20 |
40 |
60 |
80 |
100 |
120 |
|
|
|
|
|
DAP |
|
|
|
|
|
120 |
|
|
S4 Treatment |
|
|
|
|
|
100 |
|
|
|
|
|
|
|
(cm) |
80 |
|
|
|
|
|
|
Height |
60 |
|
|
|
|
|
|
|
|
|
|
|
|
|
|
Plant |
40 |
|
|
y = -0,0098x |
2 + 1,9005x + 9,8861 |
|
|
|
|
|
|
||||
|
20 |
|
|
R2 = 0,9882 |
|
|
|
|
0 |
|
|
|
|
|
|
|
0 |
20 |
40 |
60 |
80 |
100 |
120 |
DAP
Figure 3.Leaf area index (LAI) of irrigation treatments (mm) (standard error bars were placed based on 5% probability level)
|
10 |
|
S1 |
S2 |
S3 |
S4 |
) |
) |
|
|
|
|
|
|
-2 |
-2 |
8 |
|
|
|
|
|
cm |
cm |
|
|
|
|
|
2 |
|
|
|
|
|
|
|
||
2 |
|
|
|
|
|
|
|
indexareaLeaf(cm |
6 |
|
|
|
|
|
indexareaLeaf(cm |
4 |
|
|
|
|
|
||
|
|
|
|
|
|
|
|
|
2 |
|
|
|
|
|
|
|
0 |
|
|
|
|
|
|
|
20 |
40 |
60 |
80 |
100 |
120 |
|
|
|
|
DAP |
|
|
|
|
4,5 |
a |
ab |
ab |
b |
4 |
|
|
|
|
3,5 |
|
|
|
|
3 |
|
|
|
|
2,5 |
|
|
|
|
2 |
|
|
|
|
1,5 |
|
|
|
|
1 |
|
|
|
|
0,5 |
|
|
|
|
0 |
|
|
|
|
|
S1 |
S2 |
S3 |
S4 |
Irrigation treatment
Correlation results for pepper growth parameters under greenhouse conditions are presented in Table 3. Correlations among LAR, SLA, LWR, SWR, RWR, NAR, RGR and LT parameters were evaluated at 0.01 and 0.05 significance levels. The highest negative correlation was observed between SLAandLTwith 0.849 and such a correlation was found to be significant (P<0.01).LT decreased with increasing SLA.A posi-
156

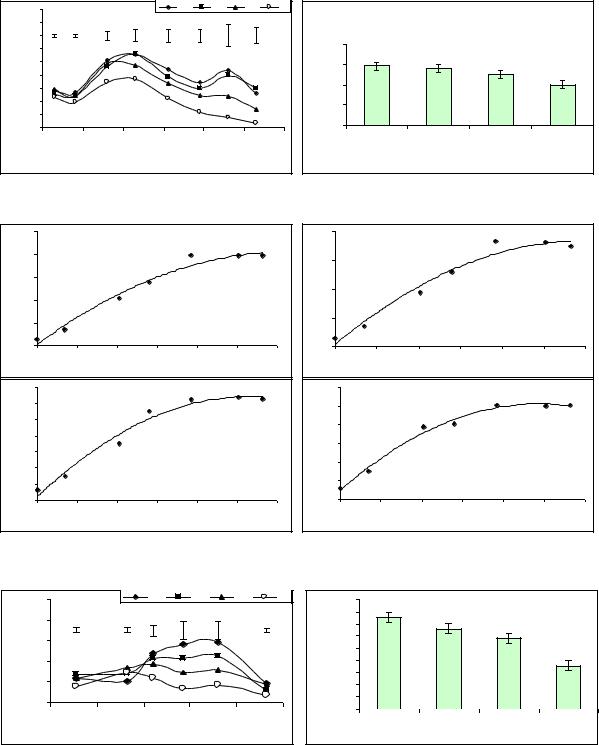
tive correlation was observed between LARandRGR(0.827)under different irrigation treatments. LAR, SLA, SWR, NAR and RGR values decreased with decreasing soil moisture levels during the growth period.High correlations were also observed between LT andLAR, SLA, RWR, RGR, NARvalues and these correlations were also found to be significant. The highest LT was observed in S3 and S4 irrigation treatments. LT increased and SLA decreases with water deficit. A negative correlation was observed between LWRandSWRbut the correlation was not found to be significant (P<0.01).Lucero et al., (1999) also reported decreasing RGR and LAR values of white clover with increasing water deficit levels.
|
|
|
|
|
|
Table 3 |
|
|
Correlation results for growth parameter under greenhouse conditions |
|
|||||
Growth parame- |
|
|
|
|
|
|
|
ter |
LAR |
SLA |
LWR |
RWR |
RGR |
NAR |
SWR |
|
|
|
|
|
|
|
|
SLA |
0.801** |
|
|
|
|
|
|
LWR |
0.110 |
-0.464* |
|
|
|
|
|
RWR |
-0.788** |
-0.756** |
0.096 |
|
|
|
|
RGR |
0.827** |
0.821** |
-0.171 |
0.622** |
|
|
|
NAR |
0.426 |
0.537* |
-0.297 |
-0.350 |
0.843** |
|
|
SWR |
-0.493* |
-0.330 |
-0.234 |
0.474* |
-0.182 |
0.170 |
|
LT |
-0.808** |
-0.849** |
0.366 |
0.738** |
-0.804** |
-0.595** |
0.205 |
|
|
|
|
|
|||
*P <0.05 significance level |
**P <0.01 significance level |
|
|
|
|||
SWRdecreased with decreasing irrigation water. The highest values were observed in S1and S2 treatments (0.35-0.33) and the lowest values were seen in S3 and S4 treatments (0.28-0.29 gg-1). LWR values also varied with irrigation water levels under greenhouse conditions. The highest SLA value (327 gg-1)was obtained from S1 treatment.Leaf area decreased with decreasing irrigation water levels. While the lowest specific leaf area (227.7 gg-1)was observed in S4 treatment, it was followed by S2 (280.7 gg-1)and S3 (249.4 gg-1)treatments. LAR values also varied with irrigation levels. Decreasing relative leaf areas were observed toward the end of growth period. Leaf thickness increased with decreasing irrigation water levels and the lowest average leaf thickness was observed in S1 (0.003) treatment. Average leaf thickness was 0.004 cm in S2, 0.005 cm in S3 and 0.005 cm in S4. NARvalues of irrigation treatments were found to be different and decreasing net assimilation ratios were observed with decreasing irrigation water levels. The highest values were observed in S1 and S2 treatments and the lowest in S4 treatment. Relative growth rates were also different at different irrigation levels and decreasing RGR values were observed with decreasing irrigation water levels. The highest relative growth rate was seen in S1 (3.4) treatment, it was followed by S2 (3.3) and S3 (2.7) and the lowest value was observed in S4 (2.5) treatment (Figure 4).
Figure 4. Variation of pepper growth parameters of different irrigation treatments during the growth period leaf area ratio (a) Specific leaf area (b) leaf weight ratio (c) stem weight ratio (d) root weight ratio (e) net assimilation rate (f) relative growth rate (g) leaf thicknes (h) (standard error bars were placed based on 5% probability level)
|
160 |
|
|
|
|
|
|
|
|
80 |
|
140 |
|
|
|
|
|
|
|
|
78 |
|
120 |
|
|
|
|
|
|
|
|
76 |
|
|
|
|
|
|
|
|
|
74 |
|
|
100 |
|
|
|
|
|
|
|
|
|
|
|
|
|
|
|
|
|
|
72 |
|
LAR |
|
|
|
|
|
|
|
|
LAR |
|
80 |
|
|
|
|
|
|
|
70 |
||
60 |
|
|
|
|
|
|
|
68 |
||
|
40 |
|
|
|
|
|
|
|
|
66 |
|
|
|
|
|
|
|
|
|
64 |
|
|
20 |
|
|
|
|
|
|
|
|
|
|
|
|
|
|
|
|
|
|
62 |
|
|
|
|
|
|
|
|
|
|
|
|
|
0 |
|
|
|
|
|
|
|
|
60 |
|
20 |
40 |
60 |
80 |
100 |
120 |
140 |
160 |
180 |
|
|
|
|
|
|
DAP |
|
|
|
157 |
|
|
|
|
|
|
|
|
|
|
|
a |
b |
b |
c |
S1 |
S2 |
S3 |
S4 |
Irrigation treatment
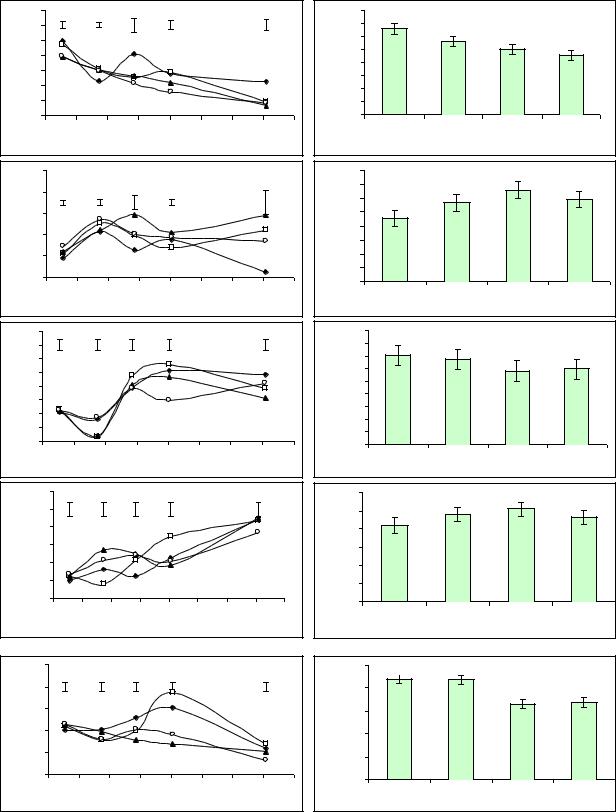
Figure 4 (continue). Variation of pepper growth parameters of different irrigation treatments during the growth period leaf area ratio (a) Specific leaf area (b) leaf weight ratio
(c) stem weight ratio (d) root weight ratio (e) net assimilation rate (f) relative growth rate (g) leaf thicknes (h) (standard error bars were placed based on 5% probability level)
|
700 |
|
|
|
|
|
|
|
|
400 |
a |
ab |
ab |
b |
|
600 |
|
|
|
|
|
|
|
|
350 |
|
|
|
|
|
500 |
|
|
|
|
|
|
|
|
300 |
|
|
|
|
|
|
|
|
|
|
|
|
|
250 |
|
|
|
|
|
SLA |
400 |
|
|
|
|
|
|
|
SLA |
|
|
|
|
|
|
|
|
|
|
|
|
200 |
|
|
|
|
|||
300 |
|
|
|
|
|
|
|
|
|
|
|
|||
|
|
|
|
|
|
|
|
|
|
|
|
|
||
|
|
|
|
|
|
|
|
|
150 |
|
|
|
|
|
|
|
|
|
|
|
|
|
|
|
|
|
|
|
|
|
200 |
|
|
|
|
|
|
|
|
100 |
|
|
|
|
|
|
|
|
|
|
|
|
|
|
|
|
|
|
|
|
100 |
|
|
|
|
|
|
|
|
50 |
|
|
|
|
|
0 |
|
|
|
|
|
|
|
|
0 |
|
|
|
|
|
20 |
40 |
60 |
80 |
100 |
120 |
140 |
160 |
180 |
|
S1 |
S2 |
S3 |
S4 |
|
|
|
|
|
DAP |
|
|
|
|
|
|
Irrigation treatment |
|
|
|
0,6 |
|
|
|
|
|
|
|
|
0,4 |
a |
ab |
b |
ab |
|
|
|
|
|
|
|
|
|
|
|
||||
|
0,5 |
|
|
|
|
|
|
|
|
0,35 |
|
|
|
|
|
|
|
|
|
|
|
|
|
0,3 |
|
|
|
|
|
|
|
|
|
|
|
|
|
|
|
|
|
|
|
|
LWR |
0,4 |
|
|
|
|
|
|
|
LWR |
0,25 |
|
|
|
|
|
|
|
|
|
|
|
|
0,15 |
|
|
|
|
||
|
0,3 |
|
|
|
|
|
|
|
|
0,2 |
|
|
|
|
|
|
|
|
|
|
|
|
|
|
|
|
|
|
|
|
0,2 |
|
|
|
|
|
|
|
|
0,1 |
|
|
|
|
|
|
|
|
|
|
|
|
|
|
0,05 |
|
|
|
|
|
0,1 |
|
|
|
|
|
|
|
|
0 |
|
|
|
|
|
|
|
|
|
|
|
|
|
|
|
|
|
|
|
|
20 |
40 |
60 |
80 |
100 |
120 |
140 |
160 |
180 |
|
S1 |
S2 |
S3 |
S4 |
|
|
|
|
|
|
|
|
|
|
|
||||
|
|
|
|
|
DAP |
|
|
|
|
|
|
Irrigation treatment |
|
|
|
0,8 |
|
|
|
|
|
|
|
|
0,45 |
a |
ab |
b |
ab |
|
|
|
|
|
|
|
|
|
|
0,4 |
||||
|
0,7 |
|
|
|
|
|
|
|
|
|
|
|
|
|
|
0,6 |
|
|
|
|
|
|
|
|
0,35 |
|
|
|
|
|
|
|
|
|
|
|
|
|
|
|
|
|
|
|
|
0,5 |
|
|
|
|
|
|
|
|
0,3 |
|
|
|
|
|
|
|
|
|
|
|
|
|
|
|
|
|
|
|
SWR |
0,4 |
|
|
|
|
|
|
|
SWR |
0,25 |
|
|
|
|
|
|
|
|
|
|
|
0,15 |
|
|
|
|
|||
|
0,3 |
|
|
|
|
|
|
|
|
0,2 |
|
|
|
|
|
|
|
|
|
|
|
|
|
|
|
|
|
|
|
|
0,2 |
|
|
|
|
|
|
|
|
0,1 |
|
|
|
|
|
0,1 |
|
|
|
|
|
|
|
|
|
|
|
|
|
|
|
|
|
|
|
|
|
|
0,05 |
|
|
|
|
|
|
|
|
|
|
|
|
|
|
|
|
|
|
|
|
|
0 |
|
|
|
|
|
|
|
|
0 |
|
|
|
|
|
|
|
|
|
|
|
|
|
|
|
|
|
|
|
|
20 |
40 |
60 |
80 |
100 |
120 |
140 |
160 |
180 |
|
S1 |
S2 |
S3 |
S4 |
|
|
|
|
|
|
|
|
|
|
|
||||
|
|
|
|
|
DAP |
|
|
|
|
|
|
Irrigation treatment |
|
|
|
0,12 |
|
|
|
|
|
|
|
|
0,06 |
a |
ab |
b |
ab |
|
|
|
|
|
|
|
|
|
|
|
||||
|
0,1 |
|
|
|
|
|
|
|
|
0,05 |
|
|
|
|
RWR |
0,08 |
|
|
|
|
|
|
|
RWR |
0,04 |
|
|
|
|
0,04 |
|
|
|
|
|
|
|
|
|
|
|
|
||
|
0,06 |
|
|
|
|
|
|
|
|
0,03 |
|
|
|
|
|
|
|
|
|
|
|
|
|
|
0,02 |
|
|
|
|
|
0,02 |
|
|
|
|
|
|
|
|
0,01 |
|
|
|
|
|
|
|
|
|
|
|
|
|
|
|
|
|
|
|
|
0 |
|
|
|
|
|
|
|
|
0 |
|
|
|
|
|
|
|
|
|
|
|
|
|
|
|
|
|
|
|
|
20 |
40 |
60 |
80 |
100 |
120 |
140 |
160 |
180 |
|
S1 |
S2 |
S3 |
S4 |
|
|
|
|
|
|
|
|
|
|
|
||||
|
|
|
|
|
DAP |
|
|
|
|
|
|
Irrigation treatment |
|
|
|
0,1 |
|
|
|
|
|
|
|
|
0,05 |
a |
a |
b |
b |
|
0,08 |
|
|
|
|
|
|
|
|
0,04 |
|
|
|
|
NAR |
0,06 |
|
|
|
|
|
|
|
NAR |
0,03 |
|
|
|
|
0,04 |
|
|
|
|
|
|
|
0,02 |
|
|
|
|
||
|
0,02 |
|
|
|
|
|
|
|
|
0,01 |
|
|
|
|
|
|
|
|
|
|
|
|
|
|
|
|
|
|
|
|
0 |
|
|
|
|
|
|
|
|
0 |
|
|
|
|
|
|
|
|
|
|
|
|
|
|
|
|
|
|
|
|
20 |
40 |
60 |
80 |
100 |
120 |
140 |
160 |
180 |
|
S1 |
S2 |
S3 |
S4 |
|
|
|
|
|
|
|
|
|
|
|
||||
|
|
|
|
|
DAP |
|
|
|
|
|
|
Irrigation treatment |
|
|
|
|
|
|
|
|
|
|
|
158 |
|
|
|
|
|
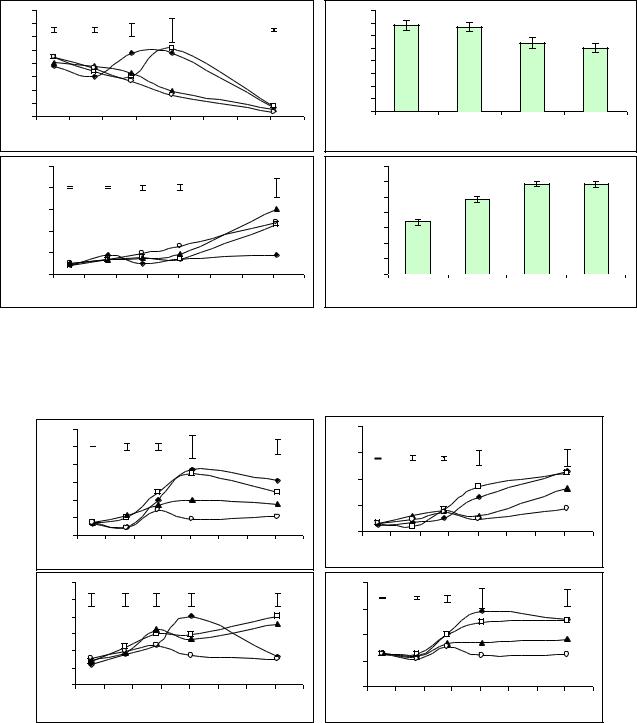
Figure 4 (continue). Variation of pepper growth parameters of different irrigation treatments during the growth period leaf area ratio (a) Specific leaf area (b) leaf weight ratio
(c) stem weight ratio (d) root weight ratio (e) net assimilation rate (f) relative growth rate (g) leaf thicknes (h) (standard error bars were placed based on 5% probability level)
|
8 |
|
|
|
|
|
|
|
|
|
7 |
|
|
|
|
|
|
|
|
|
6 |
|
|
|
|
|
|
|
|
|
5 |
|
|
|
|
|
|
|
|
RGR |
4 |
|
|
|
|
|
|
|
|
3 |
|
|
|
|
|
|
|
|
|
|
|
|
|
|
|
|
|
|
|
|
2 |
|
|
|
|
|
|
|
|
|
1 |
|
|
|
|
|
|
|
|
|
0 |
|
|
|
|
|
|
|
|
|
20 |
40 |
60 |
80 |
100 |
120 |
140 |
160 |
180 |
|
|
|
|
|
DAP |
|
|
|
|
|
0,025 |
|
|
|
|
|
|
|
|
|
0,02 |
|
|
|
|
|
|
|
|
|
0,015 |
|
|
|
|
|
|
|
|
LT |
0,01 |
|
|
|
|
|
|
|
|
|
|
|
|
|
|
|
|
|
|
|
0,005 |
|
|
|
|
|
|
|
|
|
0 |
|
|
|
|
|
|
|
|
|
20 |
40 |
60 |
80 |
100 |
120 |
140 |
160 |
180 |
|
|
|
|
|
DAP |
|
|
|
|
|
4 |
a |
a |
b |
b |
|
3,5 |
|
|
|
|
|
3 |
|
|
|
|
|
2,5 |
|
|
|
|
RGR |
2 |
|
|
|
|
1,5 |
|
|
|
|
|
|
1 |
|
|
|
|
|
0,5 |
|
|
|
|
|
0 |
|
|
|
|
|
|
S1 |
S2 |
S3 |
S4 |
|
|
|
Irrigation treatment |
|
|
|
0,007 |
a |
b |
bc |
bc |
|
0,006 |
|
|
|
|
|
0,005 |
|
|
|
|
LT |
0,004 |
|
|
|
|
0,003 |
|
|
|
|
|
|
|
|
|
|
|
|
0,002 |
|
|
|
|
|
0,001 |
|
|
|
|
|
0 |
|
|
|
|
|
|
S1 |
S2 |
S3 |
S4 |
|
|
|
Irrigation treatment |
|
|
Figure 5. Pepper growth parameters under different irrigation treatments a) Total stem dry weight b) total root dry weight c) total leaf dry weight d) total plant dry weight (standard error bars were placed based on 5% probability level)
120 |
|
|
|
|
|
|
|
|
100 |
|
|
|
|
|
|
|
|
80 |
|
|
|
|
|
|
|
|
60 |
|
|
|
|
|
|
|
|
TSDW 40 |
|
|
|
|
|
|
|
|
20 |
|
|
|
|
|
|
|
|
0 |
|
|
|
|
|
|
|
|
20 |
40 |
60 |
80 |
100 |
120 |
140 |
160 |
180 |
|
|
|
|
DAP |
|
|
|
|
60 |
|
|
|
|
|
|
|
|
50 |
|
|
|
|
|
|
|
|
40 |
|
|
|
|
|
|
|
|
30 |
|
|
|
|
|
|
|
|
TLDW |
|
|
|
|
|
|
|
|
20 |
|
|
|
|
|
|
|
|
10 |
|
|
|
|
|
|
|
|
0 |
|
|
|
|
|
|
|
|
20 |
40 |
60 |
80 |
100 |
120 |
140 |
160 |
180 |
|
|
|
|
DAP |
|
|
|
|
|
20 |
|
|
|
|
|
|
|
|
|
15 |
|
|
|
|
|
|
|
|
TRDW |
10 |
|
|
|
|
|
|
|
|
|
|
|
|
|
|
|
|
|
|
|
5 |
|
|
|
|
|
|
|
|
|
0 |
|
|
|
|
|
|
|
|
|
20 |
40 |
60 |
80 |
100 |
120 |
140 |
160 |
180 |
|
|
|
|
|
DAP |
|
|
|
|
|
200 |
|
|
|
|
|
|
|
|
|
150 |
|
|
|
|
|
|
|
|
TPDW |
100 |
|
|
|
|
|
|
|
|
|
|
|
|
|
|
|
|
|
|
|
50 |
|
|
|
|
|
|
|
|
|
0 |
|
|
|
|
|
|
|
|
|
20 |
40 |
60 |
80 |
100 |
120 |
140 |
160 |
180 |
|
|
|
|
|
DAP |
|
|
|
|
Cemek et al. (2005) investigated the effects of PE-UV, D-PE (double-lines polyethylene), PE-IR and PE greenhouse covers on growth, development and yield of eggplant. They analyzed plant height, LAR, SLA, LWR, NAR and RGR like plant growth parameters. Heuvelin (1989) investigated plant growth parameters under different tem-
159
peratures and light exposure levels and observed regressed plant growths with decreasing light emission. Total stem dry weight (TSDW), total leaf dry weight (TLDW) and total plant dry weight (TPDW) were also found to be different in different irrigation treatments. All of them decreased with decreasing irrigation water levels. Deficit irrigations negatively affected plant vegetative development. S4 treatment had the lowest total leaf dry weight (TLDW) value (Figure 5).
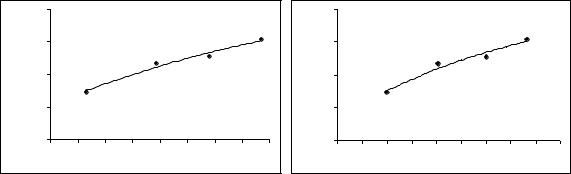
Water-yield relationships. With regard to experimentaltreatments, the highest amount of irrigation water was applied to S1(1254 mm) and the lowest to S4 (296 mm) treatment. The amount applied to S2 and S3 treatments was 970 mmand678 mm, respectively. Plant water consumptions exhibited parallel trends to appliedirrigation water. The highest yield (3077.1 kg da-1) was obtained from S1 treatment with the highest irrigation water and it was followed respectively by S2 (2532.5kg da-1), S3 (2329.5 kg da-1) and S4 (1466.6 kg da-1) treatments. A significant second degree polynomial relationship was observed between pepper yield and applied irrigation water (Figure 6). The correlation coefficient between irrigation water and yield was R2 = 0.974, the coefficient between yield and plant water consumption was R2= 0.901.Kırnaket al. (2004) also observed significant linear relationships between tomato yield and irrigation water. Demiret al. (2006) reported a linear relationship between sunflower yield and irrigation water with R2= 0.945 in 2000 and R2= 0.896 in2001.
Cemeket al. (2005) investigated effects of four different irrigation levels (Kp1=0.60, Kp2=0.80, Kp3=1.0 and Kp4= 1.20) on growth, development and yield of cucumber during the years 2002 and 2003 and observed significant second-degree polynomial relationships between yield and irrigation water with R2of 0.76 in2002 and 0.77 in2003. Researchers observed average seasonal irrigation water, plant water consumption and yield respectively as 475-1108 mm, 498-1316 mmand 82-132.5 kgm- 2.Greenhouse-grown hot pepper was used to investigate the effect of a newly developing irrigation technique and three irrigation strategiesobserved the highest yield (19.57 t ha- 1) in 80%treatment(soil water content was lower by 80% of field capacity) [17]. Topçu (1998) investigated drip irrigation intervals (daily, every three days) on pepper (Capsium annum vargrossum) yield and quality under high-tunnels and observed significant effects of irrigation intervals on yields. Although the researcher did not observe any significant differences in fruit quality, he reported significant increases in yield with daily irrigations. Aladenola andMadramootoo (2012) tested the effects of different irrigation levels (120, 100, 80 and 40%) on yield of long green pepper and observed the applied amounts of irrigation water and yields respectively as 739.5 m3(26.953 kgha-1), 616.3 m3 (26.880 kgha-1), 493.1 m3 (13.605 kgha-1) and 246.4 m3 (5.107 kgha-1).
Figure 6. Irrigation water – yield relationship (a), plant water consumption – yield relationship (b)
|
4000 |
|
|
|
|
|
|
|
|
|
4000 |
|
|
|
|
|
|
) |
3000 |
|
|
|
|
|
|
|
|
) |
3000 |
|
|
|
|
|
|
|
|
|
|
|
|
|
|
|
|
|
|
|
|
|
|
||
1- |
|
|
|
|
|
|
|
|
|
1- |
|
|
|
|
|
|
|
(kg da |
2000 |
|
|
|
|
|
|
|
|
(kg da |
2000 |
|
|
|
|
|
|
Yield |
1000 |
|
|
y = -0,0005x2 + 2,3364x + 846,92 |
|
Yield |
1000 |
|
|
|
y = 0,0006x2 + 2,2539x - 660,69 |
||||||
|
|
|
|
|
|
|
|
||||||||||
|
|
|
|
|
2 |
|
|
|
|
|
|
|
|
|
2 |
||
|
|
|
|
|
|
R = 0,9742 |
|
|
|
|
|
|
|
|
|
R = 0,9099 |
|
|
0 |
|
|
|
|
|
|
|
|
|
0 |
|
|
|
|
|
|
|
100 |
250 |
400 |
550 |
700 |
850 |
1000 |
1150 |
1300 |
|
100 |
250 |
400 |
550 |
700 |
850 |
1000 1150 1300 1450 |
|
|
|
|
Irrigation water (mm) |
|
|
|
|
|
|
|
|
ETc (mm) |
||||
|
|
|
|
|
|
|
|
|
160 |
|
|
|
|
|
|
|
|