

01 POWER ISLAND / 02 H2+NH3 / The_Future_of_Hydrogen-IEA-2020
.pdfThe Future of Hydrogen |
Chapter 3: Storage, transmission and distribution of hydrogen |
Total cost of delivering and storing hydrogen
The full cost of hydrogen delivery to end users must take into account all possible stages of the supply chain. The different hydrogen carriers and modes of transport have very different conversion, transmission, distribution, storage and reconversion costs. While one option may be cheaper for a specific part of the value chain, this may be offset by higher costs in another part of the chain. The various technologies involved are also at different degrees of maturity and so have very different future cost reduction potentials. There may be scope for synergies between energy, heat and storage requirements. For example, if the specific value chain in question has higher energy requirements at the export terminal than at the import terminal (e.g. liquid hydrogen), this could improve the relative cost and emission dynamics compared with the reverse case (e.g. LOHCs).
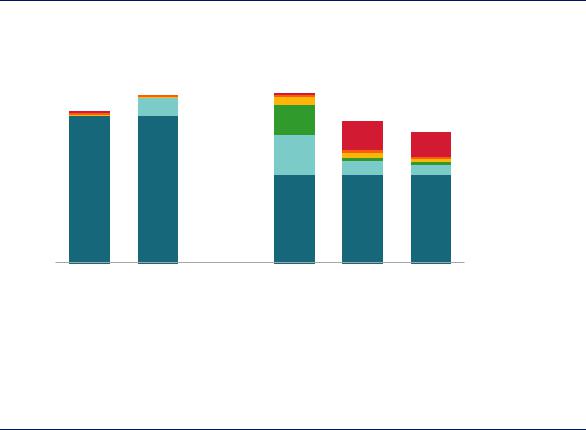
The overall cost of delivering hydrogen will vary according to the infrastructure available in the exporting and importing countries, transmission and distribution distances, the method of transport, and end-use demand. Despite the many uncertainties around most of these cost components, IEA analysis suggests that for inland transmission and distribution, hydrogen gas is the cheaper option for distances below around 3 500 km (Figure 29). Above this distance, ammonia pipelines would be the cheaper option. Comparing transport using pipelines and ships, transmission and distribution of hydrogen gas by pipeline is cheaper for distances below around 1 500 km. Above this distance, LOHC and ammonia transport by ship, which are broadly similar in terms of their full costs, become the cheaper delivery options. The transport and use of ammonia or some LOHCs may, however, give rise to potential safety and public acceptance issues, which could limit their application in some situations.
Figure 29. Full cost of hydrogen delivery to the industrial sector by pipeline or by ship in 2030 for different transmission distances
USD/kgH
8
6
4
2
0
|
|
|
Pipeline |
|
|
|
|
Ship |
|
|
|
|
|
|
|
|
USD/kgH |
8 |
|
|
|
|
|
|
|
|
|
|
6 |
|
|
|
|
|
|
|
|
|
|
|
|
|
|
|
|
|
|
|
|
|
|
|
|
4 |
|
|
|
|
|
|
|
|
|
|
|
2 |
|
|
|
|
|
0 |
1 000 |
2 000 |
3 000 |
4 000 |
5 000 |
0 |
|
|
|
|
|
0 |
1 000 |
2 000 |
3 000 |
4 000 |
5 000 |
||||||
|
|
|
|
|
km |
|
|
|
|
|
km |
|
|
|
|
Hydrogen |
LOHC |
Ammonia |
|
|
|
||
Notes: Hydrogen production cost = USD 3/kgH2; assumes distribution of 100 tpd in a pipeline to an end-use site 50 km from the receiving terminal. More information on the assumptions is available at www.iea.org/hydrogen2019.
Source: IEA 2019. All rights reserved.
Delivering hydrogen to the industrial sector is cheaper by pipeline for transmission distances below 1 500 km; above this distance LOHC and ammonia are cheaper options.
PAGE | 81
IEA. All rights reserved.
The Future of Hydrogen |
Chapter 3: Storage, transmission and distribution of hydrogen |
IEA analysis indicates that in the future it may be cheaper in a number of instances to import hydrogen than to produce it domestically. For example, Japan currently imports around 90% of its energy needs and, as its Basic Hydrogen Strategy shows, it views hydrogen as a source of energy diversification, emissions reduction and industrial leadership. IEA estimates that, for Japan’s industrial sector in 2030, importing electrolytic hydrogen from Australia (around USD 5.5/kgH2) will be cheaper than domestic production (USD 6.5/kgH2) (Figure 30). This assumes the production of hydrogen in Australia using combined installations of electrolysers, solar plants and wind farms in a region with high solar and wind resources (Chapter 2) and the subsequent export of this hydrogen to the point of use in Japan as ammonia or LOHC. The total cost of transporting the hydrogen from Australia to Japan (including conversion and reconversion) would be just over USD 1.5/kgH2, equivalent to USD 45 per MWh. Ammonia would be even more attractive if it could be used directly by the end consumer, thereby avoiding the additional costs of reconverting it back into hydrogen.
The cheapest source of hydrogen would, however, still be substantially more expensive than natural gas. In 2030 the imported natural gas price in Japan is projected to be USD 10/MBtu, equivalent to around USD 1.2/kgH2. Although the actual cost differential may be slightly smaller than it looks because some hydrogen end-use devices may have a higher efficiency than natural gas devices, further cost reductions would be needed to improve the competitiveness of hydrogen against natural gas systems.
Figure 30. Cost of delivering hydrogen or ammonia produced via electrolysis from Australia to an industrial customer in Japan in 2030
USD/kgH |
8 |
|
|
|
|
|
|
|
|
|
|
|
Distribution |
|
|
|
|
|
|
|
|
|
|
|
|||
|
6 |
|
|
|
|
|
|
|
|
|
|
|
Reconversion |
|
|
|
|
|
|
|
|
|
|
|
|
Transmission |
|
|
|
|
|
|
|
|
|
|
|
|
|
||
|
|
|
|
|
|
|
|
|
|
|
|
||
|
|
|
|
|
|
|
|
|
|
|
|
||
|
4 |
|
|
|
|
|
|
|
|
|
|
|
|
|
|
|
|
|
|
|
|
|
|
|
|
||
|
|
|
|
|
|
|
|
|
|
|
|
||
|
|
|
|
|
|
|
|
|
|
|
|
Import/export |
|
|
|
|
|
|
|
|
|
|
|
|
|
||
|
|
|
|
|
|
|
|
|
|
|
|
|
|
|
|
|
|
|
|
|
|
|
|
|
|
|
|
|
|
|
|
|
|
|
|
|
|
|
|
|
|
|
|
|
|
|
|
|
|
|
|
|
|
|
terminals |
|
2 |
|
|
|
|
|
|
|
|
|
|
|
Conversion |
|
|
|
|
|
|
|
|
|
|
|
|
||
|
|
|
|
|
|
|
|
|
|
|
|
|
|
|
0 |
|
Hydrogen |
Ammonia |
|
Hydrogen |
LOHC |
Ammonia |
|
|
Production |
||
|
|
|
|
|
|||||||||
|
|
|
|
|
|||||||||
|
|
|
|
|
|
||||||||
|
|
|
|
|
|
|
|||||||
|
|
|
Domestic |
|
Import from Australia |
|
|
|
|||||
Notes: Assumes distribution of 100 tpd in a pipeline to an end-use site 50 km from the receiving terminal. Storage costs are included in the cost of import and export terminals. More information on the assumptions is available at www.iea.org/hydrogen2019.
Source: IEA analysis based on IAE (2019), “Economical Evaluation and Characteristic Analyses for Energy Carrier Systems” and Reuß (2017), “Seasonal storage and alternative carriers: A flexible hydrogen supply chain model”. All rights reserved.
The cost of transport from Australia to Japan could represent between 30% and 45% of the full cost of hydrogen; yet imports of electrolytic hydrogen could still be cheaper than domestic production.
Imports of hydrogen produced from renewable electricity appear to make sense for a number of other possible trade routes too. If ammonia could be used by the end user without the need for reconversion back to hydrogen, then imports would be even cheaper. For example, the cost of
PAGE | 82
IEA. All rights reserved.

The Future of Hydrogen |
Chapter 3: Storage, transmission and distribution of hydrogen |
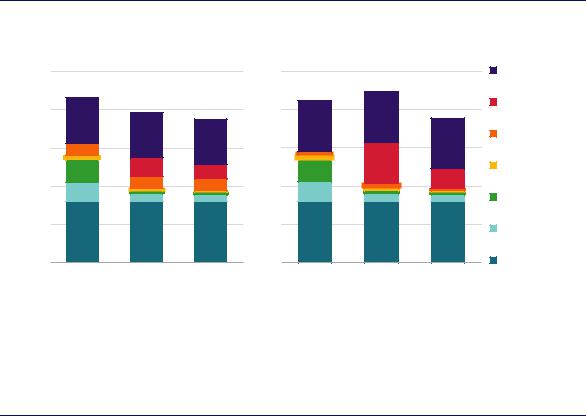
importing ammonia from electrolytic hydrogen produced in North Africa into Europe could be cheaper than producing it in Europe (Figure 31).
Figure 31. Comparison of delivered hydrogen costs for domestically produced and imported hydrogen for selected trade routes in 2030
|
|
|
|
|
Natural gas with CCUS |
|
8 |
|
|
Renewable electricity |
|||||||||||||||||||||||||
USD/kgH |
8 |
|
|
|
|
|
|
|
|
|
|
|
|
|
|
|
|
|
USD/kgH |
|
|
|
|
|
|
|
|
|
|
|
|
|
|
|
|
|
|
|
|
|
|
|
|
|
|
|
|
|
|
|
|
|
|
|
|
|
|
|
|
|
|
|
|
|
|
|
|
||||
6 |
|
|
|
|
|
|
|
|
|
|
|
|
|
|
|
|
|
6 |
|
|
|
|
|
|
|
|
|
|
|
|
|
|
|
||
|
|
|
|
|
|
|
|
|
|
|
|
|
|
|
|
|
|
|
|
|
|
|
|
|
|
|
|
|
|
|
|
||||
|
4 |
|
|
|
|
|
|
|
|
|
|
|
|
|
|
|
|
|
|
4 |
|
|
|
|
|
|
|
|
|
|
|
|
|
|
|
|
|
|
|
|
|
|
|
|
|
|
|
|
|
|
|
|
|
|
|
|
|
|
|
|
|
|
|
|
|
|
|
|
|
||
|
2 |
|
|
|
|
|
|
|
|
|
|
|
|
|
|
|
|
|
|
2 |
|
|
|
|
|
|
|
|
|
|
|
|
|
|
|
|
|
|
|
|
|
|
|
|
|
|
|
|
|
|
|
|
|
|
|
|
|
|
|
|
|
|
|
|
|
|
|
|
|
||
|
0 |
|
|
|
|
|
|
|
|
|
|
|
|
|
|
|
|
|
|
0 |
|
|
|
|
|
|
|
|
|
|
|
|
|
|
|
|
|
|
|
|
|
|
|
|
|
|
|
|
|
|
|
|
|
|
|
|
|
|
|
|
|
|
|
|
|
|
|
|
|
||
|
|
|
|
|
|
|
|
|
|
|
|
|
|
|
|
|
|
|
|
|
|
|
|
|
|
|
|
|
|
|
|
|
|
|
|
|
Australia– |
Middle East– |
Russia– |
|
Australia– |
Middle East– |
North Africa– |
|||||
|
Japan |
Japan |
|
EU |
|
Japan |
|
|
Japan |
EU |
||
|
Domestic hydrogen |
|
|
Domestic ammonia |
|
Imported ammonia |
|
|
Reconversion cost |
|||
|
|
|
|
|||||||||
|
|
|
|
|||||||||
Note: “Domestic” cost is the full cost of hydrogen production and distribution in the importing country (i.e. Japan or the European Union). All costs assume 50 km distribution to a large industrial facility. More information on the assumptions is available at www.iea.org/hydrogen2019.
Source: IEA 2019. All rights reserved.
Hydrogen imports could be cheaper than domestic production for a number of countries, especially if ammonia can be used by the final customer without the need for reconversion back into hydrogen.
However, for many other possible trade routes, the relatively high cost of hydrogen transmission and distribution means that it will generally be cheaper to produce hydrogen domestically rather than import it. This is because the cost of transport will outweigh differences in the cost of electricity production from renewable sources, or differences in natural gas prices and the cost of CCUS. In Europe, for example, domestic production of lowcarbon hydrogen from natural gas equipped with CCUS is likely to be cheaper for industry and power applications than importing low-carbon hydrogen from Russia. Even so, some countries with constrained CO2 storage or limited untapped renewable resources may still see low-carbon hydrogen imports as worthwhile because of the contribution they make to diversifying their energy systems and reducing their CO2 emissions.
In the transport sector, centralised reconversion of LOHC or ammonia to produce hydrogen, for example at an import terminal, is generally much cheaper than reconversion at the point of final use, for example at a filling station. However, this needs to be balanced against the higher cost of distributing hydrogen as a liquid or gas.
For hydrogen produced in North Africa and transported to Europe, it is likely to be cheapest to ship the hydrogen as ammonia or LOHC, with the cheapest option for subsequent distribution to a 1 tpd refuelling station22 depending on the distances involved. For ammonia, if the
22 This is approximately the size of large hydrogen refuelling stations considered under the Hydrogen Mobility Initiative in Germany.
PAGE | 83
IEA. All rights reserved.
The Future of Hydrogen |
Chapter 3: Storage, transmission and distribution of hydrogen |
distribution distance is below 100 km, then the cheapest option is likely to be to reconvert the ammonia as soon as it has been imported and to distribute the resultant hydrogen using compressed hydrogen gas trucks. If the distribution distance is greater than 100 km, then it is likely to be cheaper to distribute the ammonia in trucks and reconvert them to produce hydrogen at the refuelling station. For LOHC, centralised reconversion is cheaper for distribution distances up to 500 km.
A distribution distance of 100 km would result in a delivered hydrogen price (before tax and margins) between USD 7.5/kgH2 and USD 9/kgH2 (Figure 32). Taking into account the higher conversion efficiency of fuel cells compared to internal combustion engines, this would be equivalent to between USD 1.1 and 1.3 per litre of gasoline; this is under current prices at the pump in Europe of around USD 1.4 per litre, although these are prices after taxes.
If existing pipeline infrastructure can be used for hydrogen, the cost of transmission and distribution would be much lower. For example, it is estimated that the cost to convert the gas network of the United Kingdom to supply pure hydrogen to buildings would be around USD 0.6/kgH2 (CCC, 2018). Given the lower energy density of hydrogen, additional storage capacity would also be required to meet heat demand, which would add a further USD 0.5/kgH2. In this case, the total cost of hydrogen imported from North Africa and delivered to buildings in the European Union would be around USD 4.5/kgH2 (USD 135/MWh) for hydrogen produced from natural gas with CCUS, or USD 6/kgH2 (USD 180/MWh) for electrolytic hydrogen.
Figure 32. Cost of electrolytic hydrogen imports from North Africa supplied to a hydrogen refuelling station in Europe in 2030
Centralised reconversion |
Decentralised reconversion |
USD/kgH
10 |
|
10 |
8 |
|
8 |
6 |
|
6 |
4 |
|
4 |
2 |
|
2 |
0 |
|
0 |
Liquid |
LOHC |
Ammonia |
hydrogen |
|
|
|
|
Refuelling station |
|
|
Reconversion |
|
|
Distribution |
|
|
Transmission |
|
|
Import/export |
|
|
terminals |
|
|
Conversion |
|
|
Production cost |
Liquid |
LOHC |
Ammonia |
hydrogen |
|
|
Note: Assumes a distribution distance of 100 km. More information on the assumptions is available at www.iea.org/hydrogen2019.
Source: IEA analysis based on IAE (2019), “Economical Evaluation and Characteristic Analyses for Energy Carrier Systems”
and Reuß (2019), “A hydrogen supply chain with spatial resolution: Comparative analysis of infrastructure technologies in Germany”. All rights reserved.
Delivering hydrogen to European refuelling stations in 2030 is likely to cost USD 7.5–9/kgH2. The choice of centralised or decentralised reconversion depends on distribution distance.
PAGE | 84
IEA. All rights reserved.
The Future of Hydrogen |
Chapter 3: Storage, transmission and distribution of hydrogen |
References
Aakko-Saksaa, P. T. et al. (2018), “Liquid organic hydrogen carriers for transportation and storing of renewable energy – Review and discussion”, Journal of Power Sources, Vol. 396, pp. 803–23, https://doi.org/10.1016/j.jpowsour.2018.04.011.
Abbott, D. J., J. P. Bowers and S. R. James, “The impact of natural gas composition variations on the operation of gas turbines for power generation”, The Future of Gas Turbine Technology 6th International Conference, 17–18 October 2012, Brussels, Belgium, https://gasgov-mst-files.s3.eu- west-1.amazonaws.com/s3fs-public/ggf/Impact%20of%20Natural%20Gas%20Composition%20- %20Paper_0.pdf (accessed 5 April 2019).
Altfeld, K. and D. Pinchbeck (2013), “Admissible hydrogen concentrations in natural gas systems”, Gas Energy, www.gas-for-energy.com/products/2013-admissible-hydrogen-concentrations-in-natural- gas-systems-1/.
Bartels, J.R. (2008), “A feasibility study of implementing an Ammonia Economy”, Iowa State University, https://lib.dr.iastate.edu/cgi/viewcontent.cgi?article=2119&context=etd.
Brown, T. (2017), “Round-trip efficiency of ammonia as a renewable energy transportation media”, Ammonia Energy, www.ammoniaenergy.org/round-trip-efficiency-of-ammonia-as-a-renewable- energy-transportation-media/.
Bünger, U. et al., (2014). “Power-to-Gas (PtG) in transport: Status quo and perspectives for development”, Report to the Federal Ministry of Transport and Digital Infrastructure (BMVI), Germany.
CCC (Committee on Climate Change) (2018), “Analysis of alternative UK heat decarbonisation pathways (Imperial), Supporting data”, www.theccc.org.uk/publication/analysis-of-alternative-uk-heat- decarbonisation-pathways/.
Dodds, P. and P. Ekins (2013), “A portfolio of powertrains for the UK: an energy systems analysis”,
International Journal of Hydrogen Energy, Vol. 39, Issue 26, pp. 13941–53.
Dolci, F., et al. (2019), “Incentives and legal barriers for Power-to-Hydrogen pathways: An international snapshot”, International Journal of Hydrogen, doi:10.1016/j.ijhydene.2019.03.045.
DNV GL (2017), “Verkenning Waterstofinfrastructuur”(Reconnaissance hydrogen infrastructure), OGNL.151886, Rev. 2, www.topsectorenergie.nl/sites/default/files/uploads/TKI%20Gas/publicaties/DNVGL%20rapport% 20verkenning%20waterstofinfrastructuur_rev2.pdf
Eurogas (2018), “Eurogas discussion paper for the gas package (2020)”, Position Paper No. 18PP309, https://eurogas.org/website/wp-content/uploads/2018/10/18PP309-Eurogas-discussion-paper-for- 2020-gas-package-October-2018.pdf (accessed 5 April 2019).
ECS (European Committee for Standardization) (2015), “European standard: Gas infrastructure – Quality of gas – Group H”, https://standards.globalspec.com/std/10009928/din-en-16726.
Giddey, S. et al. (2017), “Ammonia as a renewable energy transportation media”, ACS Sust. Chem. Eng., Vol. 5, Issue 11, pp. 10231–39, doi: 10.1021/acssuschemeng.7b02219.
H21 (2018), H21 North of England, H21, Northern Gas Networks, Equinor and Cadent, www.northerngasnetworks.co.uk/h21-noe/H21-NoE-26Nov18-v1.0.pdf.
Haeseldonckx, D. and W. D’haeseleer (2007), “The use of the natural-gas pipeline infrastructure for hydrogen transport in a changing market structure”, International Journal of Hydrogen Energy, Vol. 32, Issues 10-11, pp. 1381–6.
PAGE | 85
IEA. All rights reserved.
The Future of Hydrogen |
Chapter 3: Storage, transmission and distribution of hydrogen |
Hansen, J.B. (2017), “Solid oxide cell enabled ammonia synthesis and ammonia based power production”, Haldor Topsøe A/S, https://nh3fuelassociation.org/wp-content/uploads/2017/11/NH3-Energy-2017- John-Hansen.pdf.
HyLaw (n.d.), Online Database, www.hylaw.eu/database#/database/gas-grid-issues/injection-of- hydrogen-at-transmission-level-for-energy-storage-and-enhancing-sustainabily.
Hypos (2017), “Hydrogen power and storage solutions in East Germany”, www.hypos- eastgermany.de/die-projektvorhaben/hypos-projekte/transport-und-speicherung/ (accessed 24 May 2019)
HyUnder (2014), “Assessment of the potential, the actors and relevant business cases for large scale and long term storage of renewable electricity by hydrogen underground storage in Europe (executive summary), http://hyunder.eu/wp-content/uploads/2016/01/D8.1_HyUnder-Executive- Summary.pdf.
IAE (Institute of Applied Energy) (2019), “Economical Evaluation and Characteristic Analyses for Energy Carrier Systems, Final Report 2016”, Japan, updated in 2019. Also presented in: Y. Mizuno et al., “Economic analysis on International Hydrogen Energy Carrier Supply Chains”, Journal of Japan Society of Energy and Resources, Vol. 38, No.3. pp.11. www.jstage.jst.go.jp/article/jjser/38/3/38_11/_article/-char/en
Jones, D. R., W. A. Al-Masryb and C. W. Dunnill (2018). “Hydrogen-enriched natural gas as a domestic fuel: an analysis based on flash-back and blow-off limits for domestic natural gas appliances within the UK” Sustainable Energy & Fuels, Vol. 2, pp. 710–23.
Kippers, M. J., J. C. De Laat and R. J. M. Hermkens (2011), “Pilot project on the hydrogen injection in natural gas on island of Ameland in the Netherlands”, International Gas Union Research Conference 2011, http://members.igu.org/old/IGU%20Events/igrc/igrc2011/igrc-2011-proceedings- and-presentations/poster%20paper-session%201/P1-34_Mathijs%20Kippers.pdf (accessed 5 April 2019).
Kouchachvili, L. and E. Entchev (2018), “Power to gas and H2/NG blend in SMART energy networks concept”, Renewable Energy, Vol. 125, pp. 456–64, doi:10.1016/j.renene.2018.02.088.
Kruck, O. et al. (2013) “Overview on all known underground storage technologies for hydrogen”, HyUnder, Huesca, Spain.
Lord, A.S., P. H. Kobos and D. J. Borns (2014), “Geologic storage of hydrogen: Scaling up to meet city transportation demands”, International Journal of Hydrogen Energy, Vol. 39, Issue 28, pp. 15570–82.
Melaina, M., O. Antonia, and M. Penev (2013), “Blending hydrogen into natural gas pipeline networks: A review of key issues”, National Renewable Energy Laboratory (TP-5600-51995), https://www.nrel.gov/docs/fy13osti/51995.pdf.
Müller-Syring, G. and M. Henel (2014), “Wasserstofftoleranz der Erdgasinfrastruktur inklusive aller assoziierten Anlagen” “[Hydrogen tolerance of the natural gas infrastructure including all associated facilities]”, DVGW, project number G 1-02-12: 46.
Netbeheer Nederland (2018), Toekomstbestendige gasdistributienetten [Future-proof gas distribution networks], www.netbeheernederland.nl/_upload/RadFiles/New/Documents/Kiwa%20- Toekomstbestendige%20gasdistributienetten%20-%20GT170272%20-%202018-07-05%20- D.._.pdf.
Ohlig, K. and L. Decker (2014), “The latest developments and outlook for hydrogen liquefaction technology”, AIP Conference Proceedings, Vol. 1573, Issue 1 , https://doi.org/10.1063/1.4860858.
Reitenbach, V. et al. (2015), “Influence of added hydrogen on underground gas storage: a review of key issues”, Environmental Earth Science, Vol. 73, pp. 6927–37, doi:10.1007/s12665-015-4176-2.
PAGE | 86
IEA. All rights reserved.
The Future of Hydrogen |
Chapter 3: Storage, transmission and distribution of hydrogen |
Roland Berger (2017), “Development of business cases for fuel cells and hydrogen applications for regions and cities: Hydrogen injection into the natural gas grid”, Fuel Cells and Hydrogen 2 Joint Undertaking, www.fch.europa.eu/sites/default/files/FCH%20Docs/171121_FCH2JU_ApplicationPackage_WG5_P2H_Hydrogen%20into%20gas%20grid%20%28ID%202910558%29%20%28ID%2 02911642%29.pdf (accessed 5 April 2019).
Reuß, M. et al. (2017), “Seasonal storage and alternative carriers: A flexible hydrogen supply chain model”, Applied Energy, Vol. 200, pp. 290–302, http://dx.doi.org/10.1016/j.apenergy.2017.05.050.
Reuß, M. et al. (2019), “A hydrogen supply chain with spatial resolution: Comparative analysis of infrastructure technologies in Germany”, Applied Energy, Vol. 247, pp. 438–53, https://doi.org/10.1016/j.apenergy.2019.04.064.
Shell (2017), Shell Hydrogen Study: Energy of the Future?, https://www.shell.de/medien/shell- publikationen/shell-hydrogen-study/_jcr_content/par/toptasks_e705.stream/ 1497968967778/1c581c203c88bea74d07c3e3855cf8a4f90d587e/shell-hydrogen-study.pdf, (accessed 5 April 2019).
Snam, IGU (International Gas Union) and BCG (Boston Consulting Group) (2018), Global Gas Report 2018, www.snam.it/export/sites/snam-rp/repository/file/gas_naturale/global-gas- report/global_gas_report_2018.pdf (accessed 5 April 2019).
Speirs, J. et al. (2017), A Greener Gas Grid: What are the Options? Sustainable Gas Institute, Imperial College London, www.sustainablegasinstitute.org/wp-content/uploads/2017/12/SGI-A-greener- gas-grid-what-are-the-options-WP3.pdf?noredirect=1 (accessed 5 April 2019).
Staffell, I. et al. (2019), “The role of hydrogen and fuel cells in the global energy system”, Energy and Environmental Science, Vol. 12, pp. 463–91, doi: 10.1039/C8EE01157E.
United Nations (2014), UN Regulation No. 110 – Compressed and Liquefied Natural Gas System Components, Addendum 109, Revision 3, Annex 3A, p. 62, www.unece.org/fileadmin/DAM/trans/main/wp29/wp29regs/2015/R110r3e.pdf.
Weidner, E. et al. (2016), “Sector Forum Energy Management/Working Group Hydrogen Final Report”, Joint Research Centre (JRC).
Wulf, C. and P. Zapp (2018), “Assessment of system variations for hydrogen transport by liquid organic hydrogen carriers”, International Journal of Hydrogen Energy, Vol. 43, pp. 11884–95, https://doi.org/10.1016/j.ijhydene.2018.01.198.
PAGE | 87
IEA. All rights reserved.

The Future of Hydrogen |
Chapter 4: Present and potential industrial uses of hydrogen |
Chapter 4: Present and potential industrial uses of hydrogen
•Hydrogen use today is dominated by industrial applications. The top four single uses of hydrogen today (in both pure and mixed forms) are: oil refining (33%), ammonia production (27%), methanol production (11%) and steel production via the direct reduction of iron ore (3%). Virtually all of this hydrogen is supplied using fossil fuels. These existing uses of hydrogen underpin many aspects of the global economy and our daily lives. Their future growth depends on the evolution of demand for downstream products, notably refined fuels for transport, fertilisers for food production, and construction materials for buildings.
•More than 60% of hydrogen used in refineries today is produced using natural gas. Tougher
air pollutant standards could increase the use of hydrogen in refining by 7% to 41 MtH2/yr by 2030, although further policy changes to curb increases in oil demand could dampen the pace of growth. Current global refining capacity is generally thought sufficient to meet rising oil demand, which implies that the majority of future hydrogen demand is likely to arise from existing facilities already equipped with hydrogen production units. This suggests an opportunity for retrofitting CCUS as a suitable option to reduce related emissions.
•Demand for ammonia and methanol is expected to increase over the short to medium term, with new capacity additions offering an important opportunity to scale up low-emissions hydrogen pathways. Greater efficiency can reduce overall levels of demand, but this will only partially offset demand growth. Whether via natural gas with CCUS or electrolysis, the technology is available to provide the additional hydrogen demand growth projected for
ammonia and methanol (up 14 MtH2/yr by 2030) in a low-carbon manner. As a priority, substituting low-emissions pathways for any further coal-based production without CCUS would significantly help cut emissions.
•In the longer term, steel and high-temperature heat production offer vast potential for lowemissions hydrogen demand growth. Assuming that the technological challenges that currently inhibit the widespread adoption of hydrogen in these areas can be overcome, the key challenges will be reducing costs and scaling up. In the long term it should be technically possible to produce all primary steel with hydrogen, but this would require vast amounts of lowcarbon electricity (around 2 500 TWh/yr, or around 10% of global electricity generation today) and would only be economic without policy support at very low electricity prices.
PAGE | 89
IEA. All rights reserved.

The Future of Hydrogen |
Chapter 4: Present and potential industrial uses of hydrogen |
Most hydrogen today is used in three industrial sectors: oil refining, chemicals and iron and steel. Production of hydrogen to meet the needs of these sectors is at a commercial scale and is almost entirely from natural gas, coal and oil today, with associated environmental impacts. However, the technologies are available to avoid the emissions from this fossil fuel use by producing and supplying low-carbon hydrogen. In some cases these alternatives are already deployed where policy and economics are supportive. Table 4 provides an overview of the current and likely future industrial uses of hydrogen.
This chapter explores how hydrogen is currently used in the refining, chemicals and iron and steel sectors. It reviews the current trends for hydrogen demand in these sectors and the options for addressing the emissions related to supplying hydrogen for these existing uses. It concludes with a discussion of the ways in which significant new markets for hydrogen in industrial applications could emerge if hydrogen were used to satisfy a much higher share of the inputs to steelmaking globally or as a source of high-temperature heat with no direct emissions.
Table 4. |
Summary of hydrogen use in industrial applications and future potential |
|
|
|||||||||||||
|
|
|
|
|
|
|
|
|
|
|
|
|
|
|
|
|
|
|
|
Current |
|
|
2030 |
|
|
Long-term |
|
|
Low-carbon hydrogen supply |
|
|||
|
Sector |
|
|
|
hydrogen |
|
|
|
||||||||
|
|
|
|
|
|
|
|
|
|
|
|
|
||||
|
|
hydrogen role |
|
|
|
|
demand |
|
|
|
|
|
|
|
||
|
|
|
|
|
|
|
|
Opportunities |
|
|
Challenges |
|
||||
|
|
|
|
|
demand |
|
|
|
|
|
|
|
||||
|
|
|
|
|
|
|
|
|
|
|
|
|
|
|||
|
|
|
|
|
|
|
|
|
|
|
|
|
|
|
|
|
|
|
|
|
|
|
|
|
|
|
|
|
|
|
|
Hydrogen |
|
|
|
|
Used primarily |
|
|
7% increase |
|
|
|
|
|
Retrofit natural |
|
|
production and |
|
|
|
|
to remove |
|
|
under existing |
|
|
Highly |
|
|
|
|
use is closely |
|
|
|
|
|
|
|
|
|
|
|
gas or coal- |
|
|
|
||||
|
|
|
impurities (e.g. |
|
|
policies. |
|
|
dependent on |
|
|
|
|
integrated within |
|
|
|
|
|
|
|
|
|
|
|
based hydrogen |
|
|
|
||||
|
|
|
sulphur) from |
|
|
Boosted by |
|
|
future oil |
|
|
|
|
refining |
|
|
|
|
|
|
|
|
|
|
|
with CCUS. |
|
|
|
||||
|
|
|
crude oil and |
|
|
tighter |
|
|
demand but |
|
|
|
|
operations, |
|
|
|
|
|
|
|
|
|
|
|
Replace |
|
|
|
||||
|
|
|
upgrade |
|
|
pollutant |
|
|
likely to remain a |
|
|
|
|
making a tough |
|
|
|
Oil refining |
|
|
|
|
|
|
|
merchant |
|
|
|
||||
|
|
heavier crude. |
|
|
regulations, |
|
|
large source of |
|
|
|
|
business case for |
|
||
|
|
|
|
|
|
|
|
|
hydrogen |
|
|
|
||||
|
|
|
Used in |
|
|
but |
|
|
demand in 2050, |
|
|
|
|
replacing existing |
|
|
|
|
|
|
|
|
|
|
|
purchases with |
|
|
|
||||
|
|
|
smaller |
|
|
moderated by |
|
|
even in a Paris- |
|
|
|
|
capacity. |
|
|
|
|
|
|
|
|
|
|
|
hydrogen from |
|
|
|
||||
|
|
|
volumes for oil |
|
|
lower oil |
|
|
compatible |
|
|
|
|
Hydrogen costs |
|
|
|
|
|
|
|
|
|
|
|
low-carbon |
|
|
|
||||
|
|
|
sands and |
|
|
demand |
|
|
pathway. |
|
|
|
|
strongly |
|
|
|
|
|
|
|
|
|
|
|
electricity. |
|
|
|
||||
|
|
|
biofuels. |
|
|
growth. |
|
|
|
|
|
|
|
influence refining |
|
|
|
|
|
|
|
|
|
|
|
|
|
|
|
|
|||
|
|
|
|
|
|
|
|
|
|
|
|
|
|
|
margins. |
|
|
|
|
|
|
|
|
|
|
Hydrogen |
|
|
|
|
|
|
|
|
|
|
|
|
|
|
|
|
demand for |
|
|
Retrofit or new- |
|
|
|
|
|
|
|
|
|
|
|
|
|
existing uses set |
|
|
|
|
|
|
|
|
|
|
|
|
|
|
|
|
|
|
build hydrogen |
|
|
|
|
|
|
|
|
Central to |
|
31% increase |
|
to grow despite |
|
|
|
|
Competitiveness |
||||
|
|
|
|
|
|
|
with CCUS. Use |
|
|
|||||||
|
|
|
ammonia and |
|
under existing |
|
materials |
|
|
|
|
of low-carbon |
||||
|
|
|
|
|
|
|
low-carbon |
|
|
|||||||
|
|
|
methanol |
|
policies for |
|
efficiency |
|
|
|
|
hydrogen |
||||
|
|
|
|
|
|
|
hydrogen for |
|
|
|||||||
|
|
|
production, |
|
ammonia and |
|
(including |
|
|
|
|
supplies depends |
||||
|
Chemical |
|
|
|
|
|
ammonia and |
|
|
|||||||
|
|
and used in |
|
methanol due |
|
recycling); new |
|
|
|
|
on gas and |
|||||
|
production |
|
|
|
|
|
methanol |
|
|
|||||||
|
|
several other |
|
to economic |
|
ammonia and |
|
|
|
|
electricity prices. |
|||||
|
|
|
|
|
|
|
production (urea |
|
|
|||||||
|
|
|
smaller-scale |
|
and |
|
methanol |
|
|
|
|
CCUS retrofitting |
||||
|
|
|
|
|
|
|
and methanol |
|
|
|||||||
|
|
|
chemical |
|
population |
|
demand could |
|
|
|
|
is not a universal |
||||
|
|
|
|
|
|
|
will still require a |
|
|
|||||||
|
|
|
processes. |
|
growth. |
|
arise for clean |
|
|
|
|
option. |
||||
|
|
|
|
|
|
|
source of |
|
|
|||||||
|
|
|
|
|
|
|
|
|
uses as |
|
|
|
|
|
|
|
|
|
|
|
|
|
|
|
|
|
|
carbon). |
|
|
|
|
|
|
|
|
|
|
|
|
|
|
hydrogen-based |
|
|
|
|
|
|
|
|
|
|
|
|
|
|
|
|
|
|
|
|
|
|
|
|
|
|
|
|
|
|
|
|
|
fuels. |
|
|
|
|
|
|
|
PAGE | 90
IEA. All rights reserved.