

01 POWER ISLAND / 02 H2+NH3 / The_Future_of_Hydrogen-IEA-2020
.pdfThe Future of Hydrogen |
Chapter 2: Producing hydrogen and hydrogen-based products |
Figure 15. Hydrogen production costs in China today
USD/kgH2
7
6
5
4
3
2
1
0
Grid electricity Renewable |
Natural gas Natural gas |
Coal |
Coal with |
electricity |
with CCUS |
|
CCUS |
35 |
2 |
|
|
30 |
/kgH |
|
|
2 |
|
|
|
25 |
kgCO |
|
Fuel costs |
|
|
||
|
|
20 |
|
OPEX |
|
||
|
||
|
|
|
15 |
|
CAPEX |
|
||
|
||
|
CO intensity |
|
|
|
|
10 |
|
|
5 |
|
|
0 |
|
|
Notes: CAPEX of coal with CCUS = USD 1 475/kWH2. Renewable electricity costs = USD 30/MWh at 4 000 full load hours. More information on the underlying assumptions is available at www.iea.org/hydrogen2019.
Source: IEA 2019. All rights reserved.
Coal-based hydrogen with CCUS is likely to remain the lowest-cost clean hydrogen production route in China for the near term.
Reducing the carbon footprint will be a critical factor for the prospects of coal-based hydrogen in a low-carbon context. Adding CCUS to coal-based hydrogen production is expected to increase CAPEX and fuel costs by 5% and OPEX by 130%. In China and India, with their established coal mining infrastructure and the lack of availability of cheap domestic natural gas, coal-based hydrogen equipped with CCUS is likely to be at least in the medium term the cheapest option for clean hydrogen production.
Hydrogen from biomass
Hydrogen can be produced from biomass in different ways. In biochemical routes, microorganisms work on organic material to produce biogas (a process referred to as anaerobic digestion) or a combination of acids, alcohols and gases (fermentation). Thermochemical gasification of biomass is a process that works much like coal gasification to convert biomass to a mix of carbon monoxide, CO2, hydrogen and methane. Anaerobic digestion to produce biogas is the most technically mature of these processes, but can only process sewage sludge, agricultural, food processing and household waste, and some energy crops. Fermentation can process the non-edible cellulosic part of some plants. Gasification could potentially convert all organic matter, and in particular the lignin component of biomass. Although there are a number of biomass gasification demonstration plants in the world, the technology is not yet fully developed, and the problem of the formation of tars that may cause catalyst poisoning has not been fully resolved yet (Ericsson, 2017). In all cases, the produced gas would need to be further processed to extract hydrogen.
The complex processing of biomass means that it is generally a more expensive way of producing low-carbon hydrogen than solaror wind-based electrolysis. The potential for largescale biomass-based hydrogen production is also be limited by the availability of cheap biomass. For example, satisfying a theoretical hydrogen demand of 60 MtH2 in the US market –
PAGE | 51
IEA. All rights reserved.
The Future of Hydrogen |
Chapter 2: Producing hydrogen and hydrogen-based products |
corresponding to four times the United States’ current hydrogen demand – would require almost 100% of its technical biomass potential, but only 6% of its wind power, and less than 1% of its solar power potential (Ruth, Jadun and Pivovar, 2017). Combining hydrogen production from biomass with carbon capture and storage could, however, be an option to create so-called “negative emissions”, which may have a role to play in the future.11
Comparison between alternative hydrogen production pathways
In the near term – that is, until 2030 – the cost advantage of fossil fuels is likely to continue in most places, with hydrogen from natural gas without CCUS costing in the range of USD 1–2/kgH2, depending on local gas prices.12
Except in the case of hydrogen produced from coal, fuel costs are the biggest single component of hydrogen production costs (Figure 16). Future hydrogen costs will therefore largely be influenced by electricity and gas costs, or parameters influencing these costs such as conversion efficiencies. Electrolysis production costs can also be sensitive to CAPEX requirements, in particular if plants are operating at low full load hours.
Figure 16. Hydrogen production costs for different technology options, 2030
2 |
7 |
|
|
|
|
|
|
|
|
|
|
|
|
|
|
|
|
|
|
|
|
|
|
|
|
|
|
|
|
|
|
|
|
|
|
|
|
|
|
|
|
|
|
|
|
|
|
|
|
|
|
|
|
|
|
|
|
|
|
|
|
|
|
|
|
|
|
|
|
|
|
|
|
|
|
|
|
|
|
|
|
|
|
|
|
|
|
|
|
|
|
|
|
|
|
|
|
|
|
|
|
|
|
|
|
|
|
|
|
|
|
|
|
|
|
|
|
|
|
|
|
|
|
|
|
|
|
|
|
|
|
|
|
|
|
|
|
|
|
|
|
|
|
|
|
|
|
|
|
|
|
|
|
||
USD/kgH |
6 |
|
|
|
|
|
|
|
|
|
|
|
|
|
|
|
|
|
|
|
|
|
|
|
|
|
|
|
|
|
|
|
|
|
|
|
|
|
|
|
|
|
|
|
|
|
|
|
|
|
|
|
|
|
|
|
|
|
|
|
|
|
|
|
|
|
|
|
|
|
|
|
|
|
|
Combined sensitivity |
|
|
|
|
|
|
|
|
|
|
|
|
|
|
|
|
|
|
|
|
|
|
|
|
|
|
|
|
|
|
|
|
|
|
|
|
|
|
|
|
|
|
|
|
|
|
|
|
|
|
|
|
|
|
|
|
|
|
|
|
|
|
|
|
|
|
|
|
|
|
|
|
|
|
|
|
|||
|
|
|
|
|
|
|
|
|
|
|
|
|
|
|
|
|
|
|
|
|
|
|
|
|
|
|
|
|
|
|
|
|
|
|
|
|
|
|
|
|
|
|
|
|
|
|
|
|
|
|
|
|
|
|
|
|
|
|
|
|
|
|
|
|
|
|
|
|
|
|
|
|
|
|
|||
|
|
|
|
|
|
|
|
|
|
|
|
|
|
|
|
|
|
|
|
|
|
|
|
|
|
|
|
|
|
|
|
|
|
|
|
|
|
|
|
|
|
|
|
|
|
|
|
|
|
|
|
|
|
|
|
|
|
|
|
|
|
|
|
|
|
|
|
|
|
|
|
|
|
|
|
CO price sensitivity |
|
|
5 |
|
|
|
|
|
|
|
|
|
|
|
|
|
|
|
|
|
|
|
|
|
|
|
|
|
|
|
|
|
|
|
|
|
|
|
|
|
|
|
|
|
|
|
|
|
|
|
|
|
|
|
|
|
|
|
|
|
|
|
|
|
|
|
|
|
|
|
|
|
|
|
|
|
|
|
|
|
|
|
|
|
|
|
|
|
|
|
|
|
|
|
|
|
|
|
|
|
|
|
|
|
|
|
|
|
|
|
|
|
|
|
|
|
|
|
|
|
|
|
|
|
|
|
|
|
|
|
|
|
|
|
|
|
|
|
|
|
|
|
|
|
|
|
|
|
|
|
|
|
|
|
|
||
|
|
|
|
|
|
|
|
|
|
|
|
|
|
|
|
|
|
|
|
|
|
|
|
|
|
|
|
|
|
|
|
|
|
|
|
|
|
|
|
|
|
|
|
|
|
|
|
|
|
|
|
|
|
|
|
|
|
|
|
|
|
|
|
|
|
|
|
|
|
|
|
|
|
|
CAPEX and OPEX sensitivity |
||
|
4 |
|
|
|
|
|
|
|
|
|
|
|
|
|
|
|
|
|
|
|
|
|
|
|
|
|
|
|
|
|
|
|
|
|
|
|
|
|
|
|
|
|
|
|
|
|
|
|
|
|
|
|
|
|
|
|
|
|
|
|
|
|
|
|
|
|
|
|
|
|
|
|
|
|
|
||
|
|
|
|
|
|
|
|
|
|
|
|
|
|
|
|
|
|
|
|
|
|
|
|
|
|
|
|
|
|
|
|
|
|
|
|
|
|
|
|
|
|
|
|
|
|
|
|
|
|
|
|
|
|
|
|
|
|
|
|
|
|
|
|
|
|
|
|
|
|
|
|
|
|||||
|
|
|
|
|
|
|
|
|
|
|
|
|
|
|
|
|
|
|
|
|
|
|
|
|
|
|
|
|
|
|
|
|
|
|
|
|
|
|
|
|
|
|
|
|
|
|
|
|
|
|
|
|
|
|
|
|
|
|
|
|
|
|
|
|
|
|
|
|
|
|
|
|
|||||
|
|
|
|
|
|
|
|
|
|
|
|
|
|
|
|
|
|
|
|
|
|
|
|
|
|
|
|
|
|
|
|
|
|
|
|
|
|
|
|
|
|
|
|
|
|
|
|
|
|
|
|
|
|
|
|
|
|
|
|
|
|
|
|
|
|
|
|
|
|
|
|
|
|
|
Fuel cost sensitivity |
||
|
3 |
|
|
|
|
|
|
|
|
|
|
|
|
|
|
|
|
|
|
|
|
|
|
|
|
|
|
|
|
|
|
|
|
|
|
|
|
|
|
|
|
|
|
|
|
|
|
|
|
|
|
|
|
|
|
|
|
|
|
|
|
|
|
|
|
|
|
|
|
|
|
|
|
|
|
||
|
|
|
|
|
|
|
|
|
|
|
|
|
|
|
|
|
|
|
|
|
|
|
|
|
|
|
|
|
|
|
|
|
|
|
|
|
|
|
|
|
|
|
|
|
|
|
|
|
|
|
|
|
|
|
|
|
|
|
|
|
|
|
|
|
|
|
|
|
|
|
|
|
|||||
|
|
|
|
|
|
|
|
|
|
|
|
|
|
|
|
|
|
|
|
|
|
|
|
|
|
|
|
|
|
|
|
|
|
|
|
|
|
|
|
|
|
|
|
|
|
|
|
|
|
|
|
|
|
|
|
|
|
|
|
|
|
|
|
|
|
|
|
|
|
|
|
|
|
|
WACC sensitivity |
||
|
2 |
|
|
|
|
|
|
|
|
|
|
|
|
|
|
|
|
|
|
|
|
|
|
|
|
|
|
|
|
|
|
|
|
|
|
|
|
|
|
|
|
|
|
|
|
|
|
|
|
|
|
|
|
|
|
|
|
|
|
|
|
|
|
|
|
|
|
|
|
|
|
|
|
|
|
||
|
|
|
|
|
|
|
|
|
|
|
|
|
|
|
|
|
|
|
|
|
|
|
|
|
|
|
|
|
|
|
|
|
|
|
|
|
|
|
|
|
|
|
|
|
|
|
|
|
|
|
|
|
|
|
|
|
|
|
|
|
|
|
|
|
|
|
|
|
|
|
|
|
|
|
CO price |
||
|
|
|
|
|
|
|
|
|
|
|
|
|
|
|
|
|
|
|
|
|
|
|
|
|
|
|
|
|
|
|
|
|
|
|
|
|
|
|
|
|
|
|
|
|
|
|
|
|
|
|
|
|
|
|
|
|
|
|
|
|
|
|
|
|
|
|
|
|
|
|
|
|
|
|
|||
|
|
|
|
|
|
|
|
|
|
|
|
|
|
|
|
|
|
|
|
|
|
|
|
|
|
|
|
|
|
|
|
|
|
|
|
|
|
|
|
|
|
|
|
|
|
|
|
|
|
|
|
|
|
|
|
|
|
|
|
|
|
|
|
|
|
|
|
|
|
|
|
|
|
|
|||
|
1 |
|
|
|
|
|
|
|
|
|
|
|
|
|
|
|
|
|
|
|
|
|
|
|
|
|
|
|
|
|
|
|
|
|
|
|
|
|
|
|
|
|
|
|
|
|
|
|
|
|
|
|
|
|
|
|
|
|
|
|
|
|
|
|
|
|
|
|
|
|
|
|
|
|
|
||
|
|
|
|
|
|
|
|
|
|
|
|
|
|
|
|
|
|
|
|
|
|
|
|
|
|
|
|
|
|
|
|
|
|
|
|
|
|
|
|
|
|
|
|
|
|
|
|
|
|
|
|
|
|
|
|
|
|
|
|
|
|
|
|
|
|
|
|
|
|
|
|
|
|
|
Fuel costs |
||
|
|
|
|
|
|
|
|
|
|
|
|
|
|
|
|
|
|
|
|
|
|
|
|
|
|
|
|
|
|
|
|
|
|
|
|
|
|
|
|
|
|
|
|
|
|
|
|
|
|
|
|
|
|
|
|
|
|
|
|
|
|
|
|
|
|
|
|
|
|
|
|
|
|
|
|||
|
|
|
|
|
|
|
|
|
|
|
|
|
|
|
|
|
|
|
|
|
|
|
|
|
|
|
|
|
|
|
|
|
|
|
|
|
|
|
|
|
|
|
|
|
|
|
|
|
|
|
|
|
|
|
|
|
|
|
|
|
|
|
|
|
|
|
|
|
|
|
|
|
|
|
|||
|
|
|
|
|
|
|
|
|
|
|
|
|
|
|
|
|
|
|
|
|
|
|
|
|
|
|
|
|
|
|
|
|
|
|
|
|
|
|
|
|
|
|
|
|
|
|
|
|
|
|
|
|
|
|
|
|
|
|
|
|
|
|
|
|
|
|
|
|
|
|
|||||||
|
|
|
|
|
|
|
|
|
|
|
|
|
|
|
|
|
|
|
|
|
|
|
|
|
|
|
|
|
|
|
|
|
|
|
|
|
|
|
|
|
|
|
|
|
|
|
|
|
|
|
|
|
|
|
|
|
|
|
|
|
|
|
|
|
|
|
|
|
|
|
|
|
|
|
|||
|
0 |
|
|
|
|
|
|
|
|
|
|
|
|
|
|
|
|
|
|
|
|
|
|
|
|
|
|
|
|
|
|
|
|
|
|
|
|
|
|
|
|
|
|
|
|
|
|
|
|
|
|
|
|
|
|
|
|
|
|
|
|
|
|
|
|
|
|
|
|
|
|
|
|
|
|
OPEX |
|
|
|
|
|
|
|
|
|
|
|
|
|
|
|
|
|
|
|
|
|
|
|
|
|
|
|
|
|
|
|
|
|
|
|
|
|
|
|
|
|
|
|
|
|
|
|
|
|
|
|
|
|
|
|
|
|
|
|
|
|
|
|
|
|
|
|
|
|
|
|
|
|
|
|
|
|||
|
|
|
|
|
|
|
|
|
|
|
|
|
|
|
|
|
|
|
|
|
|
|
|
|
|
|
|
|
|
|
|
|
|
|
|
|
|
|
|
|
|
|
|
|
|
|
|
|
|
|
|
|
|
|
|
|
|
|
|
|
|
|
|
|
|
|
|
|
|
|
|
|
|
|
|||
|
|
Electrolysis |
Electrolysis |
|
Natural gas |
|
Natural gas |
Coal without |
|
|
|
Coal with |
|
|
CAPEX |
||||||||||||||||||||||||||||||||||||||||||||||||||||||||||||||
|
|
|
|
|
|
|
|
|
|||||||||||||||||||||||||||||||||||||||||||||||||||||||||||||||||||||
|
|
|
|
|
|
|
|
|
|||||||||||||||||||||||||||||||||||||||||||||||||||||||||||||||||||||
|
|
|
|
|
|
|
|
|
|
|
|||||||||||||||||||||||||||||||||||||||||||||||||||||||||||||||||||
|
|
|
|
|
grid |
renewable |
without CCUS |
|
|
with CCUS |
|
|
|
|
CCUS |
|
|
|
|
CCUS |
|
|
|
|
|||||||||||||||||||||||||||||||||||||||||||||||||||||
Notes: WACC = weighted average cost of capital. Assumptions refer to Europe in 2030. Renewable electricity price = USD 40/MWh at 4 000 full load hours at best locations; sensitivity analysis based on +/-30% variation in CAPEX, OPEX and fuel costs; +/-3% change in default WACC of 8% and a variation in default CO2 price of USD 40/tCO2 to USD 0/tCO2 and USD 100/tCO2. More information on the underlying assumptions is available at www.iea.org/hydrogen2019.
Source: IEA 2019. All rights reserved.
In the near term, hydrogen production from fossil fuels will remain the most cost-competitive option in most cases.
11By combining the use of bioenergy and CCUS, CO2 formed during bioenergy conversion processes can be captured and injected into long-term geological storage. This provides the possibility to effectively remove CO2 from the atmosphere while producing energy.
12Just taking into account the LHV energy content of 1 kgH2, i.e. ignoring any later uses of hydrogen, a cost of USD 1/kgH2 corresponds to USD 30/MWh, or in barrels of oil equivalent to almost USD 50 per barrel (bbl).
PAGE | 52
IEA. All rights reserved.

The Future of Hydrogen |
Chapter 2: Producing hydrogen and hydrogen-based products |
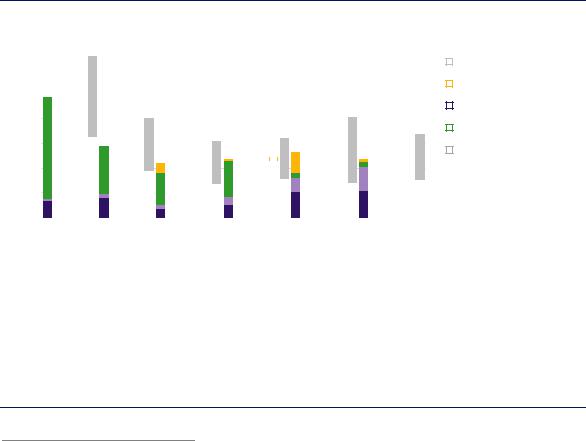
The CO2 impact of different hydrogen production technologies varies widely (Figure 17). The carbon intensity of hydrogen from natural gas without CCUS is roughly half that of coal without CCUS. The CO2 intensity of electrolysis depends on the CO2 intensity of the electricity input. The conversion losses during electricity generation mean that using electricity from natural gas or coal power plants would result in higher CO2 intensities than directly using natural gas or coal for hydrogen production. This means that for electrolysis to have the same or lower CO2 intensity as hydrogen production from natural gas without CCUS, the CO2 intensity of electricity has to be below 185 grams of carbon dioxide per kilowatt hour (gCO2/kWh), just above half the emissions of a modern combined-cycle gas power plant.
Figure 17. CO2 intensity of hydrogen production
Notes: Capture rate of 56% for natural gas with CCUS refers to capturing only the feedstock-related CO2, whereas for 90% capture rate CCUS is also applied to the fuel-related CO2 emissions; CO2 intensities of electricity taking into account only direct CO2 emissions at the electricity generation plant: world average 2017 = 491 gCO2/kWh, gas-fired power generation = 336 gCO2/kWh, coalfired power generation = 760 gCO2/kWh. The CO2 intensities for hydrogen also do not include CO2 emissions linked to the transmission and distribution of hydrogen to the end users, e.g. from grid electricity used for hydrogen compression. More information on the underlying assumptions is available at www.iea.org/hydrogen2019.
Source: IEA 2019. All rights reserved.
The CO2 intensity of hydrogen directly from natural gas is half of that from coal and nearly half that from gas-fired electricity; the CO2 intensity of electrolysis depends on the CO2 intensity of the electricity.
Low-carbon hydrogen produced with CCUS or from renewable electricity is in most cases currently more costly than hydrogen generated from unabated fossil fuels. The cost of hydrogen produced from natural gas is generally around USD 1.5–3/kgH2, while for hydrogen generated from renewable electricity (solar PV or onshore wind) it is generally around USD 2.5–6/kgH2. Making hydrogen from natural gas with CCUS in the Middle East competitive with unabated fossil fuel hydrogen production would require a CO2 price of around USD 50/tCO2, or an equivalent cost benefit for the CCUS option.
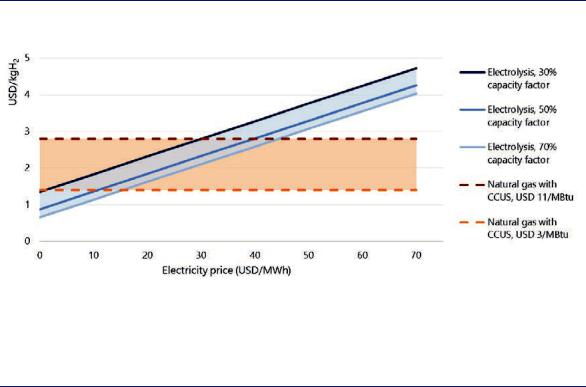
The future competitiveness of low-carbon hydrogen produced from natural gas with CCUS or from renewable electricity (from solar PV or onshore wind) mainly depends on gas and electricity prices. At low gas prices, renewable electricity must reach a cost range below USD 10/MWh for electrolysis to become cost-competitive with natural gas with CCUS. Higher gas prices would make higher-cost renewable electricity cost-competitive: at a gas price of USD 11/MBtu, renewable electricity would be competitive at up to around USD 30–45/MWh (Figure 18).
PAGE | 53
IEA. All rights reserved.
The Future of Hydrogen |
Chapter 2: Producing hydrogen and hydrogen-based products |
Figure 18. Comparison of hydrogen production costs from electricity and natural gas with CCUS in the near term
Notes: More information on the underlying assumptions is available at www.iea.org/hydrogen2019.
Source: IEA 2019. All rights reserved.
Depending on local gas prices, electricity at USD 1040/MWh and at full load hours of around 4 000 hours are needed for water electrolysis to become cost-competitive with natural gas with CCUS.
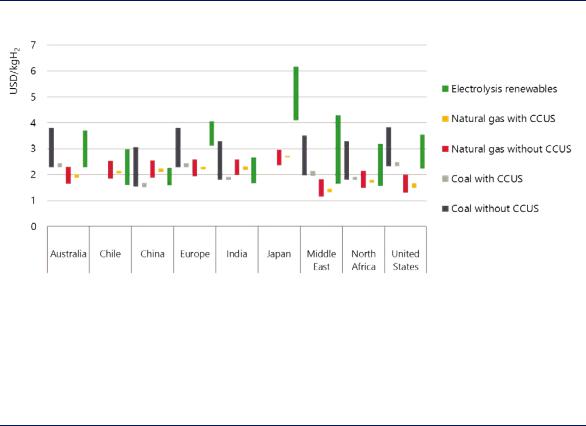
The impact of renewable electricity and gas costs on hydrogen production costs becomes apparent when looking at specific countries (Figure 19). In countries with good renewable resources, but dependent on natural gas imports, in particular in the form of liquefied natural gas, producing hydrogen from renewables may be cheaper than producing it from natural gas, while production from natural gas with CCUS may be the cheaper option in regions with cheap domestic gas resources and CO2 storage availability.
Other factors are also relevant to the choice between alternative low-carbon hydrogen production options. For hydrogen production from fossil fuels in combination with CO2 storage, the geological availability and public acceptance of CO2 storage are prerequisites. For water electrolysis, access to adequate supplies of water is a prerequisite, even if the costs for water treatment (e.g. seawater desalination) are only a small fraction of the total hydrogen production costs. Countries could also consider importing hydrogen or hydrogen-based products if they are available at a lower price than domestic alternatives, as discussed in more detail in Chapter 3.
From an investment viewpoint, the scale of investment is also relevant. While CCUS plants require a certain scale to justify the investment in CO2 transport and storage infrastructure, electrolysers operate at a smaller scale using more modular technology, which can be gradually expanded and adjusted to demand. For example, the H21 North of England project in the UK plans to produce hydrogen from twelve ATR units with CCUS, each with a capacity of around 1 350 MWH2 and requiring an investment of around USD 945 million per unit, whereas the largest electrolyser module offered today is 20 MWe (14 MWH2), requiring investment of around USD 18 million (or USD 280 million for 220 MWH2).
PAGE | 54
IEA. All rights reserved.
The Future of Hydrogen |
Chapter 2: Producing hydrogen and hydrogen-based products |
Figure 19. Hydrogen production costs in different parts of the world
Notes: Bars indicate range between nearand long-term hydrogen production costs, which include a CO2 price of USD 25/t CO2 in the near term and USD 100/tCO2 in the long term. For options from coal and natural gas, the higher value indicates the long-term costs (due to the increasing CO2 price), whereas for hydrogen from renewable electricity the lower value indicates the long-term costs.
Source: IEA 2019. All rights reserved.
In countries relying on gas imports and characterised by good renewable resources, clean hydrogen production from renewable electricity can compete effectively with production that relies on natural gas.
Converting hydrogen to hydrogen-based fuels and feedstocks that are easier to store, transport and use
Hydrogen has low energy density, which makes it more challenging to store and transport than fossil fuels. However, it can be converted into hydrogen-based fuels and feedstocks, such as synthetic methane, synthetic liquid fuels and ammonia, which can make use of existing infrastructure for their transport, storage and distribution. This can reduce the costs of reaching final users. Some of the synthetic hydrocarbons produced from hydrogen can be direct substitutes for their fossil equivalents. Ammonia is already used today as a feedstock in the chemical industry (see Chapter 4) and could be a hydrogen carrier for the long-distance transport of hydrogen in the future (see Chapter 3), or itself be used as fuel in the shipping sector (see Chapter 5).
The potential benefits and opportunities of these hydrogen-based fuels and feedstocks have to be weighed, however, against the costs of converting hydrogen into these products. Many of the technology pathways to produce these fuels and feedstocks are at an early demonstration stage, resulting in high costs. Producing ammonia requires the separation of nitrogen from the air, while the production of synthetic hydrocarbons requires carbon as an input, which has implications for the cost of production, while the origin of the carbon also affects the environmental impact and the carbon intensity of the synthetic hydrocarbon.
PAGE | 55
IEA. All rights reserved.
The Future of Hydrogen |
Chapter 2: Producing hydrogen and hydrogen-based products |
Technology options
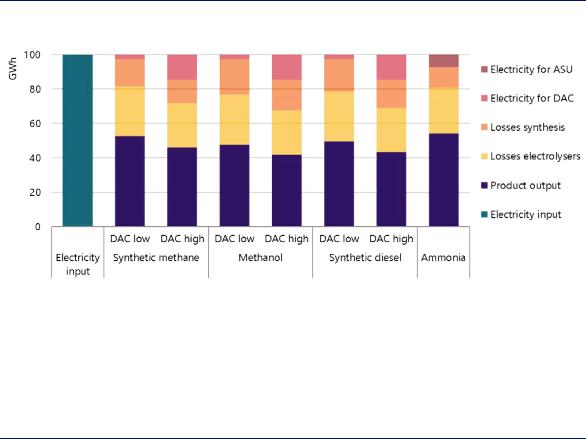
Various pathways exist to convert hydrogen into fuels and feedstocks that can be more easily handled, transported and used. Ammonia can be produced by combining hydrogen and nitrogen, and synthetic hydrocarbons, such as methane, methanol, diesel or jet fuel, can be produced by combining hydrogen with carbon in the form of CO2. However, for pathways based on electrolytic hydrogen, much of the electricity used to convert hydrogen into fuels and feedstocks is lost during the process of conversion (Figure 20).
Figure 20. Outputs and losses of different pathways for hydrogen-based fuels and feedstocks from electrolytic hydrogen
Notes: ASU = air separation unit (for nitrogen production); DAC = direct air capture; GWh = gigawatt hour. The energy contents of the outputs (methane, methanol, diesel and ammonia) are based on their LHVs. For methane, methanol and diesel, DAC has been assumed here as the source of CO2 feedstocks, with electricity needs of 250 kWh per tCO2 for low-temperature DAC (DAC low) and 1 750 kWh per tCO2 for high-temperature DAC (DAC high). Low-temperature DAC also requires heat of 1 535 kWh per tCO2, which could be covered in large part by the shown synthesis heat losses.
Source: IEA 2019. All rights reserved.
Around 45–60% of the electricity used for the production of synthetic hydrocarbons or ammonia is lost during the process.
Ammonia
Ammonia is a compound of nitrogen and hydrogen and therefore does not generate CO2 emissions when combusted. It is a gas at normal temperature and pressure, but can be liquefied at -33°C, a temperature that is not too difficult to reach. Liquid ammonia has a 50% higher volumetric energy density than liquid hydrogen. Ammonia has been used as a refrigerant for 170 years, and as a chemical feedstock for nitrogen fertilisers and explosives for a century. Industry is used to storing and transporting it, including in oceangoing tankers. Ammonia can, in principle, be used as a fuel in various energy applications (e.g. for co-firing in coal power plants), but none of these applications is being commercially used today. The toxicity of ammonia means that its handling requires care and would likely be limited to professionally trained operators, potentially restricting its techno-economic potential.
Ammonia has been made with hydrogen from electrolysers running on hydropower and nitrogen from ASUs since the 1920s, with a few plants in Norway feeding the entire European demand for nitrogen fertilisers (IEA, 2017). New projects are, however, now underway to
PAGE | 56
IEA. All rights reserved.

The Future of Hydrogen |
Chapter 2: Producing hydrogen and hydrogen-based products |
produce ammonia from renewable electricity. For example, a commercial-scale ammonia plant with a production capacity of 50 tonnes ammonia per day and an electrolyser capacity of 30 MWe is being built in Port Lincoln in South Australia, and will be powered by wind and solar electricity (Ammonia Industry, 2018).
Synthetic hydrocarbons
Hydrogen can be combined with CO2 to produce synthetic hydrocarbons such as methane, or synthetic liquid fuels such as methanol, diesel, gasoline and jet fuel. Some of these products have higher energy densities than hydrogen or ammonia:
Synthetic methane: This can be directly produced from CO2 and hydrogen in a methanation process. Applications of the methanation process today rely mostly on catalytic (thermochemical) methanation. Biological methanation is also possible, in which
microorganisms in an anaerobic environment convert hydrogen and CO2 into methane, but this is at an earlier stage of development. The majority of the projects for hydrogen-based fuels and feedstocks have so far been aimed at producing synthetic methane, with almost 70 demonstration plants (Figure 21). Most of these are located in Germany and other European countries.
Figure 21. Number of new projects for making various hydrogen-based fuels and feedstocks from electrolytic hydrogen
Sources: IEA analysis based on Chehade et al. (2019), “Review and analysis of demonstration projects on Power-to-X pathways in the world”, IEA (2018), World Energy Investment, and the World Energy Council (2018), “Hydrogen an enabler of the Grand Transition” and data provided by IEA Hydrogen Technology Collaboration Programme.
The majority of the pilot and demonstration projects for hydrogen-based fuels and feedstocks produce synthetic methane.
Synthetic diesel or kerosene: The production of synthetic diesel or kerosene requires hydrogen and carbon monoxide as inputs. Since carbon monoxide is generally not easily
available, CO2 can be used instead. This CO2 is first converted into carbon monoxide, and the resulting synthesis gas of carbon monoxide and hydrogen is then converted (via
PAGE | 57
IEA. All rights reserved.

The Future of Hydrogen |
Chapter 2: Producing hydrogen and hydrogen-based products |
Fischer-Tropsch [FT] synthesis)13 to raw liquid fuels and, with further upgrading, into synthetic diesel or kerosene. FT synthesis is relatively slow and requires costly investment.
Synthetic methanol: Methanol is the simplest alcohol. It has an energy content equal to 19.9 megajoules per kilogram (LHV) and a 80% higher energy density than liquid hydrogen. As a liquid it is easily transportable, like other common petroleum fuels. It is as toxic as common liquid petroleum fuels, but unlike them it is not carcinogenic or mutagenic. Methanol is soluble in water and is biodegradable, and its production from synthesis gas is fully commercial. Around 40% of global methanol production today is used for energy purposes, but methanol can also be used as the building block for synthesising a range of chemicals, e.g. for the production of plastics.
Significant amounts of electricity and generation capacity are required for the production of synthetic hydrocarbons because of the low overall efficiency of production processes. Around 1 000 TWh and 700 TWh of electricity would be needed as input for synthetic hydrocarbons to provide just 1% of current global oil and global gas production respectively, representing around 4% and 3% of global electricity generation in 2018. This would require 600 GW and 400 GW of solar PV capacity at a capacity factor of 20%, or 340 GW and 230 GW of onshore wind capacity at a capacity factor of 35%.
The production of synthetic hydrocarbon from hydrogen uses CO2 as input, which can be derived through various means (Box 6). In Werlte in Germany, for example, a plant with an electrolyser capacity of 6 MWe has been producing 300 m3 per hour of synthetic methane since 2013, with CO2 being provided by a biogas plant. A synthetic liquids plant for methanol production has been operating in Iceland since 2012 with an electrolyser capacity of 6 MWe and a methanol output of 4 000 tonnes per year. The required CO2 is captured from a geothermal power plant.
Box 5. CO2 sources for synthetic hydrocarbons
The production of methane or liquid hydrocarbon fuels and feedstocks from hydrogen often uses CO2 as input. For example, replacing today’s global fossil kerosene demand of 2 600 million barrels per year completely with synthetic kerosene would require 1 gigatonne of carbon dioxide (GtCO2) per year. If the synthetic hydrocarbon fuel is combusted, this CO2 is again released to the atmosphere (assuming the combustion process is not equipped with CCUS). From a climate perspective, the source of CO2 is therefore vitally important.
One option is to acquire CO2 produced from the combustion of fossil fuels, or from various industry plants offering more concentrated CO2 streams such as in cement production. Although the CO2 is based on fossil fuels, its utilisation can contribute to CO2 reduction as, in principle, each carbon molecule is being used twice: the carbon contained in a fossil fuel is used to produce energy or in an
13 FT synthesis is a fully commercial process. Several large-scale plants converting coal or natural gas via FT synthesis into liquid fuels are in operation. The largest coal-to-liquid plant has operated since the 1980s in Secunda, South Africa, with a capacity of 160 000 barrels per day (bbl/d). The largest gas-to-liquid plant has operated in Qatar since 2011 at 140 000 bbl/d.
PAGE | 58
IEA. All rights reserved.

The Future of Hydrogen |
Chapter 2: Producing hydrogen and hydrogen-based products |
|
|
|
|
industrial production process; and then the resulting CO2 is used in combination with hydrogen to
produce a synthetic hydrocarbon fuel. However, such a system would still involve emissions of CO2 from fossil fuels and would have a theoretical upper limit of 50% emissions reduction (Bennett, Schroeder and McCoy, 2014).
For very low CO2 pathways, non-fossil CO2 sources would be needed. One option is to use CO2 formed at high purity during the production of biogas and bioethanol. Capturing CO2 from these processes requires only moderate additional investment and energy, and has CO2 capture costs as low as USD 20–30/tCO2 (Irlam, 2017). If the production of the hydrogen-based fuel is at the same site as the production of the upgraded biogas or biofuel, then the two product streams can be blended to take advantage of the same infrastructure for onward distribution. There is also an efficiency from maximising the use of the carbon contained in the original biomass input. If biomass gasification were to reach commercial scale, it could also become a potential CO2 source owing to relatively low CO2 capture costs and compatibility with most biomass feedstocks (Ericsson, 2017). To raise efficiency, it may not be necessary to separate the CO2 if the externallysourced hydrogen can be introduced directly into the gasification products (containing CO2, and also hydrogen and carbon monoxide) so that they can be converted to synthetic fuels in one combined reaction process (Hannula, 2016). However, it remains uncertain whether sufficient biogenic CO2 could be available in the future at the scale needed for widespread production of hydrogen-based synthetic hydrocarbon fuels.
CO2 can also be captured directly from the atmosphere, where there a no constraints on the availability of CO2. However, due to the low atmospheric concentrations of CO2, DAC is more energy-intensive than CO2 capture from gases formed at power plants or industrial facilities. Today’s units require both electricity and heat for CO2 capture, with the two main types of system being high-temperature or low-temperature DAC. High-temperature DAC operates at around 900°C and uses an aqueous solution to absorb CO2, while low-temperature DAC operates at around 100°C with a solid sorbent. Estimates for the energy requirements of DAC are in the order of 250–400 kWh of heat and 1 500–1 750 kWh of electricity per tonne of CO2. The heat requirement can, however, be reduced by integrating DAC with the production of synthetic hydrocarbon fuels (Fasihi and Breyer, 2017). DAC plants operate today at a scale of 900 tCO2 per year or less in Canada, Iceland, Italy and Switzerland, but practical experience remains limited. Cost estimates for DAC remain uncertain, but studies estimate that in the long term costs for DAC may fall to a range of USD 94–232/tCO2 for high-temperature DAC (Keith et al., 2018) and USD 130–170t CO2 for lowtemperature DAC (Fasihi, Efimova and Breyer, 2019).
The environmental impact of hydrogen-based synthetic hydrocarbon fuels depends on the CO2 intensity of both the hydrogen and the CO2. Policy must therefore consider the CO2 intensity of the whole value chain, including the source of the CO2, to avoid outcomes that do not lead to CO2 reduction overall. Policies that incentivise hydrogen production and hydrogen-based fuel production separately could inadvertently encourage the separation of CO2 from hydrogen in fossil methane and its recombination with hydrogen to produce methane again, with an investment of energy in the process. A low-carbon hydrogen-based fuel is one with net emissions after combustion that are zero, or nearly zero, after subtracting emissions of CO2 originating from a biogenic or atmospheric carbon source. It is important to manage this accounting challenge effectively. The simplest approach, if feasible, may be to certify and track carbon through the
PAGE | 59
IEA. All rights reserved.

The Future of Hydrogen |
Chapter 2: Producing hydrogen and hydrogen-based products |
|
|
|
|
supply chain as “fossil” or “non-fossil”. The operator of the CO2 capture facility would be credited
with lower emissions for their process compared with the same process without CO2 capture.
Sources: Bennett, Schroeder and McCoy (2014), “Towards a framework for discussing and assessing CO2 utilisation in a climate context”, Irlam (2017), “Global costs of carbon capture and storage: 2017 update”; Ericsson (2017), “Biogenic carbon dioxide as feedstock for production of chemicals and fuels: A Techno-economic assessment with a European perspective”; Hannula (2016), “Hydrogen enhancement potential of synthetic biofuels manufacture in the European context: A techno-economic assessment”; Keith et al. (2018), “A process for capturing CO2 from the atmosphere”; Fasihi and Breyer (2017), “Synthetic methanol and dimethyl ether production based on hybrid PV-wind power plants”; Fasihi, Efimova and Breyer (2019), “Techno-economic assessment of CO2 direct air capture plants”.
Production costs
The main cost components for the production of ammonia and synthetic hydrocarbons are the CAPEX and the hydrogen costs, together with the electricity costs if the hydrogen is produced through electrolysis and, for synthetic hydrocarbons, the CO2 feedstock costs.
Capital costs constitute around 30–40% of the total production costs for ammonia and synthetic hydrocarbons if the hydrogen is produced from electricity. CAPEX costs are dominated by the costs of the electrolyser, while the synthesis process and other equipment components have a smaller impact.14 Learning effects could roughly halve the CAPEX costs of the different production pathways in the long term, thereby bringing down the cost of production (Figure 22).
Figure 22. Indicative production costs of electricity-based pathways in the near and long term
Notes: NH3 = ammonia.; renewable electricity price = USD 50/MWh at 3 000 full load hours in near term and USD 25/MWh in long term; CO2 feedstock costs lower range based on CO2 from bioethanol production at USD 30/tCO2 in the near and long term; CO2 feedstock costs upper range based on DAC = USD 400/tCO2 in the near term and USD 100/tCO2 in the long term; discount rate = 8%. More information on the underlying assumptions is available at www.iea.org/hydrogen2019.
Source: IEA 2019. All rights reserved.
Future cost reductions for hydrogen-based products from electricity will depend on lowering the cost of electricity, with cost reductions for CO2 feedstocks also being critical for synthetic hydrocarbons.
14 For example, for ammonia production from electrolytic hydrogen, the synthesis process and the air separation unit account for less than 5% of the total CAPEX.
PAGE | 60