

01 POWER ISLAND / 02 H2+NH3 / The_Future_of_Hydrogen-IEA-2020
.pdfThe Future of Hydrogen Chapter 5: Opportunities for hydrogen in transport, buildings and power
Table 9. |
Role of hydrogen and hydrogen-based products in power generation |
|||||||||||||
|
|
|
|
|
|
|
|
|
|
|
|
|
|
|
|
|
|
|
Current role |
|
|
Demand |
|
|
Future deployment |
|
|
|
|
|
|
|
|
|
|
|
|
|
|
|
|
|
||
|
|
|
|
|
|
perspectives |
|
|
|
|
|
|
|
|
|
|
|
|
|
|
|
|
Opportunities |
|
|
Challenges |
|
||
|
|
|
|
|
|
|
|
|
|
|
|
|||
|
|
|
|
|
|
|
|
|
|
|
|
|
||
|
|
|
|
|
|
|
|
|
|
|
|
|
|
|
|
|
|
|
|
|
|
|
|
|
|
|
|
|
|
|
|
|
|
|
|
|
|
|
|
|
|
|
CO2 mitigation costs |
|
|
|
|
|
No |
|
|
20% co-firing share in |
|
|
|
|
|
can be low, but rely on |
|
|
|
|
|
|
|
global coal power |
|
|
|
|
|
low-cost ammonia |
|
|
|
|
|
|
deployment so |
|
|
|
|
|
|
|
|
||
|
|
|
|
|
|
plant fleet could by |
|
|
|
|
|
supply. |
|
|
|
Co-firing |
|
|
far; co-firing |
|
|
|
|
Reducing the carbon |
|
|
|
||
|
|
|
|
|
2030 lead to an |
|
|
|
|
Attention has to be paid |
|
|||
|
ammonia |
|
|
has been |
|
|
|
|
impact of existing |
|
|
|
||
|
|
|
|
|
ammonia demand of |
|
|
|
|
to NOx emissions; |
|
|||
|
in coal |
|
|
demonstrated |
|
|
|
|
coal-fired power |
|
|
|
||
|
|
|
|
|
up to 670 Mt |
|
|
|
|
further NOx treatment |
|
|||
|
power |
|
|
in a |
|
|
|
|
plants in the near |
|
|
|
||
|
|
|
|
|
ammonia or a |
|
|
|
|
may be needed. |
|
|||
|
plants |
|
|
commercial |
|
|
|
|
term |
|
|
|
||
|
|
|
|
|
corresponding |
|
|
|
|
Only a transitional |
|
|||
|
|
|
|
coal power |
|
|
|
|
|
|
|
|
||
|
|
|
|
|
|
hydrogen demand of |
|
|
|
|
|
measure – still |
|
|
|
|
|
|
plant in Japan |
|
|
|
|
|
|
|
|
||
|
|
|
|
|
|
120 MtH2 |
|
|
|
|
|
significant remaining |
|
|
|
|
|
|
|
|
|
|
|
|
|
|
|
||
|
|
|
|
|
|
|
|
|
|
|
|
|
CO2 emissions |
|
|
|
|
|
Few |
|
Assuming 1% of |
|
|
|
|
Availability of low-cost |
|||
|
|
|
|
commercial |
|
global gas-fired |
|
Supporting the |
|
and low-carbon |
||||
|
|
|
|
gas turbines |
|
power capacity would |
|
|
hydrogen and |
|||||
|
|
|
|
|
|
integration of VRE in |
|
|||||||
|
|
|
|
using |
|
run on hydrogen by |
|
|
ammonia. |
|||||
|
Flexible |
|
|
|
the power system. |
|
||||||||
|
|
hydrogen-rich |
|
2030, this would |
|
|
Competition with other |
|||||||
|
power |
|
|
|
Some gas turbine |
|
||||||||
|
|
gases. |
|
result in a capacity of |
|
|
flexible generation |
|||||||
|
generation |
|
|
|
designs already able |
|
||||||||
|
|
363 000 fuel |
|
25 GW, generating |
|
|
options as well as other |
|||||||
|
|
|
|
|
|
to run on high |
|
|||||||
|
|
|
|
cell units |
|
90 TWh of electricity |
|
|
flexibility options (e.g. |
|||||
|
|
|
|
|
|
hydrogen shares |
|
|||||||
|
|
|
|
(1 600 MW) |
|
and consuming |
|
|
demand response, |
|||||
|
|
|
|
|
|
|
|
|
||||||
|
|
|
|
installed |
|
4.5 MtH2 |
|
|
|
|
storage) |
|||
|
|
|
|
|
|
|
|
|
|
|
|
|
||
|
|
|
|
Demonstration |
|
|
|
|
|
Fuel cell systems in |
|
|
|
|
|
Back-up |
|
|
projects for |
|
|
With increasing |
|
|
combination with |
|
|
|
|
|
|
|
electrification |
|
|
|
|
storage as a cost- |
|
|
Often higher initial |
|
||
|
and off- |
|
|
|
|
growth of |
|
|
|
|
|
|||
|
|
|
of villages. |
|
|
|
|
effective and less |
|
|
investment needs |
|
||
|
grid |
|
|
|
|
telecommunications, |
|
|
|
|
|
|||
|
|
|
Fuel cell |
|
|
|
|
polluting alternative |
|
|
compared with diesel |
|
||
|
power |
|
|
|
|
also growing need for |
|
|
|
|
|
|||
|
|
|
systems in |
|
|
|
|
to diesel generators. |
|
|
generators |
|
||
|
supply |
|
|
|
|
reliable power supply |
|
|
|
|
|
|||
|
|
|
combination |
|
|
|
|
More robust than |
|
|
|
|
||
|
|
|
|
|
|
|
|
|
|
|
|
|
||
|
|
|
|
with storage |
|
|
|
|
|
battery systems |
|
|
|
|
|
|
|
|
|
|
|
In the long term, with |
|
Due to high energy |
|
|
|
||
|
|
|
|
|
|
|
very high VRE shares, |
|
content of hydrogen, |
|
High conversion losses. |
|||
|
|
|
|
|
|
|
need for large-scale |
|
relatively low CAPEX |
|
||||
|
|
|
Three salt |
|
|
|
Geological availability of |
|||||||
|
|
|
|
and long-term |
|
cost for storage itself. |
|
|||||||
|
|
|
cavern storage |
|
|
|
salt caverns for |
|||||||
|
|
|
|
storage for seasonal |
|
Few alternative |
|
|||||||
|
Long-term |
sites for |
|
|
|
hydrogen storage |
||||||||
|
|
imbalances or longer |
|
technologies for |
|
|||||||||
and large- |
hydrogen in |
|
|
|
region-specific. |
|||||||||
|
periods with no VRE |
|
long-term and large- |
|
||||||||||
scale |
the United |
|
|
|
Little experience with |
|||||||||
|
generation. |
scale storage. |
|
|||||||||||
energy |
States; another |
|
|
depleted oil and gas |
||||||||||
|
In combination with |
|
Conversion losses |
|
||||||||||
storage |
three in the |
|
|
|
fields or water aquifers |
|||||||||
|
long-distance trade, |
|
can be reduced if |
|
||||||||||
|
|
|
United |
|
|
|
for hydrogen storage |
|||||||
|
|
|
|
scope to take |
|
stored hydrogen or |
|
|||||||
|
|
|
Kingdom |
|
|
|
(e.g. contamination |
|||||||
|
|
|
|
advantage of |
|
ammonia can be |
|
|||||||
|
|
|
|
|
|
|
|
|
issues) |
|||||
|
|
|
|
|
|
|
seasonal differences |
|
directly used in end- |
|
||||
|
|
|
|
|
|
|
|
|
|
|
||||
|
|
|
|
|
|
|
in global VRE supply |
|
use applications |
|
|
|
||
Note: VRE = variable renewable energy.
PAGE | 151
IEA. All rights reserved.

The Future of Hydrogen |
Chapter 5: Opportunities for hydrogen in transport, buildings and power |
How does the power sector use hydrogen today?
Although pure hydrogen does not generally feature as a fuel in power generation today, there are small-scale exceptions. For example, a 12 MW hydrogen-fired combined-cycle gas turbine in Italy uses hydrogen from a nearby petrochemical complex, while in Kobe, Japan, a hydrogenfired gas turbine is providing heat (2.8 watts thermal) and electricity (1.1 MWe) to a local community. Somewhat more common is the use of hydrogen-rich gases from steel mills, petrochemical plants and refineries. Reciprocating gas engines today can handle gases with a hydrogen content of up to 70% (on a volumetric basis),53 while in the future gas engines should be able to operate on even 100% hydrogen (Goldmeer, 2018). Gas turbines also have the capability to run on hydrogen-rich gases. In Korea a 40 MW gas turbine at a refinery has run on gases with a hydrogen content of up to 95% for 20 years.
Fuel cells are a further option to convert hydrogen into electricity and heat, producing water and no direct emissions. They can achieve high electric efficiencies of over 60% and reveal a higher efficiency in part load than full load, which makes them particularly attractive for flexible operations such as load balancing (Box 15).
Box 15. Fuel cell technologies for stationary power applications
Various fuel cell technologies exist for stationary power applications:
•Polymer electrolyte membrane fuel cells (PEMFCs) operate at relatively low temperatures (below 100°C) and have a quick start-up time. They require, however, a pure hydrogen stream, or an external reformer if natural gas is used as fuel. PEMFCs are used today as micro co-generation units, operating with natural gas or LPG in residential buildings.
•Phosphoric acid fuel cells (PAFCs), based on phosphoric acid as electrolyte, are used today as stationary power generators with outputs in the 100–400 kW range. In addition to electricity, they also produce heat at around 180°C, with potential uses for space and water heating.
•Molten carbonate fuel cells (MCFCs) and solid oxide fuel cells (SOFCs) operate at higher temperatures, 600°C and 800–1 000°C respectively, which allow them to run on different hydrocarbon fuels without the need for an external reformer to produce hydrogen first. MCFCs are used in the MW scale for power generation (due their low power density, resulting in a relatively large size). The produced heat can be used for heating or cooling purposes in buildings and industrial applications. SOFCs have similar application areas, often at smaller scale in the kW range, such as micro co-generation units or for off-grid power supply.
53 Hydrogen has a more than one third lower energy content per cubic metre (m3) of 10 MJ/m3 compared to natural gas with 35 MJ/m3. Therefore, a volumetric blending share of 70% of hydrogen into natural gas corresponds to a 20% blending share in energy terms. If not noted otherwise, the hydrogen shares in this section refer to volumetric shares.
PAGE | 152
IEA. All rights reserved.
The Future of Hydrogen |
Chapter 5: Opportunities for hydrogen in transport, buildings and power |
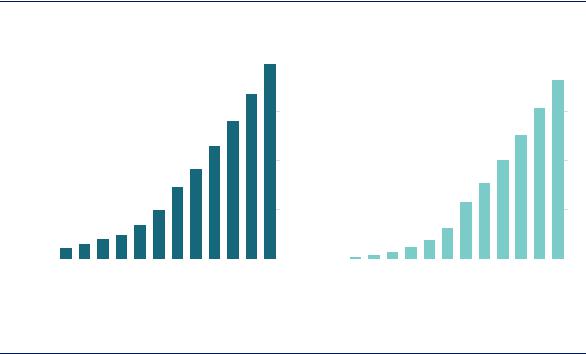
Global installed stationary fuel cell capacity has been rapidly growing over the last ten years, reaching almost 1.6 GW in 2018 (Figure 61), although only around 70 MW uses hydrogen as fuel; most of the existing fuel cells today run on natural gas. The number of globally installed fuel cell units is around 363 000, largely dominated by micro co-generation systems. The Japanese ENEFARM initiative (Box 14) accounts for the majority, with around 276 000 micro co-generation systems, but represents only 12% of the installed capacity at 193 MW (IPHE, 2018a). Outside Japan, the residential fuel cell market is also growing in Germany, driven by the KfW433 support programme with around 1 900 funding approvals by November 2018 (IPHE, 2018b). Larger fuel cell systems above 100 kW to 2.4 MW are still almost exclusively deployed in Korea and the United States, with installed capacities of 300 MW and 150 MW, respectively. A further growing market for fuel cells is the provision of back-up power and off-grid electricity (Box 16).
Figure 61. Development of global stationary fuel cell capacity, 2007–18
MW |
1 600 |
|
Installed capacity |
|
|
|
|
|
|
|
|
|
units |
400 |
|
|
|
Installed number of units |
|
|
|
|
|
|||||||||||
|
|
|
|
|
|
|
|
|
|
|
|
|
|
|
|
|
|
|
|
|
|
|
|
|
|
|
|
|
|
|
||||
|
|
|
|
|
|
|
|
|
|
|
|
|
|
|
|
|
|
|
|
|
|
|
|
|
|
|
|
|
|
|
|
|
||
|
1 200 |
|
|
|
|
|
|
|
|
|
|
|
|
|
|
|
Thousand |
300 |
|
|
|
|
|
|
|
|
|
|
|
|
|
|
|
|
|
|
|
|
|
|
|
|
|
|
|
|
|
|
|
|
|
|
|
|
|
|
|
|
|
|
|
|
|
|
|
|
|
||
|
800 |
|
|
|
|
|
|
|
|
|
|
|
|
|
|
|
|
200 |
|
|
|
|
|
|
|
|
|
|
|
|
|
|
|
|
|
|
|
|
|
|
|
|
|
|
|
|
|
|
|
|
|
|
|
|
|
|
|
|
|
|
|
|
|
|
|
|
|
||
|
400 |
|
|
|
|
|
|
|
|
|
|
|
|
|
|
|
|
100 |
|
|
|
|
|
|
|
|
|
|
|
|
|
|
|
|
|
|
|
|
|
|
|
|
|
|
|
|
|
|
|
|
|
|
|
|
|
|
|
|
|
|
|
|
|
|
|
|
|
||
|
0 |
|
|
|
|
|
|
|
|
|
|
|
|
|
|
|
|
0 |
|
|
|
|
|
|
|
|
|
|
|
|
|
|
|
|
|
|
|
|
|
|
|
|
|
|
|
|
|
|
|
|
|
|
|
|
|
|
|
|
|
|
|
|
|
|
|
|
|
||
|
2007 |
2010 |
|
|
|
|
2015 |
|
|
2018 |
|
2007 |
2010 |
2015 |
|
2018 |
||||||||||||||||||
Sources: E4tech (various years), The Fuel Cell Industry Review; S&P Global Platts (2018), World Electric Power Plants Database.
Stationary fuel cells have experienced strong growth over the last decade in terms of installed capacity and number of units, but still represent only 0.02% of global power generation capacity.
Very few countries have stated explicit targets for the use of hydrogen or hydrogen-based fuels in the power sector. Japan is one of the few exceptions: it aims to reach 1 GW of power capacity based on hydrogen by 2030, corresponding to an annual hydrogen consumption of 0.3 MtH2, rising to 15–30 GW in the longer term, corresponding to annual hydrogen use of 15– 30 MtH2 (METI, 2017). Korea is another exception: its hydrogen roadmap sets a target of 1.5 GW installed fuel cell capacity in the power sector by 2022, and 15 GW by 2040. A number of countries have, however, recognised the potential of hydrogen as a low-carbon option for power and heat generation.
Research and pilot projects to introduce hydrogen and ammonia as fuel for gas turbines and coal power plants are being pursued in Japan. An existing 440 MW combined-cycle gas turbine (CCGT) plant is being converted from natural gas to hydrogen in the Netherlands, and ammonia is being considered for long-term storage there; it would be reconverted into hydrogen and nitrogen before combustion of the hydrogen in the gas turbine (Northern Netherlands Innovation Board, 2017). The Port Lincoln Green Hydrogen Project under construction in Australia includes a 30 MW electrolyser plant and an ammonia production facility, as well as a 10 MW hydrogen-fired gas turbine and a 5 MW hydrogen fuel cell, which
PAGE | 153
IEA. All rights reserved.

The Future of Hydrogen |
Chapter 5: Opportunities for hydrogen in transport, buildings and power |
will supply balancing services to the grid and the ammonia plant. The facility will also support to two new solar farms, as well as a nearby micro-grid which will be utilised by local aqua agriculturists who have been affected by ageing back-up power generation (Bruce et al., 2018).
Box 16. Using fuel cells to provide back-up power and access to electricity
The provision of back-up power and off-grid electricity is today often still dominated by diesel generators. Fuel cells represent a possible alternative, in many cases reducing local air pollution as well as the need for imported diesel. An estimated 2 500 to 3 000 such systems were deployed in 2018 (E4Tech, 2018).
The mobile telecommunication industry is an example of a sector that needs back-up and offgrid power. It relies on an estimated 7 million base stations worldwide, and this number is increasing by over 100 000 each year, mostly in developing and emerging economies. To ensure reliable electricity supply for these base stations in parts of the world where the electricity infrastructure is weak or no grid connection is available, these base stations require their own electricity supply, which is often provided by diesel generators or diesel-battery hybrid systems, with each base station consuming around 10 000 to 12 000 litres of diesel per year. To take one example, India has around 650 000 telecom towers today, around 20% of which rely on diesel generators, resulting in an annual diesel consumption of 5 billion litres and CO2 emissions of 5 MtCO2/yr (Lele, 2019).
Fuel cell systems, relying on bottled hydrogen, methanol or ammonia as fuel, offer an alternative to diesel generators or battery systems. Compared to battery systems, fuel cells can operate in environments from -40°C to 50°C without the need for any cooling. (It has been also reported that compared to diesel generators, PV systems and batteries, fuel cells and their fuel appear less attractive to thieves.) In Kenya 800 base stations are switching from diesel generators to 4 kW ammonia-based alkaline fuel cell systems, including a cracker to convert the ammonia into hydrogen. A single 12-tonne tank of ammonia can provide enough fuel to operate a base station for a year (Ammonia Energy, 2018). In South Africa, over 300 stationary fuel cell systems have been rolled out by Vodacom to provide back-up power for telecom base stations, with a further 250 planned for 2019.
Fuel cells can also help to provide back-up for power outages and access to electricity for offgrid villages, schools and clinics. In South Africa, a small rural village of 34 households was electrified in 2014 in a trial project through a mini grid, relying for electricity supply on three 5 kW methanol fuel cells in combination with a 14 m3 methanol tank and a 73 kWh battery bank. Improvements to stationary fuel cell systems have led to larger field trials, with more recent deployments in Kwa Zulu Natal province involving energy provision for over 500 households in two rural villages as well as water distribution in the area. In 2015 a fuel cell system was installed at a clinic in Gauteng province to provide back-up power for refrigeration of critical medicines and vaccines during power outages. In the same year, in the Eastern Cape province of South Africa, hydrogen fuel cells were installed at schools to support basic electricity requirements such as charging stations for tablets, fax machines and computers.
A wider market for stationary power installations up to around 5 MW for uninterruptible and
PAGE | 154
IEA. All rights reserved.

The Future of Hydrogen |
Chapter 5: Opportunities for hydrogen in transport, buildings and power |
back-up power is also growing, for example in California, reflecting the importance of uninterrupted power for data centres, banks, hospitals and similar organisations. This provides another potential route for fuel cells to scale up, in particular SOFCs. They can be manufactured with electronics industry techniques, and installed quickly and on a modular basis in densely populated areas. They run quietly without NOx emissions and provide resilience against power grid outages by using the natural gas grid, thus avoiding the need for on-site fuel storage. The modular nature of fuel cells means that they lend themselves to real-time monitoring and servicing of components without downtime, which fits well with the trend towards more digitalisation in operations and branding. To reduce emissions they could switch to be run on hydrogen in the future or fitted with CO2 capture if a system for collecting the CO2 were available, for example for geological storage.
Sources: E4Tech (2018), The Fuel Cell Industry Review; Lele (2019), “Hydrogen and fuel cells at Reliance Industries Limited”; Ammonia Energy (2018), “GenCell launches commercial alkaline fuel cell using cracked ammonia fuel”.
Potential for future hydrogen demand in the power sector
Hydrogen and hydrogen-based fuels such as ammonia and synthetic natural gas can be fuels for power generation. Ammonia can be co-fired in coal-fired power plants to reduce coal usage and reduce the carbon footprint of these plants; if low carbon, it would also reduce overall emissions. Hydrogen and ammonia can also be used as fuels in gas turbines, CCGTs or fuel cells, thus providing a flexible and potentially low-carbon generation option. Hydrogenbased fuels are also options for large-scale and long-term energy storage to balance seasonal variations in electricity demand or variable renewable power generation.
Co-firing of ammonia in coal power plants
In 2017 the Japanese Chugoku Electric Power Corporation successfully demonstrated the cofiring of ammonia and coal, with a 1% share of ammonia (in terms of total energy content) at one of their commercial coal power stations (120 MW) (Muraki, 2018). Using ammonia as fuel raises concerns about an increase in NOx emissions, but the demonstration managed to keep them within the usual limits and to avoid any ammonia slip into exhaust gas. Higher blending shares of up to 20% ammonia in energy terms might be feasible with only minor adjustments to a coal power plant. In smaller furnaces with a capacity of 10 MW thermal, blending shares of 20% ammonia have been achieved without problems, and in particular without any slippage of ammonia into exhaust gas.
The economics of substituting coal with ammonia depend on the availability of low-cost ammonia (Chapter 2), but ammonia could help to reduce emissions if produced from lowcarbon hydrogen. By 2030 around 1 250 GW of coal power plants worldwide that are currently in operation or under construction could not only still be in service, but could also still have a remaining lifetime of at least 20 years. Co-firing with a 20% share of ammonia could reduce the 6 GtCO2/yr annual emissions of these coal plants by 1.2 GtCO2, provided that the ammonia was produced from low-carbon hydrogen. Reaching a 20% blending share would result in an annual ammonia demand of 670 Mt, more than three times today’s global ammonia production, which in turn would require 120 MtH2.
PAGE | 155
IEA. All rights reserved.

The Future of Hydrogen |
Chapter 5: Opportunities for hydrogen in transport, buildings and power |
Flexible power generation
Hydrogen can be used as a fuel in gas turbines and CCGTs. Most existing gas turbine designs can already handle a hydrogen share of 3–5% and some can handle shares of 30% or higher. The industry is confident that it will be able to provide standard turbines that are able to run entirely on hydrogen by 2030 (EUTurbines, 2019).
Ammonia is another potential fuel for gas turbines. The direct use of ammonia has been successfully demonstrated in micro gas turbines with a power capacity of up to 300 kW (Shiozawa, 2019). In larger gas turbines above 2 MW, the slow reaction kinetics of ammonia with air, the flame stability and the NOx emissions are issues still being investigated by researchers (Valera-Medina et al., 2018). Instead of directly burning ammonia, an alternative approach is to reconvert the ammonia first into hydrogen and nitrogen, to burn hydrogen in the combustor of the gas turbine. The heat required for decomposing (or cracking) the ammonia at temperature levels of 600–1 000°C (the temperature depends on the catalyst) can be supplied by the gas turbine, though this slightly reduces the electricity generation efficiency of the overall process.
Fuel cells can also be used as a flexible power generation technology. With electric efficiencies of 50–60% (lower range today, upper future potential) being in a similar range to those of CCGTs, the choice between fuel cells and CCGTs in economic terms largely depends on their capital costs. It is, however, worth noting that fuel cell stacks today still suffer from a shorter technical lifetime than gas turbines (10 000 to 40 000 hours of operation), and that stationary fuel cells today typically have a smaller power output (up to 50 MW for the largest fuel cell power plants), which makes them most suitable for distributed generation. For comparison, CCGT units can reach capacities of 400 MW. The heat produced by the fuel cell while generating power can be used to provide an additional revenue stream. Future cost reductions for fuel cells will depend on future deployment levels and the learning effects and economies of scale that follow from this. On optimistic assumptions, CAPEX for hydrogen fuel cells may fall to USD 425/kW by 2030 compared to USD 1 600/kW for a 1 MW PEMFC unit today or USD 1 000/kW for a CCGT today (Bruce et al., 2018).
Hydrogen and ammonia could offer low-carbon flexibility for electricity systems with increasing shares of VRE. Alternative low-carbon flexible generation options are natural gasfired power plants equipped with CCUS and biogas power plants. Both alternatives are characterised by higher capital costs per unit of power than needed for a hydrogen-fired CCGT power plant, due to the additional capture equipment needed for CCUS and the typically smaller scale of biogas power plants. The capital cost advantage of the hydrogen option is more pronounced when the load factor is low (Figure 62), and it often is low in systems with high shares of VRE. At a capacity factor of 15%, low-carbon hydrogen would become competitive with electricity generation from natural gas with CCS at hydrogen prices of USD 2.5/kgH2, if the gas price is USD 7/MBtu.54
54 For comparison, USD 1/kgH2 corresponds to USD 8.8/MBtu.
PAGE | 156
IEA. All rights reserved.

The Future of Hydrogen |
Chapter 5: Opportunities for hydrogen in transport, buildings and power |
Figure 62. Break even for hydrogen CCGT against other flexible power generation options
USD/kgH2
10 |
|
|
|
|
|
|
|
|
|
|
|
8 |
|
|
|
|
|
|
|
|
|
|
Biogas plant, |
|
|
|
|
|
|
|
|
|
|
|
|
6 |
|
|
|
|
|
|
|
|
|
|
USD 14/MBtu |
|
|
|
|
|
|
|
|
|
|
|
|
|
|
Biogas cheaper |
|
|
|
|
|
|
Natural gas w/ CCUS, |
||
|
|
|
|
|
|
|
|
|
|
|
|
4 |
|
|
|
|
|
|
|
|
|
|
USD 7/MBtu |
|
Natural |
Hydrogen cheaper |
|
|
|
|
|
|
|||
2 |
gas without |
Natural gas with CCS cheaper |
|
Natural gas w/o CCUS, |
|||||||
CCS cheaper |
|
|
|
|
USD 7/MBtu |
||||||
|
|
|
|
|
|||||||
|
|
|
Hydrogen cheaper |
|
|
|
|
|
|||
0 |
|
|
Hydrogen cheaper |
|
|
|
|
|
|
||
|
|
|
|
|
|
|
|
|
|
|
|
|
0% |
10% |
20% |
30% |
40% |
50% |
60% |
70% |
80% |
90% |
100% |
|
|
|
|
|
|
Load factor |
|
|
|
|
|
Notes: Arrows indicate areas where hydrogen costs and load factors mean that competing generation technologies or hydrogen are cheaper. CAPEX = USD 1 000/kW for CCGT without CCS and hydrogen-fired CCGT, USD 1 870/kW for CCGT with CCS, USD 2 000/kW for biogas engine; gross efficiencies (LHV) = 61% CCGT without CCS and hydrogen-fired CCGT, 53% CCGT with CCS, 45% biogas engine. Economic lifetime = 25 years. More information on the assumptions is available at www.iea.org/hydrogen2019.
Source: IEA 2019. All rights reserved.
Hydrogen may be cost-competitive with natural gas with CCS and biogas as a flexible generation option, particularly at low load factors.
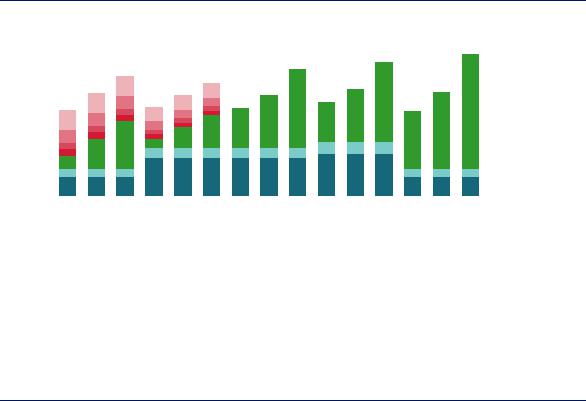
The competitiveness of hydrogen-fired power plants with natural gas-fired power generation for load balancing and peak load generation depends on the gas price and the potential level of carbon prices. Looking, for example, at a load factor of 15% and a natural gas price of USD 7/MBtu, the CO2 price would have to be USD 100/tCO2 to make hydrogen-fired power generation at a hydrogen price of USD 1.5/kgH2 competitive with natural gas. If the hydrogen price was USD 2/kg H2, the CO2 price would have to be USD 175/tCO2 to make electricity from hydrogen competitive against natural gas (Figure 63).
For illustrative purposes, if 1% of the globally installed gas-fired power capacity (or 25 GW) was fired by hydrogen (or ammonia) in 2030, this would result in annual electricity generation of around 90 TWh (40% load factor) and hydrogen demand of 4.5 MtH2 (or 30 Mt of ammonia). This would help to scale up demand and the supply infrastructure for hydrogen, since the annual hydrogen demand of 25 GW of hydrogen power plants would correspond to the annual consumption of around 23 million fuel cell vehicles. Even a single 500 MW power plant would create a hydrogen demand equivalent to 455 000 fuel cell vehicles or the heat demand of 221 000 homes in the United Kingdom, and might therefore provide an opportunity to create a hub for other potential hydrogen users, such as transport or buildings.
PAGE | 157
IEA. All rights reserved.
The Future of Hydrogen Chapter 5: Opportunities for hydrogen in transport, buildings and power
Figure 63. |
|
Levelised electricity generation costs for load balancing from natural gas and hydrogen |
|||||||||||||||||||||||||||
USD/MWh |
300 |
|
|
|
|
|
|
|
|
|
|
|
|
|
|
|
|
|
|
|
|
|
|
|
|
|
|
|
USD 175/tCO |
|
|
|
|
|
|
|
|
|
|
|
|
|
|
|
|
|
|
|
|
|
|
|
|
|
|
|
|||
250 |
|
|
|
|
|
|
|
|
|
|
|
|
|
|
|
|
|
|
|
|
|
|
|
|
|
|
|
||
|
|
|
|
|
|
|
|
|
|
|
|
|
|
|
|
|
|
|
|
|
|
|
|
|
|
|
|
||
|
|
|
|
|
|
|
|
|
|
|
|
|
|
|
|
|
|
|
|
|
|
|
|
|
|
|
|
||
|
|
|
|
|
|
|
|
|
|
|
|
|
|
|
|
|
|
|
|
|
|
|
|
|
|
|
|
USD 100/tCO |
|
|
|
|
|
|
|
|
|
|
|
|
|
|
|
|
|
|
|
|
|
|
|
|
|
|
|
|
|
||
|
200 |
|
|
|
|
|
|
|
|
|
|
|
|
|
|
|
|
|
|
|
|
|
|
|
|
|
|
|
|
|
|
|
|
|
|
|
|
|
|
|
|
|
|
|
|
|
|
|
|
|
|
|
|
|
|
|
|
||
|
|
|
|
|
|
|
|
|
|
|
|
|
|
|
|
|
|
|
|
|
|
|
|
|
|
|
|
USD 50/tCO |
|
|
|
|
|
|
|
|
|
|
|
|
|
|
|
|
|
|
|
|
|
|
|
|
|
|
|
|
|
||
|
|
|
|
|
|
|
|
|
|
|
|
|
|
|
|
|
|
|
|
|
|
|
|
|
|
||||
|
|
|
|
|
|
|
|
|
|
|
|
|
|
|
|
|
|
|
|
|
|
|
|
|
|
|
|
||
|
150 |
|
|
|
|
|
|
|
|
|
|
|
|
|
|
|
|
|
|
|
|
|
|
|
|
|
|
|
USD 25/tCO |
|
|
|
|
|
|
|
|
|
|
|
|
|
|
|
|
|
|
|
|
|
|
|
|
|
|
|
|
||
|
|
|
|
|
|
|
|
|
|
|
|
|
|
|
|
|
|
|
|
|
|
|
|
|
|
|
|
||
|
|
|
|
|
|
|
|
|
|
|
|
|
|
|
|
|
|
|
|
|
|
|
|
|
|
|
|
Fuel costs |
|
|
100 |
|
|
|
|
|
|
|
|
|
|
|
|
|
|
|
|
|
|
|
|
|
|
|
|
|
|
|
|
|
|
|
|
|
|
|
|
|
|
|
|
|
|
|
|
|
|
|
|
|
|
|
|
|
|
|
|
||
|
|
|
|
|
|
|
|
|
|
|
|
|
|
|
|
|
|
|
|
|
|
|
|
|
|
|
|
||
|
|
|
|
|
|
|
|
|
|
|
|
|
|
|
|
|
|
|
|
|
|
|
|
|
|
|
|
OPEX |
|
|
|
|
|
|
|
|
|
|
|
|
|
|
|
|
|
|
|
|
|
|
|
|
|
|
|
|
|
||
|
|
|
|
|
|
|
|
|
|
|
|
|
|
|
|
|
|
|
|
|
|
|
|
|
|
|
|
|
|
|
50 |
|
|
|
|
|
|
|
|
|
|
|
|
|
|
|
|
|
|
|
|
|
|
|
|
|
|
|
CAPEX |
|
|
|
|
|
|
|
|
|
|
|
|
|
|
|
|
|
|
|
|
|
|
|
|
|
|
|
|
||
|
|
|
|
|
|
|
|
|
|
|
|
|
|
|
|
|
|
|
|
||||||||||
|
|
|
|
|
|
|
|
|
|
|
|
|
|
|
|
|
|
|
|
|
|
|
|
|
|
|
|
||
0 |
|
|
|
|
|
|
|
|
|
|
|
|
|
|
|
|
USD 3/MBtu |
USD 7/MBtu |
USD 11/MBtu |
USD 3/MBtu |
USD 7/MBtu |
USD 11/MBtu |
USD 1.5/kgH |
USD 2/kgH |
USD 3/kgH |
USD 1.5/kgH |
USD 2/kgH |
USD 3/kgH |
USD 1.5/kgH |
USD 2/kgH |
USD 3/kgH |
||
|
||||||||||||||||
|
|
GT NG |
|
|
CCGT NG |
|
|
CCGT H |
|
|
FC H |
|
|
GT H |
|
Notes: GT = gas turbine; CCGT = combined-cycle gas turbine; FC = fuel cell; NG = natural gas. CAPEX = USD 500/kW GT, USD
1 000/kW CCGT without CCS and hydrogen-fired CCGT, USD 1 000/kW FC. Gross efficiencies (LHV) = 42% GT, 61% CCGT without CCS and hydrogen-fired CCGT, 55% FC. Economic lifetime = 25 years for GT and CCGT, 20 years for FC. Capacity factor = 15%. More information on the assumptions is available at www.iea.org/hydrogen2019.
Source: IEA 2019. All rights reserved.
Whether hydrogen-based power generation for load balancing can compete on price against natural gas depends on regional hydrogen, natural gas and CO2 prices.
Large-scale and long-term storage
The integration of increasing shares of VRE sources in the electricity system requires a more flexible electricity system. High shares of renewables can create a need for long-term and seasonal storage, for example to provide electricity during periods of several days with very little wind and or sunshine.
Hydrogen and hydrogen-based fuels (such as methane, liquid organic hydrogen carriers [LOHCs] and ammonia produced from electricity via electrolysis) are potential options for longterm and large-scale storage of energy. Salt caverns are the best choice for the underground storage of pure hydrogen because of their tightness and low risk of contamination. Alternative underground hydrogen storage options such as pore storage and storage in depleted oil and gas fields are also being investigated. Converting electricity into methane via power-to-gas is a further long-term storage option, and one which could take advantage of the existing transport and storage infrastructure for natural gas. Around 70 power-to-gas projects to produce methane are in operation today, most of them in Europe (Chapter 2). Storing electricity in the form of ammonia is another long-term and large-scale storage option. Large steel tanks are already commonly used in the fertiliser industry for storing ammonia.
Hydrogen-based storage options suffer from low round-trip efficiency: in the process of converting electricity through electrolysis into hydrogen and then hydrogen back into electricity, around 60% of the original electricity is lost, whereas for a lithium-ion battery the losses of a storage cycle are around 15% (Figure 64). Pumped-hydro storage facilities offer one alternative: they have been used for more than a century to store electricity for relatively long periods. Batteries offer another alternative, although they are unlikely to be used for long-term and large-scale storage because they suffer from self-discharge and because of the immense number of batteries that would be needed for large-scale storage. A single large refrigerated
PAGE | 158
IEA. All rights reserved.

The Future of Hydrogen |
Chapter 5: Opportunities for hydrogen in transport, buildings and power |
liquid ammonia tank with a diameter of 50 metres and a height of 30 metres, as typically used in the fertiliser industry, can store energy amounting to 150 GWh, comparable to the annual electricity consumption of a city with a population of 100 000. To store the same amount of electricity with batteries would require around 1 150 times the installation of the Australian Hornsdale Battery Reserve, the largest lithium-ion battery storage today in the world with a capacity of 129 MWh.
All the alternatives have advantages and disadvantages. For shorter discharge durations below a few hours, hydrogen and ammonia are much more expensive than pumped-hydro storage or battery storage. With longer discharge durations, compressed hydrogen and ammonia become more attractive, benefitting from their relative low capital costs for energy storage volumes (the investment costs to develop underground salt caverns or storage tanks). Among the different storage technologies considered here, compressed hydrogen becomes the most economic option for discharge durations beyond 20–45 hours.
Figure 64. |
Levelised costs of storage as a function of discharge duration |
|
|
|
|||||||
|
10 000 |
Electricity input costs USD 50/MWh |
|
|
10 000 |
Electricity input costs USD 0/MWh |
|
||||
USD/MWh |
|
|
|
|
USD/MWh |
|
|
|
|
||
1 000 |
|
|
|
|
1 000 |
|
|
|
|
||
|
|
|
|
|
|
|
|
|
|
||
|
100 |
|
|
|
|
|
100 |
|
|
|
|
|
10 |
|
|
|
|
|
10 |
|
|
|
|
|
0.1 |
1 |
10 |
100 |
1000 |
|
0.1 |
1 |
10 |
100 |
1000 |
|
|
Discharge duration (h) |
|
|
|
Discharge duration (h) |
|
||||
|
|
Li-Ion |
PHES |
CAES |
Compressed hydrogen |
Ammonia |
|
CCGT with CCUS |
|||
Notes: PHES = pumped-hydro energy storage; CAES = compressed air energy storage; Li-Ion = lithium-ion battery. Compressed hydrogen storage refers to compressed gaseous storage in salt caverns, ammonia storage to storage in tanks.
Source: IEA 2019. All rights reserved.
Depending on the costs of the stored electricity, compressed hydrogen storage becomes the most economic storage option at discharge durations longer than 20–45 hours.
Hydrogen as an electricity storage option could also be combined with other uses of hydrogen in the interests of competitiveness. In the United States, for example, the Three-State Generation and Transmission utility is considering producing ammonia from electricity for the domestic fertiliser market. Situated in an area with low-cost electricity from wind, solar and hydropower, the project would use a reversible solid oxide electrolyser cell (rSOEC) to produce hydrogen when the cost of electricity is less than USD 25/MWh (which is 85% of the time), turning it into ammonia for sale on the market, while storing some of it for electricity generation in the rSOEC during peak hours, thus improving its overall utilisation rate. This approach may be an alternative to installing new electric generation resources that are expected only to be needed during peak load times.
It may not be necessary to use large-scale storage of hydrogen-based fuels to cover the full storage cycle, i.e. taking electricity as input and converting it in the end back into electricity.
PAGE | 159
IEA. All rights reserved.
The Future of Hydrogen |
Chapter 5: Opportunities for hydrogen in transport, buildings and power |
Instead of filling long-term storage with hydrogen from domestic electricity, hydrogen-based fuels can also be imported from other parts of the world with seasonal surpluses of renewable electricity generation at that time, taking advantage of complementary seasonal patterns of renewable electricity supply and electricity demand. Depending on the frequency and scale of the imports, this could reduce the storage volumes needed in the importing region. The conversion back to electricity may also not always be needed. Stored methane, ammonia or hydrogen could be directly used as fuel to cover seasonal demands, such as for space heating.
References
ACEA (European Automobile Manufacturers Association) (2018), “ACEA report: Vehicles in use Europe 2018”, www.acea.be/uploads/statistic_documents/ACEA_Report_Vehicles_in_useEurope_2018.pdf.
ACTU (2019), “Hyundai prévoit finalement 1 600 camions hydrogènes pour la Suisse et l’Europe” [Hyundai finally expects 1 600 hydrogen trucks for Switzerland and Europe], www.actu-transport- logistique.fr/routier/hyundai-prevoit-finalement-1-600-camions-hydrogenes-pour-la-suisse-et- leurope-517674.php.
AFC TCP (Advanced Fuel Cells Technology Collaboration Programme) (2019), “AFC TCP Survey on the Number of Fuel Cell Electric Vehicles, Hydrogen Refuelling Stations and Targets”, provided to IEA by AFC TCP.
AFHYPAC (2017), “100 Véhicules à hydrogène déployés dan le cadre du Projet H2ME” [100 hydrogen vehicles deployed in the framework of the H2ME project], www.afhypac.org/newsletter/65/100- vehicules-a-hydrogene-deployes-dans-le-cadre-du-projet-h2me-104/.
Airbus (2000), “Cryoplane – Hydrogen fuelled aircraft”, http://staffwww.itn.liu.se/~clryd/KURSER/TNK027/Kurslitteratur2011/CRYOPLANE.pdf.
AirClim (2018), “Norway heading for zero-emission ships”, www.airclim.org/acidnews/norway-heading- zero-emission-ships.
Alstom (2018), “World premiere: Alstom’s hydrogen trains enter passenger service in Lower Saxony”, https://www.alstom.com/press-releases-news/2018/9/world-premiere-alstoms-hydrogen-trains- enter-passenger-service-lower.
Ammonia Energy (2018), “GenCell launches commercial alkaline fuel cell using cracked ammonia fuel”, www.ammoniaenergy.org/gencell-launches-commercial-alkaline-fuel-cell-using-cracked- ammonia-fuel/.
Baronas, J. et al. (2017), “Joint Agency Staff Report on Assembly Bill 8: 2016 Assessment of time and cost needed to attain 100 hydrogen refueling stations in California”, www.energy.ca.gov/2017publications/CEC-600-2017-002/CEC-600-2017-002.pdf.
Baroutaji, A. et al. (2019), “Comprehensive investigation on hydrogen and fuel cell technology in the aviation and aerospace sectors”, Renewable and Sustainable Energy Reviews, Vol. 106, pp. 31-40.
Brown, T (2018), “Pilot project: an ammonia tanker fueled by its own cargo” Ammonia Energy, www.ammoniaenergy.org/pilot-project-an-ammonia-tanker-fueled-by-its-own-cargo/.
Bruce, S. et al. (2018), National Hydrogen Roadmap, CSIRO, Australia.
Campíñez-Romero, S. et al. (2018), “A hydrogen refuelling stations infrastructure deployment for cities supported on fuel cell taxi roll-out”, Energy, https://doi.org/10.1016/j.energy.2018.02.009.
PAGE | 160
IEA. All rights reserved.