

01 POWER ISLAND / 02 H2+NH3 / The_Future_of_Hydrogen-IEA-2020
.pdfThe Future of Hydrogen |
Chapter 5: Opportunities for hydrogen in transport, buildings and power |
using tank trucks to fuel ships; and using a smaller refuelling station. However, to lower fuel costs, larger facilities would be needed for more widespread deployment.
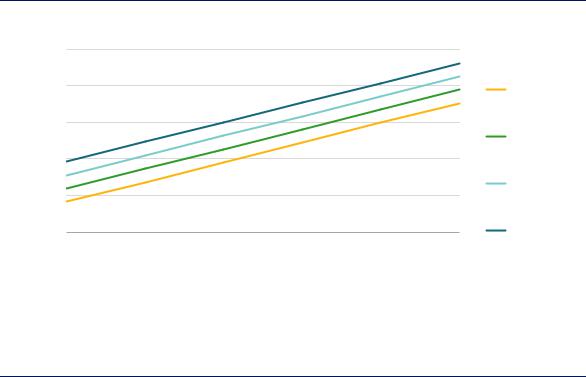
Figure 57. Current and future total cost of ownership of fuel/powertrain alternatives in a bulk carrier ship
Total cost of ownership (USD/km)
80
70
60
50
40
30
20
10
0
 Synthetic fuel (air capture)
 Synthetic fuel (best case)
 Delivered hydrogen / ammonia
 Fossil fuel
 Infrastructure
 Storage
 Fuel cell / engine
 Base ship
VLSFO |
LNG |
ICE |
ICE |
Synthetic |
FC |
ICE |
Synthetic |
|
|
Hydrogen Ammonia |
fuels |
Hydrogen Ammonia |
fuels |
||
|
|
Today |
|
|
|
Long term |
|
Note: More information on the assumptions is available at www.iea.org/hydrogen2019.
Source: IEA 2019. All rights reserved.
Due to the cost of liquefying and high storage costs, hydrogen is likely to be more costly than other low-carbon alternatives for long-distance maritime transport.
In a 15-year first-owner lifetime calculation, a CO2 price of USD 40–230/tCO2 would be required to make ammonia cost-competitive with fossil-based fuels, depending on the delivered cost of ammonia, which will vary by region (Figure 58). The break-even carbon prices for hydrogen are USD 35–45/tCO2 higher than ammonia, mainly due to the higher storage cost resulting from its lower energy density.50 It would represent a substantial cost increase for the ship owner and the switch would require policies that have an effect equivalent to these CO2 prices across competing fleets, for example mandates or low-carbon fuel standards. However, the impact of passing these costs on to the final consumer would be limited because transport costs represent a small share (often less than 1%) of the total price of shipped goods (ETC, 2018a).
50 This value would be higher for a charterer looking for three-year payback (charterers currently oversee more than half of container fleet operations (Global Ship Lease, 2019).
PAGE | 141
IEA. All rights reserved.
The Future of Hydrogen |
Chapter 5: Opportunities for hydrogen in transport, buildings and power |
Figure 58. Break-even carbon price for ammonia to be competitive with fossil fuels
(USD/tonne)price |
250 |
|
|
||
|
200 |
|
carbon |
150 |
|
100 |
||
-even |
||
|
||
Break |
50 |
|
|
||
|
0 |
20 |
35 |
50 |
65 |
80 |
95 |
Electricity price (USD/MWh)
Note: More information on the assumptions is available at www.iea.org/hydrogen2019. Source: IEA 2019. All rights reserved.
Oil price
USD 100/bbl
USD 80/bbl
USD 60/bbl
USD 40/bbl
For a bulk carrier, policies equivalent to a carbon price of USD 40–230/tCO2 would be needed to make ICE engines running on ammonia competitive with fuel oil. The break-even carbon price is highly sensitive to both the oil price and electricity price.
Rail
Rail is already the most electrified mode of transport. Although the percentage share of electrified tracks is still expanding in most countries, further electrification of rail networks is likely to come up against diminishing returns on investment, since highly utilised lines are the first to be electrified (IEA, 2019b). In France and Germany, for example, electrified lines now carry over 80% of traffic, even though less than half of the railway network has been electrified (European Commission, 2016). Beyond bi-mode diesel-electric options, several technologies offer zero tailpipe emissions on non-electrified tracks and the industry seems set to move towards these in the coming decades. The most innovative of such technologies are battery electric trains and hydrogen fuel cell trains. Battery electric trains with smaller batteries can also be used on partially electrified lines, enabling electrification costs to be sharply reduced by missing out those portions of track that are most difficult to electrify (such as bridges or tunnels).
Plans involving hydrogen trains already exist in a number of countries, with at least three companies working to supply them. Germany intends to expand the fleet of hydrogen trains to 14 by 2021 and 5 federal states have signed a letter of intent to purchase 60 trains from Alstom, with 27 ordered as of May 2019 (Schmidt, 2017). Two hydrogen trains that can travel almost 800 km a day on a single refuelling already operate in Lower Saxony in Germany (Alstom, 2018). Austria’s Zillertalbahn plans to deploy five hydrogen trains by 2022 for a total investment of almost USD 175 million. The UK government is supporting development of the first hydrogen trains by 2022 (Wiseman, 2019). The French government is similarly considering 2022 as the target for the first hydrogen train to be on the rails. Japan Rail East also has a project underway, in partnership with Toyota (Kyodo ,2018).
Under optimistic assumptions about fuel cell cost reductions, hydrogen trains could become competitive against other passenger services options with low frequency of utilisation
PAGE | 142
IEA. All rights reserved.

The Future of Hydrogen |
Chapter 5: Opportunities for hydrogen in transport, buildings and power |
(IEA, 2019b). Hydrogen fuel cell technology is most competitive for services requiring longdistance movement of large trains with low-frequency network utilisation, a common set of conditions in rail freight. The use of hydrogen in rail could be combined with its use for forklifts, trucks and other railyard and logistics hub machinery to decrease costs and improve flexibility.
Aviation
Aviation accounted for almost 2.8% of global energy-related CO2 emissions in 2017, and air passenger traffic is expected to more than double to almost 16 000 billion km/yr by mid-century under current trends. Efficiency improvements should reduce energy consumption and slow the increase in energy demand, but alternative fuels will eventually be needed to avoid increases in emissions from the sector. Advanced biofuels and hydrogen-based fuels are leading options.
While there have been feasibility studies and demonstration projects testing the scope for using hydrogen in small planes (DLR, 2016; Schilo, 2009; Airbus, 2000), the use of pure hydrogen as an aviation fuel requires significant further R&D. Hydrogen’s low energy density and the need for cryogenic storage would require changes in aircraft design, as well as new refuelling and storage infrastructure at airports. More projects – 130 in total in 2018 – are in development for the direct use of electricity than for pure hydrogen, mostly for urban air taxis (Thomson, 2018). However, direct electrification also faces challenges, specifically relating to battery weight and costs.
In contrast, hydrogen-based liquid fuels would require no changes to design or refuelling infrastructure at airports. Synthetic fuels based on electrolytic hydrogen (so-called power-to- liquid) are estimated to be four to six times more expensive than conventional jet fuel currently (see Chapter 2 for more information on the cost factors underpinning hydrogen-based fuels). Fuel represents a large share of the total costs of operating aircraft so this would significantly increase the operating costs and, presumably, ticket prices.51 This would be the case regardless of the cost of conventional jet fuel, which could itself become more expensive due to carbon pricing or other policies to reduce emissions. Estimates of the CO2 price that would be needed to encourage a shift to power-to-liquids in aviation in the long term vary widely, from USD 115/tCO2 to USD 660/tCO2, with the lower value accounting for the possible value provided to the wider energy system via the electricity grid (ETC, 2018a; Malins, 2017). Given the lack of other alternatives, most estimates place these costs among the higher abatement costs to complete the transition to a low-carbon energy system.
As with biofuels, the use of hydrogen-based fuels in aviation could be promoted through a target for blend shares. Even a modest target could help to demonstrate feasibility and support the scaling up of production. The standards development organisation, ASTM, currently sets blending limits for alternative fuels that vary by fuel from as low as 10% to up to 90%. These might provide a helpful reference point for public and private decision makers to set upper bounds, and could be updated as new engine technology emerges.
Besides on-board use of hydrogen in aviation, hydrogen is already used today in a few auxiliary power units that generate electricity when the jet engine is not running. Such units, which usually run on natural gas, can account for up to 20% of ground aircraft emissions (Baroutaji et al., 2019).
51 This could also help to decrease demand through price elasticity or shift between transport modes. It has been estimated that a fourfold increase in fuel prices in Europe could result in almost 60% higher ticket prices and 30% less demand (Murphy et al., 2018).
PAGE | 143
IEA. All rights reserved.

The Future of Hydrogen |
Chapter 5: Opportunities for hydrogen in transport, buildings and power |
Hydrogen as a fuel for heat in buildings
The global buildings sector accounts for 30% of global final energy use, nearly three-quarters of which is used for space heating, hot water production and cooking. Including traditional use of solid biomass in developing countries, related energy demand was around 2 200 Mtoe in 2017. Nearly half of this was produced directly from fossil fuels, with natural gas accounting for 620 Mtoe. Most of the rest came from conventional electric equipment (for example electric resistance radiators and cookstoves) and commercial heat (e.g. district heating), around 85% of which was produced using fossil fuels in 2017. Overall, nearly 28% of global energy-related CO2 emissions result from energy use in buildings.
Replacing heat provision with low-carbon alternatives and reducing heat demand through improving buildings is challenging. Decision-making for energy use in buildings is complex and depends on building type, location, ownership, customer preferences, equipment costs, energy prices and overall convenience, amongst other factors. This plurality of variables means that various energy sources and technologies are likely to co-exist in the future, from natural gas boilers to electric heat pumps, district heating and solar thermal heating. Hydrogen has the potential to contribute to the energy transition (e.g. through blending or methane production) and to long-term strategies for decarbonising heat (e.g. pure hydrogen production from renewables) (Table 6). In doing so, it can make use of existing building and energy network infrastructure to provide both flexibility and continuity.
Table 6. |
Potential routes to use hydrogen for buildings heat supply |
|
|
|
|||||||
|
|
|
|
|
|
|
|
|
|
|
|
|
Strategy |
|
|
Advantages |
|
|
Requirements |
|
|
Examples |
|
|
|
|
|
|
|
|
|
|
|
|
|
|
|
|
|
Low-cost solution |
|
|
Blending ratios to around 5– |
|
|
GRHYD project (2017) in |
|
|
Blending |
|
|
compatible with most |
|
|
20% in most instances. |
|
|
France. |
|
|
|
|
existing gas infrastructure |
|
|
Additional efficiency measures |
|
|
HyDeploy (2019) in the |
|
|
|
|
|
|
|
|
|
|
|
|||
|
|
|
|
and equipment |
|
|
to further abate CO2 |
|
|
United Kingdom |
|
|
|
|
|
|
|
|
|
|
|
|
|
|
|
|
|
|
|
|
|
|
|
STORE&GO (2016) |
|
|
Methane |
|
Full decarbonisation of gas |
|
Investment in methanation |
|
European project with |
||||
|
|
if low-carbon hydrogen |
|
plants. |
|
catalytic and biological |
|||||
|
produced |
|
|
|
|||||||
|
|
and low-carbon CO2 inputs. |
|
R&D to improve the efficiency |
|
methanation |
|||||
|
from clean |
|
|
|
|||||||
|
|
|
Utilisation of existing gas |
|
of methanation. |
|
(demonstration projects |
||||
|
hydrogen |
|
|
|
|
||||||
|
|
|
networks and equipment |
|
Carbon source, such as CO2 |
|
between 200 kW and |
||||
|
|
|
|
|
|
||||||
|
|
|
|
|
|
|
|
|
|
1 MW) |
|
|
|
|
|
|
|
|
|
|
|
|
|
|
|
|
|
|
|
|
Investment to upgrade gas |
|
|
The H21 Leeds City Gate |
|
|
|
|
|
Full decarbonisation of gas |
|
|
|
|
(> 2025) and the H21 |
|
|
|
|
|
|
|
|
network and equipment. |
|
|
|
||
|
100% |
|
|
if low-carbon hydrogen. |
|
|
|
|
Network Innovation |
|
|
|
|
|
|
|
Co-ordination between gas |
|
|
|
|||
|
hydrogen |
|
|
Lower efficiency losses |
|
|
|
|
Competition (NIC-2018) |
|
|
|
|
|
|
|
suppliers and distributors if |
|
|
|
|||
|
|
|
|
than synthetic methane |
|
|
|
|
projects in the |
|
|
|
|
|
|
|
|
various networks coexist |
|
|
|
||
|
|
|
|
|
|
|
|
|
United Kingdom |
|
|
|
|
|
|
|
|
|
|
|
|
|
|
|
|
|
|
|
|
|
|
|
|
|
|
|
|
|
Multiple energy services |
Investment in fuel cell or co- |
|
ENE-FARM programme in |
|||||
|
Use of fuel |
|
|
Japan (2009).* |
|||||||
|
|
(e.g. heat and electricity). |
generation technology. |
|
|||||||
|
cells and co- |
|
Energy Efficiency Incentive |
||||||||
|
Demand-side response |
R&D to improve the efficiency |
|
||||||||
|
generation |
|
|
Programme in Germany |
|||||||
|
|
potential |
of equipment |
|
|||||||
|
|
|
(2016)** |
|
|||||||
|
|
|
|
|
|
|
|
|
|
||
*Current ENE-FARM installations are running on natural gas or liquefied petroleum gas, mainly targeted at cost reduction.
**The programme includes fuel cell applications in buildings.
PAGE | 144
IEA. All rights reserved.

The Future of Hydrogen |
Chapter 5: Opportunities for hydrogen in transport, buildings and power |
How does the buildings sector use hydrogen today?
Hydrogen is very little used as a source of energy in the global buildings sector today, although various potential uses are now being trialled. There are currently 37 demonstration projects examining hydrogen blending in the gas grid (see Chapter 3 for more information). In the United Kingdom, where high heating demands have focused attention on heating solutions, H21 North of England is the largest project and is proposing to supply 100% hydrogen by pipeline to buildings. This project targets hydrogen supply of 180 ktH2/yr by 2025 and 2 MtH2/yr by 2035, following studies in 2016 confirming the feasibility of reusing the existing pipeline network (Northern Gas Networks, 2018).
There are in addition micro co-generation and fuel cell hydrogen demonstration projects in Europe and Asia, notably the ENE-FARM project in Japan (Box 14). In Europe, the ene.field demonstration was launched in 2012 and has installed more than 1 000 small stationary fuel cell systems for residential and commercial buildings in 11 countries, with plans to increase this to 2 800 units (Ravn Nielsen and Prag, 2017). In Germany, consumers can access government funding to offset the extra cost for fuel cell appliances in buildings (KfW, 2018). Projects are also being prepared for the demonstration of digital systems to facilitate renewables integration with the storage and supply of electricity and heat in one or multiple buildings, for example in the United Kingdom.
Box 14. The ENE-FARM programme in Japan
ENE-FARM is a large scale fuel cell demonstration and commercialisation programme aiming to deliver efficient and affordable fuel cell technologies for building applications. The first system was introduced in a residential building in 2009 and close to 300 000 units are expected to be in operation by 2020. The programme aims to install 5.3 million units by 2050. At present ENE-FARM units reform natural gas or liquefied petroleum gas in situ to feed a fuel cell with hydrogen. The use of fossil fuels leads to limited CO2 reduction benefits, but aids delivery of cost reductions that will help to pave the way for low-carbon hydrogen distribution once it becomes economically attractive. The initial cost per unit has come down by 75% in almost 10 years (from more than USD 35 000 to around USD 9 000 in 2018 (Nagashima, 2018).
Source: Nagashima (2018), Japan’s Hydrogen Strategy and Its Economic and Geopolitical Implications.
Potential for future hydrogen demand in buildings
Hydrogen will not make sense for all building applications, and numerous factors will influence eventual hydrogen demand in buildings, including existing natural gas infrastructure, heat densities, other building energy needs and safety considerations. There are barriers related to cost and consumer acceptance, and a variety of policy design challenges, which is why hydrogen use is currently limited to localised operations and larger-scale demonstrators such as those programmes described above. But there are lots of opportunities as well, which are centred around two main options. The first is hydrogen blending in existing natural gas networks. The second is direct use of hydrogen for heat production in buildings. Hydrogen could also be used indirectly to heat or cool local district energy networks that then supply buildings.
PAGE | 145
IEA. All rights reserved.

The Future of Hydrogen |
Chapter 5: Opportunities for hydrogen in transport, buildings and power |
These potential applications could be attractive in a wide range of countries where the provision of heat is important and where it is has to be provided in large part to existing buildings. Buildings that are more than 25 years old (and that typically have energy-intensive heating loads) represent around three-quarters of the total buildings stock in the European Union, for example (FCH 2 JU, 2019), while around two-thirds of buildings in the United States and Canada were built before 1990 (OEE, 2018; EIA, 2015; EIA, 2012). Existing buildings, many of them decades old, will continue to represent a sizeable share of the overall buildings stock in the future (Table 7). This means that a certain level of heat demand is already largely “locked in” for several decades to come.
One major advantage of hydrogen blends, direct hydrogen use and indirect hydrogen use for district heating and cooling is that they can make use of existing infrastructure. While technically feasible, other potential solutions would require major new infrastructure, which would inevitably be very costly.
Another major advantage is that hydrogen use in buildings could potentially find synergies with the wider energy system that make it attractive in terms of the overall system cost of lowcarbon transitions. Other potential solutions might find this a tougher challenge. For instance, full electrification of heat, even using high-efficiency heat pumps, could lead to large seasonal imbalances in power demand, especially if major building energy efficiency improvements are not delivered in parallel (IEA, 2019c). This would potentially require large-scale peak power or energy storage capacity. Partially or entirely replacing natural gas with biomethane also has limitations: in the European Union, for example, natural gas use for heat in buildings represented around 90 times biomethane production in 2016 (EBA, 2017). Global biogas production would need to increase 20-fold to meet current natural gas demand in the buildings sector.
|
Table 7. |
The global buildings stock and share of gas in heat production in 2017 |
|
|
||||||||||
|
|
|
|
|
|
|
|
|
|
|
|
|
|
|
|
|
|
|
|
Floor area |
|
|
Heat demand per |
|
|
Share of natural |
|
Estimated share of |
|
|
Region |
|
|
|
|
|
|
|
|
existing buildings |
|
|||
|
|
|
|
(billion m2) |
|
|
capita, MWh |
|
|
gas in heat |
|
|
||
|
|
|
|
in 2050 stock |
|
|||||||||
|
|
|
|
|
|
|
|
|
|
|
|
|
|
|
|
|
|
|
|
|
|
|
|
|
|
||||
|
North America* |
|
|
37 |
|
|
7.6 |
|
|
61% |
|
55% |
|
|
|
European Union* |
29 |
|
7.2 |
|
43% |
|
57% |
|
|||||
|
|
|
|
|
|
|
|
|
|
|
|
|
||
|
Other advanced |
|
|
13 |
|
|
4.9 |
|
|
33% |
|
53% |
|
|
|
economies* |
|
|
|
|
|
|
|
|
|
||||
|
|
|
|
|
|
|
|
|
|
|
|
|
|
|
|
Russia* |
|
|
5 |
|
10.7 |
|
35% |
|
55% |
|
|||
|
|
|
|
|
|
|
|
|
|
|
|
|||
|
China* |
|
|
|
58 |
|
|
2.2 |
|
|
17% |
|
50% |
|
|
India |
|
|
21 |
|
0.4 |
|
4% |
|
17% |
|
|||
|
|
|
|
|
|
|
|
|
|
|
|
|||
|
Africa |
|
|
|
21 |
|
|
0.3 |
|
|
10% |
|
18% |
|
|
Latin America |
12 |
|
1.0 |
|
27% |
|
32% |
|
|||||
|
|
|
|
|
|
|
|
|
|
|
|
|
||
|
Other emerging |
|
|
39 |
|
|
1.2 |
|
|
44% |
|
31% |
|
|
|
economies* |
|
|
|
|
|
|
|
|
|
||||
|
|
|
|
|
|
|
|
|
|
|
|
|
|
|
|
World |
|
|
235 |
|
2.4 |
|
41% |
|
39% |
|
|||
* Indicates markets with major heating demand as a share of total final energy consumption in the buildings sector. Russia = the Russian Federation; China = the People’s Republic of China.
Notes: m2 = square metre. Excludes traditional use of solid biomass and does not include natural gas use in production of commercial heat.
Source: IEA 2019. All rights reserved.
PAGE | 146
IEA. All rights reserved.

The Future of Hydrogen |
Chapter 5: Opportunities for hydrogen in transport, buildings and power |
Blending hydrogen into natural gas for heating
In major heating markets like Canada, the United States and Western Europe, blending low shares of hydrogen – 3–5% hydrogen by volume – into supplied natural gas would have little impact on end-use equipment such as boilers and gas cookstoves. As described in Chapter 3, 20% blend shares in 14 buildings in Ameland (the Netherlands) found no problems with leakage, flame stability, back firing or ignition, nor were there problems with pipes or heating equipment at 30%. Other projects around the world have tested specific pieces of equipment, with similar conclusions.
Rigorous testing to ensure system safety, efficiency and environmental performance in the long run would nonetheless be required as the general tolerance of domestic appliances at higher blends cannot be assumed, especially for older equipment. In parallel, it would make sense to ensure that any infrastructure or equipment upgrades were compatible with a possible switch to higher shares of hydrogen.
Blending hydrogen can create dependable demand for hydrogen through its early deployment phase, but managing the cost impacts is a key challenge for policy makers. Taking an illustrative example, if hydrogen were blended into all natural gas use around the world at just 3% by volume, this would boost clean hydrogen demand by close to 12 MtH2/yr. This would be a significant scaleup of hydrogen supply, equivalent to about 17% of current global dedicated hydrogen production. This could potentially have a major impact on the costs of hydrogen supply technologies through expansion of manufacturing and installation, but would add around 3–15% to natural gas supply costs. Many markets are currently close to the tipping point between gas and electricity prices that could trigger a switch to higher-performance heat pump technologies – including hybrid or gas thermal heat pumps – where they are appropriate, especially for new construction (Figure 59). Increases in gas prices resulting from blending mandates or incentives would risk losing gas customers, something to be considered in policy design.
Figure 59. Spread of energy prices, performance and operational costs for gas and electric heating equipment in IEA countries, 2017
USDper kWh-eq |
0.5 |
|
|
|
|
|
|
|
|
|
|
|
Seasonalefficiency factor |
7.5 |
|
|
|
|
|
|
|
|
USDper kWh-eq |
0.25 |
|
|
|
|
|
|
|
|
|
|
|
|
|
|
|
|
|
|
|
|
|
|
|
|
|
|
|
|
|
|
|
|
|
|
|||||||||||
|
|
|
|
|
|
|
|
|
|
|
|
|
|
|
|
|
|
|
|
|
|
|||||||||||||
0.2 |
|
|
|
|
|
|
|
|
|
|
|
3 |
|
|
|
|
|
0.1 |
|
|
|
|
|
|
|
|
|
|
||||||
|
|
|
|
|
|
|
|
|
|
|
|
|
|
|
|
3.10 |
|
|
|
|
|
|
|
|
|
|
||||||||
|
0.4 |
|
|
|
|
|
|
|
|
|
|
|
|
6 |
|
|
|
|
|
|
|
|
|
0.2 |
|
|
|
|
|
|
|
|
|
|
|
0.3 |
|
|
|
|
|
|
|
|
|
|
0.23 |
|
4.5 |
|
|
|
|
|
|
|
|
|
0.15 |
|
|
|
|
|
|
|
|
|
|
|
|
|
|
|
|
|
|
|
|
|
|
|
|
|
|
|
|
|
|
|
|
|
|
|
|
|
|
|
|
|||||
|
|
|
|
|
|
|
|
|
|
|
|
|
|
|
|
|
|
|
|
|
|
|
|
|
|
|
|
|
|
|||||
|
|
|
|
|
|
|
|
|
|
|
|
|
|
|
|
|
|
|
|
|
|
|
|
|
|
|
|
|
|
|
|
|
|
|
|
0.1 |
|
|
|
|
|
|
|
|
|
|
|
|
1.5 |
|
|
|
|
|
|
|
|
|
|
|
|
|
|
0.08 |
|
|
|
0.07 |
|
|
|
|
|
|
|
|
|
|
|
|
|
|
|
|
|
|
|
|
|
|
|
|
|
|
|
|||||||||
|
|
|
|
|
|
|
|
|
|
|
|
|
|
|
|
|
|
|
|
|
|
0.05 |
|
|
|
|
|
|
|
|
|
|
||
|
|
|
|
0.08 |
|
|
|
|
|
|
|
|
|
|
|
|
|
|
|
|
||||||||||||||
|
|
|
|
|
|
|
|
|
|
|
|
|
|
|
0.92 |
|
|
|
|
|
|
|
|
|
|
|
|
|
|
|
||||
|
0 |
|
|
|
|
|
|
|
|
|
|
|
|
|
|
|
|
|
|
|
|
|
|
|
|
|
|
|
|
|
|
|||
|
|
|
|
|
|
|
|
|
|
|
|
|
|
|
|
|
|
|
|
|
|
|
|
|
|
|
|
|
|
|||||
|
|
|
|
|
|
|
|
|
|
|
|
|
0 |
|
|
|
|
|
|
|
|
|
0 |
|
|
|
|
|
|
|
|
|
|
|
|
|
Natural gas |
Electricity |
|
|
Gas boiler |
Electric heat |
|
|
|
|
|
|
|
|
|
|
|
||||||||||||||||
|
|
|
|
|
|
|
|
Gas boiler |
Electric heat |
|||||||||||||||||||||||||
|
|
|
|
|
|
|
|
|
|
|
|
|
|
|
|
|
|
|
pump |
|
|
|
|
|
|
|
|
pump |
||||||
|
|
|
|
|
Energy prices |
|
|
|
Energy performance |
|
|
|
|
Operational cost |
||||||||||||||||||||
Notes: kWh-eq = kilowatt hour equivalent. Prices are residential prices, including taxes, in USD 2017 using purchasing power parities. Source: IEA 2019. All rights reserved.
Relative gas and electricity prices are finely poised in many countries between levels that would make heat pumps or gas boilers the most cost-effective for new installations.
PAGE | 147
IEA. All rights reserved.

The Future of Hydrogen |
Chapter 5: Opportunities for hydrogen in transport, buildings and power |
Shares higher than 20% hydrogen in the natural gas network could be achieved through hydrogen-based fuels. However, injecting synthetic methane, which would avoid the need to replace existing equipment in most instances, would likely raise gas prices much higher than pure hydrogen blends per unit of energy delivered.
100% hydrogen use for heating
From the perspective of costs, 100% hydrogen use in buildings (e.g. via a fuel cell or hydrogen boiler) appears most attractive for relatively large commercial buildings or building complexes, and for district energy networks. Fuel cells, co-generation units or other hybrid systems could be used in such cases with energy storage capacity (provided by thermal storage or via a district energy network) to meet heating, cooling and electricity demand, taking advantage of on-site renewables or low electricity prices. Fuel cell and co-generation technologies could equally be used in district energy networks, which when paired with storage (either thermal or hydrogen) could improve power system balancing across the year, avoiding large seasonal peaks and enabling greater flexibility in the grid. Paired with large-scale heat pumps, those district energy solutions could also dramatically increase the overall efficiency of heat production for buildings.
For the broader buildings market, particularly for residential housing, the prospects for hydrogen conversion in the longer term will depend on several critical factors, notably hydrogen price and technology cost. Prices of hydrogen delivered to consumers would likely need to be in the range of USD 1.5–3.0/kgH2 in many major heating markets for hydrogen to compete with natural gas boilers and electric heat pumps (Figure 60).52 Higher final prices in the range of USD 3–4/kgH2 might still be competitive with natural gas prices in some countries or for some building types (and eventual CO2 pricing would narrow that spread), while in other countries with low gas prices, such as Canada, prices would probably need to be below USD 1/kgH2.
Figure 60. Potential hydrogen demand for heating in buildings and spread of competitive energy prices in selected markets, 2030
Mt
8
6
4
2
0
Canada |
United |
Japan |
Korea |
Western |
Russia |
China |
|
States |
|
|
Europe |
|
|
4 |
per kg) |
|
|
3 |
price (USD |
2 |
Hydrogen |
|
1
0
 Hydrogen
demand
 Competitive with gas boiler (right axis)
 Competitive with electric heat pump (right axis)
Notes: Prices are average retail prices, including taxes, in USD 2017. Natural gas demand is for space heating and hot water production and includes building envelope improvements to 2030 under a Paris-compatible pathway. Competitiveness of electric heat pumps assumes a typical seasonal efficiency of the heat pump in those countries. Price competitiveness does not include capital costs of the equipment.
Source: IEA 2019. All rights reserved.
Final energy prices for hydrogen are likely to have to be in the range USD 1.5–3.0/kgH2 in major heating markets in order to compete with natural gas and electricity in providing heat in buildings.
52 This also depends on the type of heat pump, its efficiency in the prevailing climate and the building’s energy performance.
PAGE | 148
IEA. All rights reserved.

The Future of Hydrogen |
Chapter 5: Opportunities for hydrogen in transport, buildings and power |
It will not necessarily be enough for a product to offer lower running costs over time if it is more expensive at the outset. Consumers often give more weight to upfront purchase prices than to overall lifetime costs. Heating equipment costs vary substantially depending on factors such as unit capacity, brand, availability in local markets and overall size of product demand. In addition, consumer preference will also matter on issues such as safety and ease of installation. Moreover some types of building will be better suited to the use of hydrogen than others. Large-scale co-generation, for example, may be more cost-effective in terms of both capital and operational expenditure for large commercial buildings than for small-scale residential ones. Similarly, large-scale fuel cell co-generation may be well-suited to the supply of renewable electricity to buildings adapted with high-performance heat pumps and clean district heat (as a replacement for hard-to-convert gas-based systems), but less well-suited to other types of buildings.
If 100% hydrogen is ultimately able to compete in terms of capital and operational costs in some markets, the market potential in buildings is very large indeed. Heat demand will inevitably remain central to energy demand in buildings, even in a low-carbon context. In a Paris-compatible pathway, heat demand would be expected to represent more than half of global building energy consumption in 2030, with about 500 Mtoe of natural gas used for space and water heating in buildings annually. Of this, theoretical potential hydrogen demand might be on the order of 12–20 MtH2/yr in key markets (Canada, the United States, Western Europe, Japan, Korea, the Russian Federation [“Russia”] and China) if all gas boiler equipment installed or replaced at expected stock turnover rates between today and 2030 were hydrogen-ready (Table 8). Combining this with low-concentration hydrogen blends in the wider natural gas grid gives an upper bound of 14– 24 MtH2 global hydrogen demand in 2030.
Table 8. 2030 natural gas demand for heat in buildings and indicative theoretical hydrogen demand in selected regions
|
|
|
|
|
Natural gas demand |
|
Competitive price range |
|
Indicative hydrogen |
|
|
Region |
|
|
|
|
for hydrogen |
|
|
||
|
|
|
|
(Mtoe) |
|
|
demand (MtH2) |
|
||
|
|
|
|
|
|
(USD/kgH2) |
|
|
||
|
|
|
|
|
|
|
|
|
|
|
|
|
|
|
|
|
|||||
|
Canada |
|
|
|
21 |
|
0.8–1.2 |
|
0.7–1.1 |
|
|
|
|
|
|
|
|
|
|
|
|
|
United States |
147 |
|
1.2–1.5 |
5.1–7.7 |
|||||
|
|
|
|
|
|
|||||
|
Western Europe |
|
|
|
80 |
|
2.0–3.0 |
|
0.5–0.7 |
|
|
|
|
|
|
|
|
|
|
|
|
|
Japan |
14 |
|
2.0–3.5 |
0.4–0.6 |
|||||
|
|
|
|
|
|
|||||
|
Korea |
|
|
|
11 |
|
0.9–1.9 |
|
2.8–4.2 |
|
|
|
|
|
|
|
|
|
|
|
|
|
Russia |
43 |
|
1.5–1.8 |
1.5–2.2 |
|||||
|
|
|
|
|
|
|||||
|
China |
|
|
|
51 |
|
1.2–1.4 |
|
1.8–2.7 |
|
|
|
|
|
|
|
|
|
|
|
|
Notes: Natural gas demand is for space heating and hot water production and takes account of building envelope improvements under a Paris-compatible pathway. Indicative demand assumes that hydrogen production, transmission and distribution is within the competitive range shown here and does not include potential hydrogen demand for hydrogen-based fuels. Excludes natural gas use in production of commercial heat. Western Europe includes France, Germany, Italy and the United Kingdom. Indicative of direct hydrogen use in buildings. The indicative demand takes into account typical lifetimes of existing heating equipment in buildings and does not assume early retirement of equipment.
Source: IEA 2019. All rights reserved.
PAGE | 149
IEA. All rights reserved.
The Future of Hydrogen |
Chapter 5: Opportunities for hydrogen in transport, buildings and power |
Achieving these levels of hydrogen use in buildings, and potentially higher levels in the longer term, faces several barriers. These include higher upfront capital costs and higher energy prices for consumers, as well as any safety concerns that consumers may have. In the near term, demonstration projects with strong public and private participation can continue to help identify and find ways of overcoming these barriers, especially if they provide practical information based on:
Urban development patterns. For example, most current demonstration projects are not located in the types of urban areas where most heat demand is and which are generally more challenging to supply with hydrogen. Similarly, demonstration buildings are often single-occupancy or low-density commercial or multifamily residential units that do not illustrate the practical application of hydrogen equipment in dense urban environments or in older buildings where electric or hybrid electric-natural gas heat pumps may be less appropriate, making them a key target opportunity for hydrogen.
Building types. Large-scale co-generation, for instance, may be more cost-effective in terms of both CAPEX and OPEX for large commercial buildings than for small-scale residential ones. Large-scale fuel cell co-generation may also be well-suited to the supply of renewable electricity to buildings equipped with high-performance heat pumps and clean district heat (as a replacement for hard-to-convert gas-based systems), but less suited to other types of buildings.
Realising the potential for hydrogen use in buildings and moving to the use of low-carbon hydrogen will require co-ordination between policy makers, industry and investors, as well as greater engagement with consumers and with the equipment service sector. Installers, for example, may require training or specific skills. Governments can help to facilitate dialogue and remove potential obstacles to the use of hydrogen by measures such as improving policy regulations; providing clear signals about their expectations for the future carbon intensity of heat (including ambitious targets to decarbonise natural gas networks); continuing to improve the evidence base on hydrogen applications for heat in buildings; and supporting innovation.
Hydrogen for power generation and electricity storage
Hydrogen plays a negligible role in the power sector today: it accounts for less than 0.2% of electricity generation. This is linked mostly to the use of gases from the steel industry, petrochemical plants and refineries. But there is potential for this to change in the future. Cofiring of ammonia could reduce the carbon intensity of existing conventional coal power plants, and hydrogen-fired gas turbines and combined-cycle gas turbines could be a source of flexibility in electricity systems with increasing shares of variable renewables. In the form of compressed gas, ammonia or synthetic methane, hydrogen could also become a long-term storage option to balance seasonal variations in electricity demand or generation from renewables (Table 9).
PAGE | 150
IEA. All rights reserved.