

01 POWER ISLAND / 02 H2+NH3 / The_Future_of_Hydrogen-IEA-2020
.pdfThe Future of Hydrogen |
Chapter 4: Present and potential industrial uses of hydrogen |
of domestic HVC production in 2018. Methanol-to-aromatics, which is used to produce more complex HVC molecules, is currently still in the demonstration phase.
Unlike ammonia and methanol, HVCs – the precursors of most plastics – are produced mostly from oil products such as ethane, liquefied petroleum gas and naphtha. HVCs produced directly from oil products do not require hydrogen feedstock, but their production generates by-product hydrogen that can be used in oil refining and other chemical sector operations, such as the upgrading of other cracker by-products. Steam cracking and propane dehydrogenation processes for HVC manufacture produce around 18 MtH2/yr as a by-product globally. HVC demand is growing at a faster rate than refined oil product demand, which means that an increasing quantity of this by-product hydrogen could be available for use in other industries.
Chlor-alkali processes are another source of by-product hydrogen in the chemical sector, supplying around 2 MtH2/yr. While by-product hydrogen generated in the steam cracking process stems from oil products (mainly ethane and naphtha), the chlor-alkali process is a form of electrolysis (of brine) and is powered by electricity. Smaller volumes of by-product hydrogen are also produced from other processes such as styrene production.
How is demand for hydrogen likely to develop in future?
Demand for hydrogen for primary chemical production is set to increase from 44 Mt/yr today to 57 Mt/yr by 2030 as demand for ammonia and methanol grows (Figure 39).28 Demand for ammonia for existing applications is set to increase by 1.7% per year between 2018 and 2030 and to continue to rise thereafter. The share represented by demand for industrial applications grows more quickly during this period; that for nitrogen-based fertilisers is likely to start to plateau or even decline in many regions after 2030.
Demand for methanol for existing applications is set to grow at 3.6% per year between 2018 and 2030. The methanol-to-olefins/methanol-to-aromatics demand segment grows more quickly than the total, at 4.1% per year over the same period, with nearly all this growth coming from China. This rate of growth would require 19 MtH2/yr for methanol production for these existing applications by 2030, compared with 12 MtH2/yr today.
Together with energy efficiency measures, materials efficiency strategies are an important way of reducing emissions in IEA decarbonisation scenarios and could reduce these increases in demand (IEA, 2019b; Allwood and Cullen, 2012). Recycling and reusing plastics and other materials could reduce the amount of future primary chemical production required, although this would be likely to have a less pronounced impact on ammonia and methanol demand than on demand for other primary chemicals such as ethylene. Improving the efficiency with which fertiliser is used could also reduce future demand for chemicals. Specific policies have been announced in some countries to limit fertiliser use, such as the target for zero growth from current levels in China (Shuqin and Fang, 2018).
28 The most recent IEA publication exploring the future evolution of the chemical sector is IEA (2018b), The Future of Petrochemicals.
PAGE | 101
IEA. All rights reserved.

The Future of Hydrogen |
Chapter 4: Present and potential industrial uses of hydrogen |
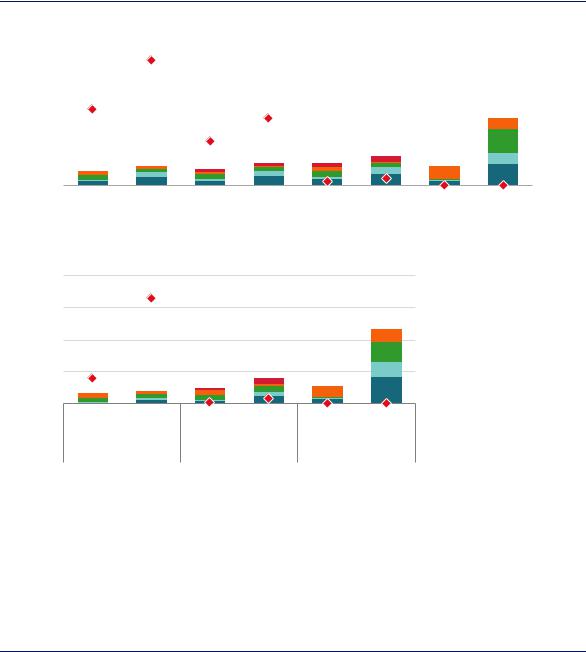
Figure 39. Hydrogen demand for primary chemical production for existing applications under current trends
/yr |
50 |
|
|
|
|
|
/yr |
25 |
|
|
|
|
|
|
|
|
|
|
|
|
|
|
|
|
|
|
|
|
|
||||
|
|
|
|
|
|
|
|
|
|
|
|
|
|
|
||
2 |
|
|
|
|
|
|
2 |
|
|
|
|
|
|
|
|
|
MtH |
40 |
|
|
|
|
|
MtH |
20 |
|
|
|
|
|
|
|
Fertiliser |
|
|
|
|
|
|
|
|
|
|
|
|
|
|
|||
|
|
|
|
|
|
|
|
|
|
|
|
|
|
|||
|
|
|
|
|
|
|
|
|
|
|
|
|
|
|
||
|
|
|
|
|
|
|
|
|
|
|
|
|
|
|
||
|
30 |
|
|
|
|
|
|
15 |
|
|
|
|
|
|
|
MTO/MTA |
|
|
|
|
|
|
|
|
|
|
|
|
|
|
|||
|
20 |
|
|
|
|
|
|
10 |
|
|
|
|
|
|
|
|
|
|
|
|
|
|
|
|
|
|
|
|
|
|
|||
|
|
|
|
|
|
|
|
|
|
|
|
|
|
|||
|
|
|
|
|
|
|
|
|
|
|
|
|
|
Industrial |
||
|
|
|
|
|
|
|
|
|
|
|
|
|
|
|||
|
10 |
|
|
|
|
|
|
5 |
|
|
|
|
|
|
|
|
|
|
|
|
|
|
|
|
|
|
|
|
|
|
|||
|
|
|
|
|
|
|
|
|
|
|
|
|||||
|
|
|
|
|
|
|
|
|
|
|
|
|
|
|||
|
|
|
|
|
|
|
|
|
|
|
|
|
|
|
|
applications |
|
0 |
|
2000 |
2018e |
2030 |
2050 |
|
0 |
|
2000 |
2018e |
2030 |
2050 |
|
|
|
|
|
|
|
|
|
|
||||||||||
|
|
|
|
|
|
|
|
|
||||||||
|
|
|
|
Ammonia |
|
|
|
|
|
Methanol |
|
|
|
|
||
Notes: MTO = methanol-to-olefins; MTA = methanol-to-aromatics. Industrial applications for methanol include current fuel additive uses (e.g. methyl-tert-butyl-ether) and thermoset plastics (e.g. phenol formaldehyde). Industrial applications for ammonia include explosives (e.g. ammonium nitrate) and plastics (e.g. urea formaldehyde). Demand figures for 2030 and 2050 are consistent with those of the Reference Technology Scenario (IEA, 2018b), in which current trends are maintained. Data for 2018 are estimates based on previous years’ figures from the sources below.
Sources: IFA (2019), International Fertilizer Association Database; WoodMackenzie (2018), Methanol Production and Supply Database.
Hydrogen demand for ammonia and methanol for existing applications is set to rise.
Conversely, demand for ammonia and methanol could rise further if these chemicals were to become established as energy carriers for the transmission, distribution and storage of hydrogen, facilitating its use in new applications, or if they were to be used as fuels in their own right (see Chapters 2 and 3). If these new applications were to become widespread, the chemical sector could evolve to share the role that refineries play today in providing energy to downstream users.
Without any change in the current economics or regulation of production, current growth trajectories for chemical products are likely to lead to a growth in hydrogen production from natural gas and coal without the application of CCUS. Projecting forward current trends, this growth would cause total direct CO2 emissions from ammonia and methanol production to rise by around 20% between 2018 and 2030.
Meeting future hydrogen demand in the chemical sector while reducing emissions
The global production of ammonia and methanol currently generates CO2 emissions of around 630 MtCO2/yr.29 The global average direct emissions intensity of ammonia production is 2.4 tonnes of CO2 per tonne (tCO2/t), with average intensities for major regions in the range of 1.6–2.7 tCO2/t. New gas-based plants in the Asia Pacific region tend to be at the lower end of this range, whereas pure coal-based production (around 4 tCO2/t), widespread in China, constitutes the most CO2-intensive production route. For methanol the global average figure
29 This excludes the approximately 130 MtCO2/yr of concentrated CO2 streams that are separated and utilised to manufacture urea. A large proportion of this embedded CO2 is re-emitted in the agricultural sector when urea is applied to soils.
PAGE | 102
IEA. All rights reserved.

The Future of Hydrogen |
Chapter 4: Present and potential industrial uses of hydrogen |
is 2.3 tCO2/t, with average intensities for major regions in the range of 0.8–3.1 tCO2/t. As for ammonia, production based purely on coal is the most emissions-intensive pathway.
The production of HVCs is responsible for a further 250 MtCO2/yr of CO2 emissions. However, the key mitigation options currently under development (including the direct application of CCUS to existing process units, dry methane reforming and steam cracker electrification) do not involve additional dedicated hydrogen production. HVCs could also be produced from methanol, but this would similarly not involve additional hydrogen production beyond that required for the methanol. The focus in this section is therefore on ammonia and methanol.
Alternative process technologies and feedstocks could meet growing demand for large quantities of dedicated hydrogen feedstock in the chemical sector for ammonia and methanol while reducing CO2 emissions (Box 9). The three main cleaner process technology options are: using CCUS to reduce fossil fuel-related emissions (assuming sufficient CO2 transport and storage infrastructure is in place); using electrolysis-derived hydrogen (assuming a renewable electricity supply); and using biomass feedstocks (assuming a sustainable supply of bioenergy). Today all of these options are more costly than using fossil fuels without CCUS.
Box 9. Existing and planned low-carbon ammonia and methanol production
Three facilities in the United States were capturing CO2 from the production of hydrogen for ammonia-based fertilisers in 2018. In total, these operational plants have the capacity to produce over 150 ktH2/yr of low-carbon hydrogen and capture nearly 2 MtCO2/yr. The captured CO2 is currently fed into pipelines and used for EOR (IEA, 2016). By 2022 four similar projects are set to be commissioned. Two of these are in the United States, one is in Canada and one is in China, and all but one plan to sell the CO2 for EOR. EOR is likely to offer declining opportunities for use of CO2 in the long term (as oil production declines), and is not an option in all geographies. A further, larger project in south Western Australia is planned for operation by 2025, with a portion of the captured 2.5 MtCO2/yr coming from hydrogen production for ammonia fertiliser and destined for geological storage without EOR.
Since late 2018 Yara, the world’s largest ammonia producer, has been using by-product hydrogen from a steam cracker to reduce its consumption of natural gas (and a reported 10 ktCO2/yr of emissions) in an existing ammonia plant in the Netherlands (Brown, 2019). In collaboration with the energy company ENGIE, Yara is now assessing the feasibility of integrating electrolysis-based hydrogen into its operations in Australia (ENGIE, 2019). Feasibility studies are also being undertaken for electrolytic hydrogen projects in Chile (German Government, 2018) and Morocco (Fraunhofer IMWS, 2018). Work is also being undertaken in Iowa in the United States to produce ammonia using hydrogen from solar-powered electrolysis for use as a fertiliser and a fuel (Schmuecker Pinehurst Farm LLC, 2017), and there are similarscale research and pilot facilities in Oxford in the United Kingdom and Minnesota in the United States.
VärmlandsMetanol AB and ThyssenKrupp Industrial Solutions plan to commission the world’s first commercial-scale biomass gasification demonstration plant in Sweden to produce methanol
PAGE | 103
IEA. All rights reserved.

The Future of Hydrogen |
Chapter 4: Present and potential industrial uses of hydrogen |
|
|
|
|
(VärmlandsMetanol AB, 2017). The process will use similar equipment to coal-based methanol production, currently widespread in China and being investigated as a prospect for substituting natural gas consumption in India (ET Energy World, 2018). Methanol is also being produced from biogas by BioMCN in the Netherlands (BioMCN, 2019) and from municipal solid waste in Canada (Enerkem, 2019). The Carbon2Chem, Steelanol and Vulcanol projects in Europe, and a Mitsui Chemicals project in Japan, seek to make use of the CO2 (and CO) from steel production and power generation to produce methanol, among other chemicals.
Sources: Brown (2019), “Ammonia plant revamp to decarbonize: Yara Sluiskil”; ENGIE (2019), “ENGIE and YARA take green hydrogen into the factory”; German Government (2018), “’Green’ hydrogen beckons for Chilean industry”; Fraunhofer IMWS (2018), “Fraunhofer IMWS and OCP Group sign Memorandum of Understanding”; Schmuecker Pinehurst Farm LLC (2017), Carbon Emission Free Renewable Energy; VärmlandsMetanol AB (2017), “In short about VärmlandsMetanol Ltd”; ET Energy World (2018), “Task force to study feasibility of making methanol from coal”; BioMCN (2019), “BioMCN produces methanol and bio-methanol”; Enerkem (2019), “Enerkem enables the chemical industry to achieve sustainability by recycling carbon from garbage”.
Using biomass for ammonia and methanol production looks significantly less cost-competitive than the other options (Figure 41), so the focus in the analysis in this section is on the use of natural gas with CCUS and on the use of electrolytic hydrogen.
Meeting future ammonia and methanol demand entirely from these cleaner pathways would considerably increase demand for energy inputs to the chemical sector (Figure 40). If future demand in a Paris-compatible pathway were to be met entirely with hydrogen produced from natural gas with CCUS, around 320 bcm of natural gas would be required by 2030, nearly half of which would be used as feedstock. This is around 10% of global natural gas demand today. Around 450 MtCO2/yr would need to be captured, although around one-third of this could be used to produce urea. The largest carbon capture installations today are in the region of 1 MtCO2/yr. Capturing 450 MtCO2/yr by 2030 would require around 450 new projects of this size to be operational by this date, with a build rate of around 4 new projects per month between now and 2030.
If future demand were to be met entirely from low-carbon electrolytic hydrogen, this would require around 3 020 terawatt hours per year (TWh/yr) of additional electricity by 2030, equivalent to around 11% of today’s global electricity generation. It would also require 350– 450 GW of electrolyser capacity, depending on efficiency levels and capacity factors. The largest individual electrolysers currently under development are at the 100+ MW scale, meaning that 3 500–4 000 such installations would need to be constructed by 2030, or 6–7 per week between 2018 and 2030. Around 0.6 billion cubic metres per year (bcm/yr) of water would also be needed as feedstock for the electrolysers, which is around 1% of total water consumption in the energy sector today. Some 0.5 gigatonnes per year (Gt/yr) of oxygen would be produced as a by-product, which could be used in other industrial processes.
The electrolysis pathway would use some CO2 for the manufacture of urea (CH4N2O) and methanol (CH3OH).30 To avoid fossil fuel use in methanol synthesis altogether in 2030, 200 MtCO2/yr (or the equivalent amount of carbon monoxide, if available) would need to be
30 In the case of urea, this embedding of CO2 is only temporary, as it is re-released as the urea decomposes during application in the agricultural sector. For methanol the sequestering of the CO2 could theoretically be permanent, although many methanol applications today involve the carbon in methanol (and its chemical derivatives) being oxidised back to CO2 and released.
PAGE | 104
IEA. All rights reserved.

The Future of Hydrogen |
Chapter 4: Present and potential industrial uses of hydrogen |
sourced and captured from biogenic (e.g. biomass gasification) or atmospheric (e.g. direct air capture) sources. A further 170 MtCO2/yr or equivalent would be required for urea.
In the absence of an economic source of biogenic or atmospheric CO2, it would still be beneficial to capture and utilise CO2 streams from unabated stationary point sources of CO2 (e.g. steel and cement production). These are likely to remain much cheaper in the short to medium term. However, the total emissions avoided would be much lower unless that CO2 would otherwise unavoidably have been emitted (Chapter 2). Geographically matching locations of low-cost renewable electricity, water availability and persistent CO2 sources that are not prohibitively expensive presents a significant challenge.
Figure 40. The implications of cleaner process routes for methanol and ammonia production
2018 |
649 Mt/yr |
Energy and hydrogen requirements for ammonia and methanol production |
2030 |
824 Mt/yr |
|
Methanol 142 |
|
|
|
Coal |
Gas |
Electricity |
Hydrogen |
|
|
(Mtoe) |
(bcm) |
(TWh) |
(Mt) |
|
Current |
53 |
171 |
|
44 |
|
technology |
132 |
||||
|
|
|
|||
|
|
|
|
NG w/CCUS |
323 |
|
|
85 |
56 |
|
|
|
Electrolysis |
3 020 |
56 |
Notes: NG = natural gas; w/ = with. Best practice energy performance used for 2030 natural gas estimates. 2030 electrolyser efficiency = 69% on an LHV basis. Demand figures for 2030 are consistent with those of the Clean Technology Scenario (IEA, 2018a), a scenario in which the goals of the Paris Agreement are achieved, including the implementation of materials efficiency strategies. Bubbles denoting energy and hydrogen requirements are sized on an LHV energy content basis. The hydrogen and energy quantities are equivalent, and not additive.
Source: IEA 2019. All rights reserved.
Satisfying the entire demand for ammonia and methanol through low-carbon production would require 323 bcm of natural gas paired with CCUS, or 3 020 TWh/yr of renewable electricity by 2030.
Cost competitiveness of cleaner pathways
Cleaner ways of producing ammonia and methanol have higher costs than those that are commercially available today. Production costs vary widely, however, between regions, depending on the costs of in each region of natural gas, coal, biomass and electricity (Figure 41).
PAGE | 105
IEA. All rights reserved.
The Future of Hydrogen Chapter 4: Present and potential industrial uses of hydrogen
Figure 41. Costs and CO2 intensities for greenfield ammonia and methanol production in 2018
|
2000 |
|
Ammonia |
|
|
|
|
|
|
|
|
|
|
|
4 |
|
|
(USD/t) |
|
|
|
|
|
|
|
|
|
|
|
(tCO |
|||||
|
|
|
|
|
|
|
|
|
|
|
|||||||
|
|
|
|
|
|
|
|
|
|
|
|
|
|
|
|
|
/t) |
|
|
|
|
|
|
|
|
|
|
|
|
|
|
|
|
|
2 |
cost |
1500 |
|
|
|
|
|
|
|
|
|
|
|
3 |
intensity |
|||
|
|
|
|
|
|
|
|
|
|
|
|||||||
|
|
|
|
|
|
|
|
|
|
|
|
|
|
|
|
||
Levelised |
1000 |
|
|
|
|
|
|
|
|
|
2 |
||||||
|
|
|
|
|
|
|
|
|
CO Direct |
||||||||
|
|
|
|
|
|
|
|
|
|
|
|||||||
|
|
|
|
|
|
|
|
|
|
|
|
|
|
|
|
|
2 |
|
500 |
|
|
|
|
|
|
|
|
|
|
|
|
|
1 |
|
|
|
|
|
|
|
|
|
|
|
|
|
|
|
|
||||
|
0 |
|
NG |
Coal |
|
NG |
Coal |
|
NG |
Coal |
|
Electrolysis Biomass |
|
0 |
|
||
|
|
|
|
|
|
|
|||||||||||
|
|
|
|
|
|
|
|
|
|||||||||
|
|
|
|
|
|
w/CCUS |
w/CCUS |
|
w/CCUS |
w/CCUS |
|
|
|
|
|
|
|
|
|
|
Unabated |
|
With conc. capture |
|
With total capture |
|
No net direct emissions |
|
|
|
|||||
Methanol
Levelised cost (USD/t)
1600
1200
800
400
0
4 |
/t) |
|
|
||
|
2 |
|
3 |
(tCO |
|
intensity |
||
2 |
||
|
||
|
2 |
|
1 |
CO |
|
Direct |
||
0 |
||
|
NG |
Coal |
NG |
Coal |
Electrolysis Biomass |
|
|
w/CCUS |
w/CCUS |
|
Unabated |
With total capture |
No net direct emissions |
||
Range
 CCUS costs
 Feedstock
 Fuel
Fuel
 OPEX
OPEX
 CAPEX
CAPEX
 Net direct CO2 intensity
Notes: conc. = concentrated; t = tonne. CCUS costs includes the costs of capturing, transporting and storing CO2. Range refers to the range of total levelised costs across regions, with the lower end of the range (the best case for each technology) disaggregated for each technology. It is assumed that the electrolysis route is supplied with 100% renewable electricity, and the source of the biomass in the relevant routes is sustainably procured with no net CO2 emissions. With total capture describes an arrangement where both processand energy-related emissions are captured, whereas With conc. capture describes an arrangement where only process emissions are captured. More information on the assumptions is available at www.iea.org/hydrogen2019.
Source: IEA 2019. All rights reserved.
Low-carbon ammonia and methanol production today is significantly more expensive than production using unabated fossil fuels.
In locations with the lowest cost renewable electricity (for example in Chile, Morocco and China), electrolytic hydrogen would be close to being competitive in cost terms with natural gas and coal for ammonia and methanol production, even if they did not use CCUS. While these locations are some way from today’s centres of demand for these products, they might attract future inward investment, although additional costs for buffer storage and other strategies for coping with the intermittency of variable renewables could raise the costs above those shown in Figure 41. Transporting renewable electricity to the main demand centres is another option, but would also involve additional costs (Box 4 in Chapter 2).
Much of the technology and equipment required for the cleaner pathways in the chemical sector is already in widespread use across the industry, including the pumps, compressors and separation units required for CO2 capture. Electrolysers have been constructed at scales above 100 MW in the past, and significant efforts are being made to bring down their costs further
PAGE | 106
IEA. All rights reserved.
The Future of Hydrogen |
Chapter 4: Present and potential industrial uses of hydrogen |
(Chapter 2). The key variables affecting the economics of production via electrolysis and natural gas with CCUS are natural gas and electricity prices (Figure 42).
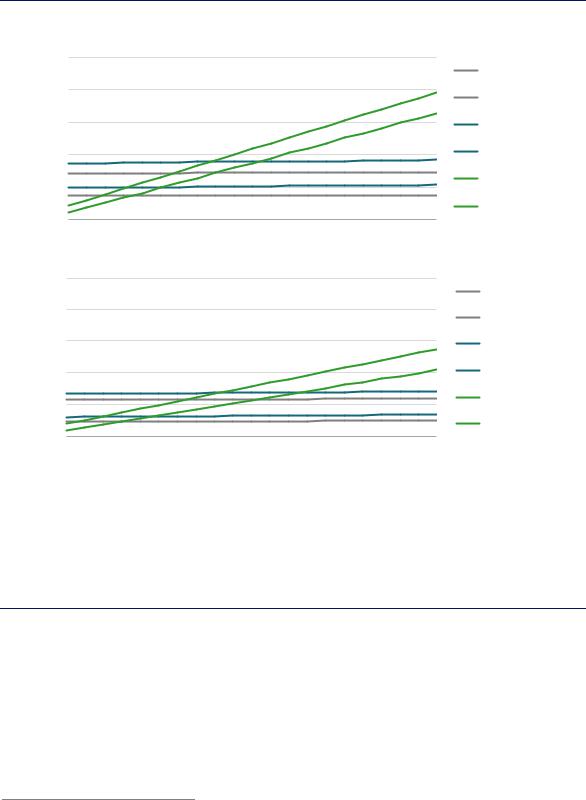
Figure 42. Variation of ammonia and methanol production costs with fuel price in the long-term
(USD/t) |
1500 Ammonia |
|
|
|
|
|
|
|
|
NG unabated (high) |
|
|
|
|
|
|
|
|
|
|
|
||
|
|
|
|
|
|
|
|
|
|
|
|
cost |
1200 |
|
|
|
|
|
|
|
|
|
NG unabated (low) |
|
|
|
|
|
|
|
|
|
|
||
Levelised |
|
|
|
|
|
|
|
|
|
|
|
900 |
|
|
|
|
|
|
|
|
|
NG w/CCUS (high) |
|
|
|
|
|
|
|
|
|
|
|
||
|
600 |
|
|
|
|
|
|
|
|
|
NG w/CCUS (low) |
|
300 |
|
|
|
|
|
|
|
|
|
Electrolysis (high) |
|
|
|
|
|
|
|
|
|
|
|
|
|
|
|
|
|
|
|
|
|
|
|
Electrolysis (low) |
|
0 |
|
|
|
|
|
|
|
|
|
|
|
0 |
10 |
20 |
30 |
40 |
50 |
60 |
70 |
80 |
90 |
100 |
|
|
|
|
|
|
|
|
Electricity cost (USD/MWh) |
|||
|
Methanol |
|
|
|
|
|
|
|
|
|
|
(USD/t) |
1500 |
|
|
|
|
|
|
|
|
|
NG unabated (high) |
|
|
|
|
|
|
|
|
|
|
||
|
|
|
|
|
|
|
|
|
|
|
|
cost |
1200 |
|
|
|
|
|
|
|
|
|
NG unabated (low) |
|
|
|
|
|
|
|
|
|
|
||
|
|
|
|
|
|
|
|
|
|
|
|
Levelised |
900 |
|
|
|
|
|
|
|
|
|
NG w/CCUS (high) |
|
|
|
|
|
|
|
|
|
|
||
|
600 |
|
|
|
|
|
|
|
|
|
NG w/CCUS (low) |
|
300 |
|
|
|
|
|
|
|
|
|
Electrolysis (high) |
|
|
|
|
|
|
|
|
|
|
|
|
|
0 |
|
|
|
|
|
|
|
|
|
Electrolysis (low) |
|
|
|
|
|
|
|
|
|
|
|
|
|
0 |
10 |
20 |
30 |
40 |
50 |
60 |
70 |
80 |
90 |
100 |
|
|
|
|
|
|
|
|
Electricity cost (USD/MWh) |
|||
Notes: The levelised cost includes the cost of CAPEX on core process equipment, fixed OPEX, fuel and feedstock costs, and the cost of capturing, transporting and storing CO2. Best practice energy performance is assumed for natural gas-based routes. Electrolyser CAPEX range = USD 455–894/kWe. Electrolyser efficiency range = 64–74% on an LHV basis. More information on the assumptions is available at www.iea.org/hydrogen2019.
Source: IEA 2019. All rights reserved.
At low electricity prices, electrolysis is the best option for producing low-carbon ammonia and methanol, but natural gas with CCUS is more competitive at higher electricity prices.
Electrolysis becomes competitive with natural gas with CCUS at electricity prices in the range of USD 15–50/MWh for ammonia and in the range of USD 10–65/MWh for methanol, on the assumption of gas prices of USD 3–10/MBtu.31 In order to compete with natural gas without CCUS at these gas prices, however, electricity prices would need to drop to USD 10–40/MWh for ammonia and USD 5–50/MWh for methanol.
While the upper end of these cost-competitive electricity price ranges show promise for alternative pathways, the economics in most regions are such that policy support is likely to be
31 This assumes that electrolyser CAPEX declines by 50% and efficiency increases by 15%, with no corresponding improvement in the efficiency of natural gas conversion or CCUS.
PAGE | 107
IEA. All rights reserved.

The Future of Hydrogen |
Chapter 4: Present and potential industrial uses of hydrogen |
required in the short to medium term if low-carbon forms of production are to take off. Policy measures could stimulate demand for low-carbon hydrogen in the chemical sector and thus stimulate investment in a cleaner supply of hydrogen. These measures could include the use of certificates, public procurement or portfolio standards to create market value for chemicals produced via low-carbon process routes. In the case of methanol produced as a fuel or fuel additive, this could include the use of fuel specifications or fuel standards (Box 8). Governments could also use standards to support ammonia produced with lower CO2 intensity. In the near term, initial projects that take on value chain and market risks to invest in CCUS or electrolysis hydrogen for chemical production are likely to need some direct government support. The support should be aimed at managing these risks and extending the benefits of cost sharing to other facilities in industrial clusters.
Hydrogen in iron and steel production
DRI is a method for producing steel from iron ore. This process constitutes the fourth-largest single source of hydrogen demand today (4 MtH2/yr, or around 3% of total hydrogen used in both pure and mixed forms), after oil refining, ammonia and methanol. Based on current trends, global steel demand is set to increase by around 6% by 2030, with demand for infrastructure and a growing population in developing regions compensating for declines elsewhere.
Like the chemical sector, the iron and steel sector produces a large quantity of hydrogen mixed with other gases as a by-product (e.g. coke oven gas), some of which is consumed within the sector and some of which is distributed for use elsewhere. Virtually all of this hydrogen is generated from coal and other fossil fuels. To reduce emissions, efforts are underway to test steel production using hydrogen as the key reduction agent (as opposed to carbon monoxide derived from fossil fuels), with the first commercial-scale designs expected in the 2030s. In the meantime, low-carbon hydrogen could be blended into existing processes that are currently based on natural gas and coal to lower their overall CO2 intensity.
How does the iron and steel sector use hydrogen today?
More than three-quarters of global steel demand today is met using primary production methods that convert iron ore to steel, as opposed to the secondary production route, which utilises limited supplies of recycled scrap steel (Figure 43).32 The two main primary production routes already involve some production and consumption of hydrogen.
The blast furnace-basic oxygen furnace (BF-BOF) route accounts for about 90% of primary steel production globally. It produces hydrogen as a by-product of coal use. This hydrogen, contained in so-called “works-arising gases” (WAG), is produced in a mixture with other gases such as carbon monoxide.33 WAG is used for various purposes on site, but also transferred for use in other sectors including power generation and, in China, methanol production. The portion utilised within the iron and steel sector is estimated at 9 MtH2/yr today, or around 20% of the global use of hydrogen in mixed forms (i.e. not as pure hydrogen).
32The remaining demand is met by re-melting steel scrap in an electric arc furnace (EAF). Besides the BF-BOF and DRI-EAF routes, there are other routes currently used for primary steel production, such as the smelt reduction process (in combination with a BOF) and the outdated open hearth furnace route. Together these other routes account for around 1% of primary production.
33Coke oven gas typically contains in the range of 39% to 65% hydrogen by volume, whereas blast furnace gas contains in the range of 1% to 5% (European Commission, 2000). BOF gas is another component of WAG, containing 2% to 10% hydrogen by volume.
PAGE | 108
IEA. All rights reserved.

The Future of Hydrogen |
Chapter 4: Present and potential industrial uses of hydrogen |
The direct reduction of iron-electric arc furnace (DRI-EAF) route accounts for 7% of primary steel production globally. It uses a mixture of hydrogen and carbon monoxide as a reducing agent. The hydrogen is produced in dedicated facilities, not as a by-product. Around threequarters of it is produced using natural gas (reforming) and the rest using coal (gasification). It accounts for around 4 MtH2/yr in 2018, or 10% of the use of hydrogen consumed in mixed forms globally.34
Figure 43. Hydrogen consumption and production in the iron and steel sector today
H2 9 MtH2/yr (by-product)
H2 |
4 MtH2/yr (dedicated) |
|
1 809 Mt/yr total steel production in 2018
Other
H2 |
14 MtH2/yr (by-product) |
Notes: Steel quantities estimated based on recent data from the sources below and stated in Mt/yr. Associated hydrogen consumption and production from IEA estimates based on energy statistics and a specific hydrogen requirement for the DRI-EAF route of 43 kgH2/t of DRI. The 4 MtH2/yr consumed in the DRI-EAF route are used as a reduction agent, whereas the 9 MtH2/yr consumed in the BF-BOF route (and associated processes on integrated sites) are mostly combusted.
Source: World Steel Association (2018), Steel Statistical Yearbook 2018. World Steel Association (2019), “World Crude Steel Production - Summary”.
Today the iron and steel sector accounts for 4 MtH2/yr of dedicated hydrogen production. Of the
14 MtH2/yr it produces as a by-product in hydrogen-containing gases, it consumes roughly 9 MtH2/yr, with the remainder exported for use in other sectors.
Potential for future hydrogen demand for iron and steel
Without policy intervention, demand for dedicated hydrogen production in steel-making is expected to grow from the current level of 4 MtH2/yr roughly in line with the gas-based DRIEAF route (Figure 44).35 While the gas-based DRI-EAF can be more energy-intensive than the BF-BOF route, it uses simpler and slightly less capital-intensive equipment.36 It tends to be deployed in regions with low natural gas prices (e.g. the Middle East) or low coal prices (e.g. India).
34Hydrogen requirements for all DRI-EAF processes considered in this publication are estimates based on personal communication with representatives from Voestalpine and other iron and steel sector experts.
35The future use of the hydrogen contained in by-product WAG will continue to be closely integrated with BF-BOF operation. As such it is not a use of hydrogen that could provide a source of demand for alternative hydrogen supplies, such as electrolytic hydrogen or fossil fuels with CCUS.
36There are other important differences between these routes. In the BF-BOF route, raw material preparation is typically done on site (e.g. agglomeration, lime production), and the process is more flexible in the grades of ore it can accept. The granulated slag produced from the BF-BOF route tends to be of greater utility as a by-product than that produced in the DRI-EAF route. Both routes tend to use some scrap alongside iron ore, but the DRI-EAF tends to use more than the BF-BOF. The energy intensity comparison between the two routes is highly sensitive to site-specific conditions, such as the extent of process integration.
PAGE | 109
IEA. All rights reserved.
The Future of Hydrogen |
Chapter 4: Present and potential industrial uses of hydrogen |
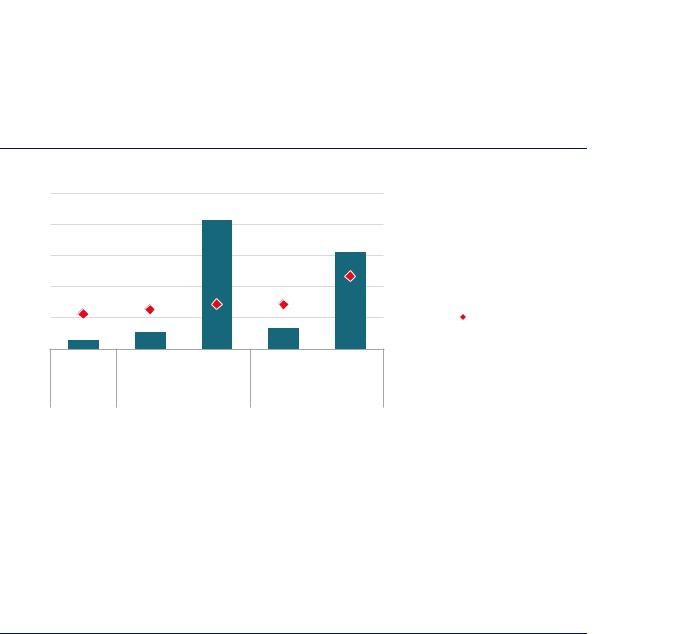
The two main factors to influence future dedicated hydrogen demand for steel production are: the share of the DRI-EAF route in primary steel making, and the split between primary and secondary steel production in overall output. Considering the dynamics of steel stocks in the built environment, on current trends the share of scrap-based production in total steel production is projected to grow from around 23% today to 25% in 2030. In this case, the commercial gas-based DRI-EAF route could supply 14% of primary steel demand. This would require 8 MtH2/yr as a reducing agent (second column of Figure 44), doubling the use of hydrogen for DRI-EAF production from today’s levels. In the same case, if the share of secondary steel production continued to rise (to 29% by 2050) and the gas-based DRI-EAF route was used to satisfy 100% of primary steel demand, hydrogen demand in the sector could theoretically reach 62 MtH2/yr (third column of Figure 12). The two right-hand columns in Figure 12 are described in the next section.
Figure 44. Theoretical potential for dedicated hydrogen demand for primary steel production
MtH2/yr
75
60
45
30
15
0
100%
80%
60%
40%
20%
0%
2018 |
2030 |
2050 |
2030 |
2050 |
|
Current trends to 2030, |
Blending + demo in 2030, |
||
|
100% gas DRI in 2050 100% hydrogen DRI in 2050 |
|||
Share of secondary produciton
Sensitivity of specific hydrogen requirement
 Hydrogen demand
 Share of secondary production
Notes: The 100% gas-based DRI case is one in which the gas-based DRI route grows in line with current trends until 2030, with the 2050 figure showing the theoretical potential if all primary production took place via gas-based DRI. The Blending + demo in 2030, 100% hydrogen DRI in 2050 case is one in which the HYBRIT concept is demonstrated at scale (1.5 Mt/yr) by 2030, and 30% of the feed to the remaining natural gas-based DRI-EAF capacity is substituted with an external hydrogen source. By 2050, the HYBRIT concept accounts for all primary production in this case. In the former case, the share of primary production and overall steel production figures are from a context in which current trends are projected, whereas the latter is one in which action is taken to reach the goals of the Paris Agreement (greater deployment of the secondary route and uptake of materials efficiency strategies). Specific hydrogen requirement assumptions: gas-based DRI-EAF = 43 kgH2/t of DRI; gas-based DRI-EAF with blending = 51-55 kgH2/t of DRI, 23 kg of which could be supplied externally; 100% hydrogen-based DRI-EAF = 47–68 kgH2/t of DRI. 95% DRI charge to the EAF is assumed in all cases. Current DRI-EAF facilities often operate with a higher share of scrap, as this lowers costs.
Source: IEA 2019. All rights reserved.
By 2030 the hydrogen requirement for the DRI-EAF route could more than double. By 2050 the use of this method for all primary production could lead to a 15-fold increase in hydrogen demand.
PAGE | 110
IEA. All rights reserved.