

01 POWER ISLAND / 02 H2+NH3 / The_Future_of_Hydrogen-IEA-2020
.pdfThe Future of Hydrogen |
Chapter 1: Introduction |
|
|
|
|
the report are listed in an annex to the report that is available to download from the IEA website. For ease of use, single values or mid-points are given in the text and figures in many places. In some cases, and in particular for less mature technologies, this approach does not reflect the full range of different values quoted by reliable experts in the field. To the extent possible, other considerations relating to social and political headwinds and tailwinds are highlighted and material provided on the IEA website for readers to explore sensitivity analyses.
For the purposes of illustration, this report presents examples of costs and levels of demand at three different times: today (with 2018 as the base year), 2030, and the long term (the period after 2030). For future time periods, fuel prices, levels of demand and other parameters are extracted from recent IEA global energy system modelling exercises. Where current trends to 2030 are referenced, these are in line with the New Policies Scenario of the IEA World Energy Outlook 2018 (IEA, 2018c). Where pathways compatible with the goals of the Paris Agreement on climate change are referenced, these are in line with the Sustainable Development Scenario (SDS) of the IEA World Energy Outlook 2018. The SDS is fully aligned with the Paris Agreement’s goal of holding the increase in the global average temperature to well below 2°C above pre-industrial levels and pursuing efforts to limit the temperature increase to 1.5°C, as well as with the achievement of the United Nations Sustainable Development Goals on universal access to energy and reducing the severe health impacts of air pollution.
Hydrogen and energy: A primer
How is hydrogen produced and used today?
This report identifies around 70 million tonnes (Mt) of current demand worldwide for “pure” hydrogen, with “pure” meaning that the specific applications require hydrogen with only small levels of additives or contaminants tolerated (Figure 6). The main applications for this hydrogen are oil refining and ammonia production, mainly for fertilisers. A further 45 Mt of demand exists for hydrogen as part of a mixture of gases, such as synthesis gas, for fuel or feedstock. The main applications for hydrogen as part of a mixture of gases are methanol production and steel production. While one-third of hydrogen demand today is for transport sector applications in a broad sense – in refineries and for methanol used in vehicle fuel – less than 0.01 Mt per year of pure hydrogen (less than 0.03 Mtoe) is used in FCEVs, most of which is derived from natural gas.
The overwhelming majority of hydrogen produced today is from fossil fuels, and around 60% of it is produced in “dedicated” hydrogen production facilities, meaning that hydrogen is their primary product. Most of this is produced from natural gas, though some comes from coal, and a small fraction comes from water electrolysis (a process that produces hydrogen from water and electricity). One-third of global supply is “by-product” hydrogen, meaning that it comes from facilities and processes designed primarily to produce something else. This by-product hydrogen often needs dehydrating or other types of cleaning, and can then be sent to a variety of hydrogen-using processes and facilities. Most hydrogen is currently produced near to its end use, using resources extracted in the same country.
PAGE | 31
IEA. All rights reserved.
The Future of Hydrogen |
Chapter 1: Introduction |
Overall, less than 0.7% of current hydrogen production is from renewables or from fossil fuel plants equipped with CCUS. In total, hydrogen production today is responsible for 830 MtCO2/yr. In general, demand for pure hydrogen that is supplied from dedicated facilities is the most straightforward to replace with alternative sources of low-carbon hydrogen.
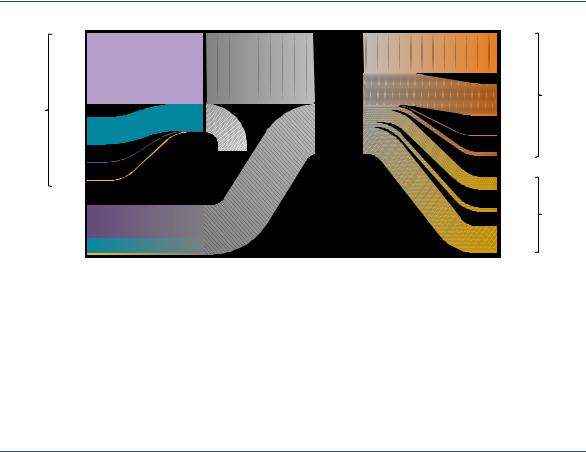
Figure 6. Today’s hydrogen value chains
Natural |
196 Mtoe |
gas |
|
Dedicated |
|
production |
|
Coal |
75 Mtoe |
Oil |
2 Mtoe |
Electricity |
2 Mtoe |
/other |
|
|
48 Mt H2 |
By-product |
of which <0.3 Mt |
hydrogen |
H2 produced with |
|
renewables |
69 Mt H2 |
38 Mt H2 |
Refining |
|
|
|
|
|
of which <0.4 Mt H2 |
produced with CCUS |
|
|
of which <0.1 Mt H2 |
produced with renewables |
|
Demand |
|
31 Mt H2 |
Ammonia |
for pure |
|
hydrogen |
||
|
|
|
|
Losses |
<0.01 Mt H2 Transport |
|
|
|
|
||
|
4 Mt H2 |
Other |
|
|
12 Mt H2 |
Methanol |
|
|
4 Mt H2 |
|
Demand for |
|
DRI |
hydrogen |
|
|
|
|
mixed with |
|
|
Other |
other gases |
|
26 Mt H2 |
|
|
|
e.g. heat |
|
|
Notes: Other forms of pure hydrogen demand include the chemicals, metals, electronics and glass-making industries. Other forms of demand for hydrogen mixed with other gases (e.g. carbon monoxide) include the generation of heat from steel works arising gases and by-product gases from steam crackers. The shares of hydrogen production based on renewables are calculated using the share of renewable electricity in global electricity generation. The share of dedicated hydrogen produced with CCUS is estimated based on existing installations with permanent geological storage, assuming an 85% utilisation rate. Several estimates are made as to the shares of by-products and dedicated generation in various end uses, while input energy for by-product production is assumed equal to energy content of hydrogen produced without further allocation. All figures shown are estimates for 2018. The thickness of the lines in the Sankey diagram are sized according to energy contents of the flows depicted.
Source: IEA 2019. All rights reserved.
Today’s hydrogen industry is large, with many sources and uses. Most hydrogen is produced from gas in dedicated facilities, and the current share from renewables is small.
Chapter 2 provides more detail on the processes and costs of hydrogen production. It concludes that production costs are highly dependent on factors such as electricity costs and taxes, grid fees, natural gas prices, the availability and price of CCUS services, and the capacity utilisation rates of electrolysers. The price of hydrogen varies widely between regions and end uses (different end uses require different volumes, pressures and purity levels of hydrogen); it also varies according to the way that hydrogen is transported.
What does it mean to be a chemical energy carrier and not an energy source?
Hydrogen is not an energy source but an energy carrier, which means that its potential role has similarities with that of electricity. Both hydrogen and electricity can be produced by various energy sources and technologies. Both are versatile and can be used in many different applications. No greenhouse gases, particulates, sulphur oxides or ground level ozone are produced from the use of either hydrogen or electricity. If the hydrogen is used in a fuel cell, it emits nothing but water. However, both hydrogen and electricity can have a high CO2 intensity upstream if produced from fossil fuels such as coal, oil or natural gas. This disadvantage can only be overcome by using renewables or nuclear as the initial energy input, or equipping fossil fuel plants with CCUS.
PAGE | 32
IEA. All rights reserved.

The Future of Hydrogen |
Chapter 1: Introduction |
The crucial difference between hydrogen and electricity is that hydrogen is a chemical energy carrier, composed of molecules and not only electrons. This distinction underpins all the reasons why hydrogen might outcompete electricity in some situations (and vice versa). Chemical energy is attractive because it can be stored and transported in a stable way, as is done today with oil, coal, biomass and natural gas.4 Molecules can be stored for long periods, transported across the sea in ships, burned to produce high temperatures, and used in existing infrastructure and business models designed around fossil fuels. Because of its molecular nature, hydrogen can also be combined with other elements such as carbon and nitrogen to make hydrogenbased fuels that are easier to handle, and can be used as feedstock in industry, helping to reduce emissions.
Without hydrogen a decarbonised energy system based on electricity would be much more flow-based. Flow-based energy systems must match demand and supply in real time, across wide distances, and can be vulnerable to disruptions of supply. Chemical energy can add a stock-based element to an energy economy and thus contribute significantly to energy system resilience.
All energy carriers, including fossil fuels, encounter efficiency losses each time they are produced, converted or used. In the case of hydrogen, these losses can accumulate across different steps in the value chain. After converting electricity to hydrogen, shipping it and storing it, then converting it back to electricity in a fuel cell, the delivered energy can be below 30% of what was in the initial electricity input. This makes hydrogen more “expensive” than electricity or the natural gas used to produce it. It also makes a case for minimising the number of conversions between energy carriers in any value chain.
That said, in the absence of constraints to energy supply, and as long as CO2 emissions are valued, efficiency can be largely a matter of economics, to be considered at the level of the whole value chain. This is important as hydrogen can be used with much higher efficiency in certain applications and has the potential to be produced without greenhouse gas emissions. For example, a hydrogen fuel cell in a vehicle is around 60% efficient, whereas a gasoline internal combustion engine is around 20% efficient, and a modern coal-fired power plant is around 45% efficient, with electricity power line losses accounting for a further 10% or more.
What is the difference between hydrogen and hydrogen-based fuels and feedstocks?
Hydrogen can be used in its pure form as an energy carrier or as an industrial raw material. It can also be combined with other inputs to produce what are referred to as hydrogenbased fuels and feedstocks. Hydrogen-based fuels and feedstocks can be produced using hydrogen from any source, whether electricity, biomass or fossil fuels, and can readily be used in applications such as engines, turbines and chemical processes. They include such derivative products as synthetic methane, synthetic liquid fuels and methanol, all of which require carbon alongside hydrogen. They also include ammonia, which can be used as a chemical feedstock or potentially as a fuel, and which is made by combining hydrogen with nitrogen.
4 Batteries also store chemical energy, but not in the bonds of molecules that can be stored in bulk. In batteries, the chemical energy is a build-up of ions and electrons on cathodes and anodes in specially prepared combinations of chemicals; often these are complex chemicals with poor stability. The chemical energy in batteries degrades more quickly over time.
PAGE | 33
IEA. All rights reserved.

The Future of Hydrogen |
Chapter 1: Introduction |
This report considers the production and use of both hydrogen and hydrogen-based fuels and feedstocks. They all generate demand for hydrogen, and they can all contribute to energy security as well as to decarbonisation, although different production routes will have different CO2 intensities.
Power-to-X is a commonly used term for the conversion of electricity to other energy carriers or chemicals, generally through hydrogen produced by the electrolysis of water. The “X” can stand for any resulting fuel, chemical, power or heat. For example, power-to-gas refers to the production of electrolytic hydrogen itself or synthetic methane produced from electrolytic hydrogen combined with CO2. Likewise, power-to-liquids refers to the production of hydrogenbased liquid fuels. Together, hydrogen-based fuels that integrate electrolytic hydrogen are sometimes referred to as “electrofuels” or, in the very specific case of power from solar energy, solar fuels.5
Why do some people talk about black, blue, brown, green and grey hydrogen?
In recent years, colours have been used to refer to different sources of hydrogen production. “Black”, “grey” or “brown” refer to the production of hydrogen from coal, natural gas and lignite respectively. “Blue” is commonly used for the production of hydrogen from fossil fuels with CO2 emissions reduced by the use of CCUS. “Green” is a term applied to production of hydrogen from renewable electricity. In general, there are no established colours for hydrogen from biomass, nuclear or different varieties of grid electricity. As the environmental impacts of each of these production routes can vary considerably by energy source, region and type of CCUS applied, colour terminology is not used in this report.
This report highlights low-carbon hydrogen production routes. This includes hydrogen from renewable and nuclear electricity; it also includes hydrogen from biomass and fossil fuels with CCUS, provided that upstream emissions are sufficiently low, that CO2 capture is applied to all the associated CO2 streams, and that the CO2 is prevented from reaching the atmosphere. The same principle applies to low-carbon hydrogen-based fuels and feedstocks made using lowcarbon hydrogen and a sustainable carbon source.
What are the most relevant physical properties of hydrogen?
Hydrogen contains more energy per unit of mass than natural gas or gasoline, making it attractive as a transport fuel (Table 2). However, hydrogen is the lightest element and so has a low energy density per unit of volume. This means that larger volumes of hydrogen must be moved to meet identical energy demands as compared with other fuels. This can be achieved, for example, through the use of larger or faster-flowing pipelines and larger storage tanks. Hydrogen can be compressed, liquefied, or transformed into hydrogen-based fuels that have a higher energy density, but this (and any subsequent re-conversion) uses some energy.
5 Broader definitions have been noted elsewhere, with electrofuels including biochemical processes that use electricity as an input, but do not pass via electrolytic hydrogen as an intermediate (Ridjan, 2016).
PAGE | 34
IEA. All rights reserved.

The Future of Hydrogen Chapter 1: Introduction
Table 2. |
Physical properties of hydrogen |
|
|
||
|
|
|
|
|
|
|
Property |
|
Hydrogen |
|
Comparison |
|
|
|
|
|
|
|
Density (gaseous) |
0.089 kg/m3 (0°C, 1 bar) |
|
1/10 of natural gas |
|
|
Density (liquid) |
70.79 kg/m3 (-253°C, 1 bar) |
|
1/6 of natural gas |
|
|
Boiling point |
-252.76°C (1 bar) |
|
90°C below LNG |
|
|
Energy per unit of mass (LHV) |
120.1 MJ/kg |
|
3x that of gasoline |
|
|
|
|
|
|
|
|
Energy density (ambient cond., LHV) |
0.01 MJ/L |
|
1/3 of natural gas |
|
|
Specific energy (liquefied, LHV) |
8.5 MJ/L |
|
1/3 of LNG |
|
|
|
|
|
|
|
|
Flame velocity |
346 cm/s |
|
8x methane |
|
|
Ignition range |
4–77% in air by volume |
|
6x wider than methane |
|
|
|
|
|
|
|
|
Autoignition temperature |
585°C |
|
220°C for gasoline |
|
|
Ignition energy |
0.02 MJ |
|
1/10 of methane |
|
Notes: cm/s = centimetre per second; kg/m3 = kilograms per cubic metre; LHV = lower heating value; MJ = megajoule; MJ/kg = megajoules per kilogram; MJ/L = megajoules per litre.
What are the health and safety considerations?
Like other energy carriers, hydrogen presents certain health and safety risks when used on a large scale. Safety considerations and incidents can slow, or even prevent, the deployment of a new energy technology if the risks are not well communicated and managed. CCUS is a salient example, and lithium-ion batteries have also faced concerns. On the other hand, the health and safety impacts of established energy products – gasoline, diesel, natural gas, electricity, coal – for consumers are familiar and rarely questioned, showing that risks – including flammability, presumed carcinogenicity and toxicity – can be managed to the satisfaction of users.
As a light gas of small molecules, hydrogen requires special equipment and procedures to handle it. Hydrogen is so small it can diffuse into some materials, including some types of iron and steel pipes, and increase their chance of failure. It also escapes more easily through sealings and connectors than larger molecules, such as natural gas. Chapter 3 discusses the considerable potential for use of existing natural gas infrastructure despite these issues.
Hydrogen is a non-toxic gas, but its high flame velocity, broad ignition range and low ignition energy make it highly flammable. This is partly mitigated by its high buoyancy and diffusivity, which causes it to dissipate quickly. It has a flame that is not visible to the naked eye and it is colourless and odourless, making it harder for people to detect fires and leaks. There are already many decades of experience of using hydrogen industrially, including in large dedicated distribution pipelines. Protocols for safe handling at these sites are already in place, and they also exist for hydrogen refuelling infrastructure in site-specific forms. However, they remain complex and unfamiliar compared to those for other energy carriers. Widespread use in the energy system would bring new challenges. They would need further development and any public concerns would need to be alleviated.
The health and safety considerations of most hydrogen-based fuels and feedstocks are familiar to the energy sector. The exceptions are ammonia and liquid organic hydrogen carriers (LOHCs, discussed in Chapter 3), which have only recently been seriously considered for potential use in the energy system. Ammonia generally raises more health and safety considerations than hydrogen, and its use would probably need to continue to be restricted to professionally trained operators. It is highly toxic, flammable, corrosive, and escapes from leaks in gaseous form. However, unlike hydrogen, it has a pungent smell, making leaks easier to detect. It is also a
PAGE | 35
IEA. All rights reserved.
The Future of Hydrogen |
Chapter 1: Introduction |
precursor to air pollution. Like hydrogen, there is long experience of using ammonia industrially. It has been used as a refrigerant since the early 19th century and it has also been used in largescale fertiliser production for over a century. Ammonia is routinely stored and transported, including in ocean-going tankers, and is sometimes injected directly into the soil in agriculture. Methylcyclohexane, a potential candidate LOHC, is flammable and dangerous to ingest, and its production requires toluene (which is toxic), but as a liquid, methylcyclohexane is less hazardous compared with gases, which can be inhaled. Dibenzyltoluene is considered to be an alternative LOHC option and is safer. Neither are currently handled in very large quantities, except in specific chemical facilities, but safe handling in pipelines or ships is not thought to pose a significant safety problem with appropriate controls in place.
References
AFC TCP (Advanced Fuel Cells Technology Collaboration Partnership) (2018), AFC TCP 2018 Survey on the Number of Fuel Cell Electric Vehicles, Hydrogen Refuelling Stations and Targets, provided to the IEA by AFC TCP.
Chehade, Z. et al. (2019), “Review and analysis of demonstration projects on Power-to-X pathways in the world”, International Journal of Hydrogen Energy, in press.
GCCSI (Global CCS Institute) (2019), The Global Carbon Capture and Storage Intelligence Database, https://co2re.co/ (accessed 9 April 2019).
IEA (International Energy Agency) (2019), World Energy Investment 2019, Paris, www.iea.org/wei2019/. IEA (2018a), RD&D Statistics, Paris, www.iea.org/statistics/RDDonlinedataservice/ (accessed 5 April 2019). IEA (2018b), World Energy Investment 2018, Paris, www.iea.org/wei2018/.
IEA ( (2018c), World Energy Outlook 2018, Paris, www.iea.org/weo2018/. IEA (2015), Technology Roadmap Hydrogen and Fuel Cells, Paris.
IPCC (Intergovernmental Panel on Climate Change) (2018), “Global Warming of 1.5°C: An IPCC Special Report on the impacts of global warming of 1.5°C above pre-industrial levels and related global greenhouse gas emission pathways, in the context of strengthening the global response to the threat of climate change, sustainable development, and efforts to eradicate poverty”, World Meteorological Organization, Geneva, Switzerland.
IPHE (International Partnership for Hydrogen and Fuel Cells in the Economy) (2019), Country Updates, www.iphe.net/ (accessed 8 April 2019).
Ridjan (2016), “Terminology used for renewable liquid and gaseous fuels based on the conversion of electricity: a review”, Journal of Cleaner Production, Vol. 112, pp. 3709–20,
doi: 10.1016/j.jclepro.2015.05.117.
Society of Automotive Engineers of China (2016), Hydrogen Fuel Cell Vehicle Technology Roadmap [English Version], Strategy Advisory Committee of the Technology Roadmap for Energy Saving and New Energy Vehicles, www.ihfca.org.cn/file/FCV%20Tech%20Roadmap.pdf.
Stephens-Romero, S. et al. (2009), “Determining air quality and greenhouse gas impacts of hydrogen infrastructure and fuel cell vehicles”, Environmental Science and Technology, Vol. 43, Issue 23, pp. 9022–9, https://doi.org/10.1021/es901515y.
World Energy Council (2018), Hydrogen an Enabler of the Grand Transition, Future Energy Leaders Hydrogen Taskforce, World Energy Council.
PAGE | 36
IEA. All rights reserved.

The Future of Hydrogen |
Chapter 2: Producing hydrogen and hydrogen-based products |
Chapter 2: Producing hydrogen and hydrogen-based products
•Around 70 Mt of dedicated hydrogen are produced today, 76% from natural gas and
almost all the rest (23%) from coal. Annual hydrogen production consumes around 205 billion m3 of natural gas (6% of global natural gas use) and 107 Mt of coal (2% of global coal use), with coal use concentrated in the People’s Republic of China (“China”). As a
consequence, global hydrogen production today is responsible for 830 MtCO2/yr – corresponding to the annual CO2 emissions of Indonesia and the United Kingdom combined.
•Electrolysis currently accounts for 2% of global hydrogen production, but there is significant scope for electrolysis to provide more low-carbon hydrogen. Surplus electricity from variable renewables has low costs, but the number of hours during which this surplus occurs is generally low. Falling costs mean that dedicated renewables for hydrogen production in regions with excellent resource conditions could, however, now become a reliable low-cost hydrogen source. If all current dedicated hydrogen production were produced through water electrolysis (using water and electricity to create hydrogen), this would result in an annual
electricity demand of 3 600 TWh – more than the annual electricity generation of the European Union. Water requirements would be 617 million m3, or 1.3% of the water consumption of the global energy sector today; this is roughly twice the current water consumption for hydrogen from natural gas.
•There are huge regional variations in hydrogen production costs today, and their future economics depend on factors that will continue to vary regionally, including prices for fossil fuels, electricity and carbon. Natural gas without CCUS is currently the most economic option for hydrogen production in most parts of the world, with costs being as low as
USD 1/kgH2 in the Middle East. Among low-carbon options, electrolysis requires electricity prices of USD 10–40/MWh and full load hours of 3 000–6 000 to become cost-competitive with natural gas with CCUS (depending on local gas prices). Regions with good renewable resources or nuclear power plants may find electrolysis an attractive option, especially if they currently depend on relatively high cost natural gas imports.
•Conversion of hydrogen into other hydrogen-based fuels could be attractive where few other low-carbon alternatives are available, but is not economic at current prices. The conversion of hydrogen to ammonia benefits from existing infrastructure and demand; it also does not need carbon as an input. For synthetic liquid fuels from electrolytic hydrogen, however, electricity costs of USD 20/MWh translate into costs of USD 60–70/bbl without
taking account of any capital expenditure or CO2 feedstock costs. For synthetic methane the equivalent figure is USD 10–12/MBtu. Carbon pricing or equivalent policies would be needed to reduce the cost gap between synthetic hydrocarbons and fossil fuels.
PAGE | 37
IEA. All rights reserved.

The Future of Hydrogen |
Chapter 2: Producing hydrogen and hydrogen-based products |
Hydrogen can be produced using a range of energy sources and technologies. Global hydrogen production today is dominated by the use of fossil fuels. Electrolytic hydrogen – that is, hydrogen produced from water and electricity – plays only a minor role (although it was a major source of industrial hydrogen in the 1920s to 1960s, using electricity generated from hydropower, before being displaced by natural gas). With declining costs for renewable power (in particular solar PV and wind), interest is now growing in water electrolysis for hydrogen production and in the scope for further conversion of that hydrogen into hydrogen-based fuels or feedstocks, such as synthetic hydrocarbons and ammonia, which are more compatible than hydrogen with existing infrastructure.
This chapter explores the various ways of making hydrogen and hydrogen products. It begins with an analysis of the existing sources and methods of production of hydrogen. It then considers key sources of hydrogen production, looking in turn at natural gas, water and electricity, coal, and biomass in terms of both technology options and costs. The chapter then provides an overview of the scope for converting hydrogen into fuels and feedstocks that are easier than hydrogen to store, transport and use.
Production of hydrogen today
Hydrogen can be extracted from fossil fuels and biomass, or from water, or from a mix of both (Figure 7). Around 275 Mtoe of energy are used for the production of hydrogen today (2% of global total primary energy demand). Natural gas is currently the primary source of hydrogen production, and steam methane reformers using natural gas are the workhorse of dedicated hydrogen production in the ammonia and methanol industries and in refineries. Natural gas accounts for around three-quarters of the annual global dedicated hydrogen production of around 70 million tonnes of hydrogen (MtH2), using around 205 billion cubic metres (bcm) of natural gas (6% of global natural gas use). Coal comes next, due to its dominant role in China: it accounts for an estimated 23% of global dedicated hydrogen production and uses 107 Mt of coal (2% of global coal use). Oil and electricity account for the remainder of the dedicated production.
The dependence on natural gas and coal means that hydrogen production today generates significant CO2 emissions: 10 tonnes of carbon dioxide per tonne of hydrogen (tCO2/tH2) from natural gas,6 12 tCO2/tH2 from oil products, and 19 tCO2/tH2 from coal. This results in total CO2 formation of about 830 MtCO2/yr, corresponding to the combined CO2 emissions of Indonesia and the United Kingdom. Most of this CO2 is emitted to the atmosphere, although in ammonia/urea plants the concentrated CO2 streams from steam methane reforming (SMR) (around 130 MtCO2 each year) are captured and used in the production of urea fertiliser.7
Reforming is the most widespread method for producing hydrogen from natural gas. There are three methods: steam reforming (using water as an oxidant and a source of hydrogen), partial oxidation (using oxygen in the air as the oxidant), or a combination of both called autothermal reforming (ATR).8 Steam reforming is used to extract hydrogen from natural gas and – much
6Fugitive emissions during natural gas production, processing and transport are important to consider when comparing different hydrogen production routes as they represent a significant share of the CO2 mitigation potential (Tlili et al., 2019).
7The carbon contained in the urea fertiliser is, however, released again as CO2 when the fertiliser is applied by farmers to the soil.
8Steam reforming requires heat (“endothermic”), while partial oxidation releases heat (“exothermic”). ATR uses both air and water as oxidants, so it does not require or release heat.
PAGE | 38
IEA. All rights reserved.

The Future of Hydrogen |
Chapter 2: Producing hydrogen and hydrogen-based products |
less frequently – from liquefied petroleum gas and naphtha. Partial oxidation is used to extract hydrogen from heavy fuel oil and coal. In all cases, a synthesis gas mostly made of carbon monoxide and hydrogen is formed, then converted to hydrogen and CO2 if pure hydrogen is the main product. Other processes include gasification (where the raw material, such as coal or biomass, is converted into a synthesis gas that is then transformed into hydrogen and CO2) and electrolysis (where hydrogen is produced by splitting water into hydrogen and oxygen). Though known for a long time, electrolysis plays only a minor role in total hydrogen production today, mostly in the chlor-alkali industry where hydrogen is a by-product.
Figure 7. Potential pathways for producing hydrogen and hydrogen-based products
Notes: N2 = nitrogen. The dotted lines represent the flow of hydrogen-containing synthesis gas (mixture of hydrogen and carbon monoxide) from hydrocarbon fuels for further conversion into other synthetic hydrocarbons, such as coal-to-liquids or gas-to-liquids. Though not discussed in this chapter, this direct conversion route of hydrocarbons via synthesis gas into other synthetic hydrocarbons is likely more favourable in terms of emissions (especially when coupled with CCUS) or costs compared with producing pure hydrogen from hydrocarbons first and then combining this hydrogen again with CO2 for the production of synthetic hydrocarbons, particularly if the CO2 input is of fossil origin.
Source: IEA 2019. All rights reserved.
Various options exist to produce hydrogen, with SMR, coal gasification and water electrolysis being the prevalent ones today.
Hydrogen from natural gas
SMR is the most widespread technology for hydrogen production from natural gas at large scale, though ATR is also in use. Natural gas in SMR is both a fuel and a feedstock (together with water). Typically 30–40% of it is combusted to fuel the process, giving rise to a “diluted” CO2 stream, while the rest of it is split by the process into hydrogen and more concentrated “process” CO2. SMR is likely to remain the dominant technology for large-scale hydrogen production in the near term because of its favourable economics and the large number of SMR units in operation today.
Technology options for low-carbon hydrogen
CCUS can be applied both to SMR and ATR hydrogen production. Using CCUS with SMR plants can lead to a reduction in carbon emissions of up to 90%, if applied to both process and energy emission streams. Several SMR-CCUS plants are already operational today, producing around
PAGE | 39
IEA. All rights reserved.
The Future of Hydrogen |
Chapter 2: Producing hydrogen and hydrogen-based products |
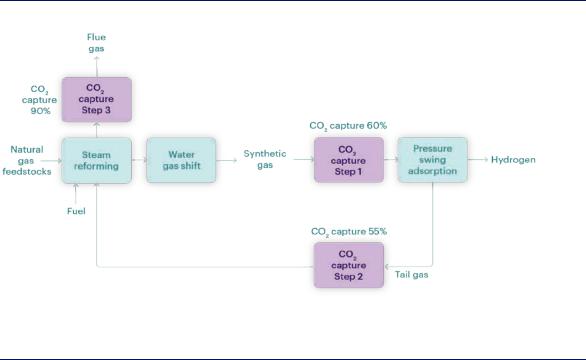
0.5 MtH2/yr between them. There are several ways in which CO2 capture can take place at an SMR plant. CO2 can be separated from the high-pressure synthesis gas stream, reducing emissions by up to 60% (Figure 8). This typically costs around USD 53 per tonne of carbon dioxide (tCO2) for merchant plants (that is, plants where hydrogen production is not integrated with the production of ammonia or methanol), based on current natural gas prices in Europe. CO2 can also be captured from the more diluted furnace flue gas. This can boost the level of overall emission reduction to 90% or more, but it also increases costs to around USD 80/tCO2 in merchant plants, and to USD 90–115/tCO2 in integrated ammonia/urea and methanol plants, which have more diluted CO2 streams (see IEAGHG, 2017a and 2017b).
Figure 8. Production process of hydrogen from gas with CCUS
Source: IEAGHG (2017a), “Reference data and supporting literature reviews for SMR based hydrogen production with CCS”.
CCUS is crucial to decarbonising the large SMR fleet in operation today.
ATR is an alternative technology in which the required heat is produced in the reformer itself. This means that all the CO2 is produced inside the reactor, which allows for higher CO2 recovery rates than can be achieved with SMR. ATR also allows for the capture of emissions at lower cost than SMR because the emissions are more concentrated. A number of studies have shown that the costs of SMR with capture rates exceeding 90% are higher than that of a comparable ATR system (H21, 2018). A large share of global ammonia and methanol production already combines SMR with ATR technology, and the announced HyNet and H21 projects in the United Kingdom have plans to use ATR with CCUS instead of SMR. Other options for using natural gas to produce hydrogen exist, but are still only at either demonstration or laboratory scale today (Box 3).
PAGE | 40
IEA. All rights reserved.