

01 POWER ISLAND / 02 H2+NH3 / The_Future_of_Hydrogen-IEA-2020
.pdfThe Future of Hydrogen |
Chapter 5: Opportunities for hydrogen in transport, buildings and power |
brand. The choice of what vehicle to buy, in other words, is not by any means just a matter of costs or price, or a comparative calculation of the total cost of owning and operating a vehicle. Both BEVs and FCEVs have some shared characteristics (such as zero tailpipe emissions, fast acceleration from a standing start and quiet operation) that may appeal to consumers while advancing a wider transition towards the use of low-carbon fuels in transport. They also have some different performance attributes that are likely to appeal to distinct consumer groups.
Leaving aside the cost of hydrogen fuel, which is discussed in Chapters 2 and 3, the cost competitiveness of direct hydrogen use in FCEVs depends on how three critical cost components develop compared with their present and potential future competitors: the cost of the fuel cell stack; the cost of on-board storage; and the cost of refuelling.
Fuel cell costs and potential for cost reduction
The fuel cell has seen considerable cost reductions over the past decade (Yumiya, 2015), but costs remain high and production volumes are still low. The current commercial cost of a typical fuel cell is estimated to be USD 230/kW, although the use of state-of-the-art technologies is soon likely to bring this cost down to USD 180/kW (Papageorgopoulos, 2017).
Costs could be further reduced in the future through research-driven advances in technology. It may be possible to increase catalyst activity and thus reduce the platinum content, which is one of the expensive components of the fuel cell. It may also be possible to develop a platinum-free catalyst. Research is also needed to optimise the design and integration of fuel cell components in the membrane electrode assembly and to decrease the costs of the bipolar plates (which are expected to account for an increasing share of the future costs) and balance of plant components (e.g. compressors and humidifiers).
Costs could also be reduced in the future through economies of scale: increasing the number of units fabricated in a single manufacturing plant reduces the specific cost of each component. About half of the system cost is in the bipolar plates, membranes, catalyst and gas diffusion layers. The combined cost of these components could be reduced by 65% by increasing plant scale from 1 000 to 100 000 units per year, bringing system costs down to USD 50/kW. Increasing the scale further to 500 000 units per year would be likely to decrease the cost by only an additional 10%, taking it down to USD 45/kW (Wilson, Kleen and Papageorgopoulos, 2017). These cost reduction estimates must, however, be balanced against the challenge of simultaneously improving fuel cell performance and durability. Higher durability requirements could translate into higher fuel cell cost and limit the cost reductions achieved through economies of scale. Recent US Department of Energy (DOE) data take into account these trade-offs and provide a preliminary durability-adjusted cost target of USD 75/kW (US DOE, 2019) . However, automakers are working to increase durability, such as via constructing fuel cell operation maps to mitigate performance degradation.
Economies of scale in manufacturing could be achieved quickly. Global truck sales stood at around 1.6 million medium-duty and 1.8 million heavy-duty vehicles in 2017. A medium-duty truck requires about twice as much power as a car, and a heavy-duty truck needs about four times as much. These requirements could, however, be met by installing fuel cell stacks next to each other; the most cost-effective way of proceeding might be to equip a medium-duty fuel cell electric truck with two fuel cell stacks, and a heavy-duty truck with four. To reach a 5% global market share in trucks would require five fuel cell system plants producing 100 000 units (stacks) a year. China would need 10 plants producing 100 000 units annually to satisfy just a quarter of its current annual sales for domestic mediumand heavy-duty trucks. The passenger vehicle sector has a market size much larger than trucks, with annual new car sales of around
PAGE | 131
IEA. All rights reserved.

The Future of Hydrogen |
Chapter 5: Opportunities for hydrogen in transport, buildings and power |
85 million and light commercial truck sales of 10 million in 2017. These light-duty vehicles require a system consisting of a single fuel cell stack, with a peak power of 80–100 kW per vehicle. Achieving a market share of 5% of the global car market would require 40 fuel cell manufacturing plants, each with an average output of 100 000 units a year.
Storage tank costs and potential for cost reduction
On-board storage tank costs are determined by expensive composite materials and are expected to fall at a slower pace than fuel cells. On-board storage of hydrogen requires it to be compressed at 350–700 bar for cars and trucks, and this uses the equivalent of 6–15% of the hydrogen energy content.45 The costs of current on-board storage systems (including fittings, valves and regulators) are estimated at USD 23/kWh of useable hydrogen storage at a scale of 10 000 units per year, decreasing to USD 14–18/kWh at a scale of 500 000 units per year (Vijayagopal, Kim and Rousseau, 2017). The US DOE has an ultimate target of USD 8/kWh. For a car with a range of 600 km, this implies costs of around USD 3 400 today and USD 1 800 in the long term for a tank of 225 kWh. For a heavy-duty truck with a range of 700 km, it implies costs of USD 27 700 today and a potential reduction to USD 16 700 for a tank of 1 800 kWh, compared with USD 100 000 – 150 000 for the full cost of a conventional diesel truck tractor.
Refuelling infrastructure costs and potential for cost reduction
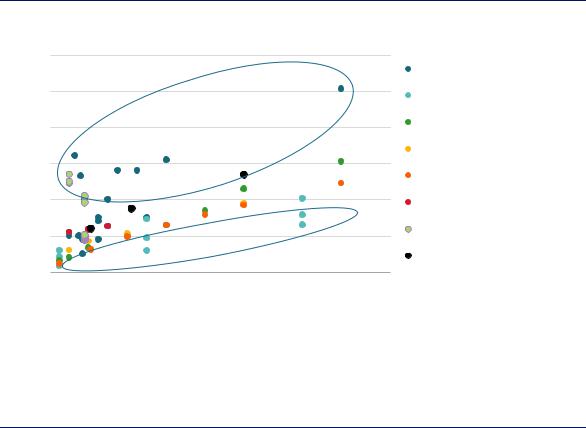
The roll-out of hydrogen refuelling infrastructure is a key requirement for FCEVs. Hydrogen refuelling takes almost as little time as refuelling conventional liquid transport fuels. Supplying refuelling stations with hydrogen, however, may require more time and labour than is the case for conventional transport fuels. Validation of cost estimates is difficult because there are fewer than 400 hydrogen refuelling stations around the world and because their data are usually not disclosed. However, investment costs for hydrogen refuelling stations are estimated to be in the range of USD 0.6–2 million for hydrogen at a pressure of 700 bar, and USD 0.15–1.6 million at 350 bar (Figure 53). The lower end of these ranges is for stations with a capacity of 50 kgH2/day while the upper is for 1 300 kgH2/day.46
The two largest cost components are the compressor (which can be up to 60% of the total cost when the delivery pressure is 700 bar) to achieve the delivery pressure, and the storage tanks (which are relatively large due to lower hydrogen density). The actual cost of building a station varies considerably across countries, mainly as a result of different safety and permitting requirements. There are strong economies of scale. Increasing the capacity from 50 to 500 kgH2/day would be likely to reduce the specific cost (i.e. the capital cost per kg of hydrogen dispensed) by 75%. Larger capacity stations of up to a few 1 000 kgH2/day are being planned, especially for heavy-duty applications, and these offer potential for further economies of scale. There is also potential for costs to be reduced through a shift to more advanced supply options (such as very high pressure or liquid hydrogen) and through scale-up in the manufacturing of refuelling station products (via mass production of components, such as the compressors).
45Even at 700 bar it is important to note that hydrogen storage needs seven times more space to achieve the same range as conventional diesel technology.
46The total cost of the engineering, construction and general overheads for hydrogen refuelling stations with the capacity to deliver
130kg to 350 kg per day of hydrogen falls in a higher range (USD 2.4–USD 3.2 million) (Baronas et al., 2017)
PAGE | 132
IEA. All rights reserved.
The Future of Hydrogen |
Chapter 5: Opportunities for hydrogen in transport, buildings and power |
Figure 53. Benchmarking hydrogen refuelling station capital costs as a function of capacity
USD/station) |
6 |
|
|
|
|
|
|
|
|
|
|
|
|
|
|
Campíñez-Romero et al. 2018 |
|
|
|
|
|
|
|
|
|
|
|
5 |
|
|
|
|
|
|
IEA 2005 |
|
|
|
|
|
|
|
|
|
(million |
4 |
|
Limited learning and design optimisation |
|
HRSAM DoE |
|||
|
|
|
|
|
|
|||
|
|
|
|
|
|
H2 TCP - Task 28 |
||
|
|
|
|
|
|
|
||
|
|
|
|
|
|
|
|
(Compressor and dispenser) |
costs |
3 |
|
|
|
|
|
|
Industry data |
|
|
|
|
|
|
|
||
Capital |
|
|
|
|
|
|
|
|
2 |
|
|
|
|
|
|
NREL 2015 |
|
|
|
|
|
|
|
|
||
|
1 |
|
|
Lower pressure (35 MPa) |
|
|
NREL 2017 (California) |
|
|
|
|
|
|
|
|||
|
|
|
|
|
|
|
|
Robinius 2018 |
|
0 |
|
|
|
|
|
|
|
|
0 |
250 |
500 |
750 |
1 000 |
1 250 |
1 500 |
1 750 |
|
|
|
|
Capacity (kg/day) |
|
|
|
|
Sources: Campíñez-Romero et al. (2018), “A hydrogen refuelling stations infrastructure deployment for cities supported on fuel cell taxi roll-out”; IEA (2005), Prospects for Hydrogen and Fuel Cells; Pratt et al. (2015), H2FIRST Reference Station Design Task; US DOE (2018) HRSAM DoE; industry data, Robinius et al. (2018), “Comparative analysis of infrastructures: Hydrogen fueling and electricity charging of vehicles”.
The costs of providing hydrogen to FCEVs can be brought down by building larger refuelling stations as long as expected hydrogen demand allows.
Risks related to the tension between refuelling station size, the cost of hydrogen and hydrogen demand are among the barriers to rapid hydrogen uptake for transport. Small stations make more economic sense in the initial deployment phase as they are more likely to secure higher capacity utilisation rates when demand for hydrogen from transport vehicles is limited, but they come at higher cost per unit of hydrogen delivered. Once sufficient demand volumes have been established, larger stations become more economic and can help reduce the cost of hydrogen for the end users. The cost of delivered hydrogen will also depend on whether the hydrogen is produced locally or delivered from centralised production facilities. The cost advantages of centralised production may be outweighed by the cost of distribution to the refuelling station by truck or pipeline (Chapter 3). The cheapest option will be determined case by case.
Despite higher initial costs than BEV charging infrastructure, hydrogen refuelling stations can offer significant advantages when deployed at scale, such as faster refuelling and space requirements around 15 times lower, as well as potentially lower final investment costs (FCH2 JU, 2019). In the longer term over 400 refuelling stations would be needed to service a fleet of 1 million hydrogen FCEVs if the ratio of refuelling stations to cars were similar to that for today’s oil-powered car fleet (FuelsEurope, 2018; ACEA, 2018; Robinius et al. 2018). This compares to almost 1 million private charging stations and at least 10 000 fast-charging public stations that would be needed for a fleet of 1 million BEVs.
To meet the needs of a growing FCEV fleet, policy makers will need to ensure investment flows at the right times. Most fuelling stations serving non-captive fleets in the early stages of FCEV deployment will be small (< 200 kgH2/day), and the total investment needed to build these
PAGE | 133
IEA. All rights reserved.

The Future of Hydrogen |
Chapter 5: Opportunities for hydrogen in transport, buildings and power |
400 stations is likely to be on the order of USD 0.5–0.6 billion. This would rapidly increase, however, and for a mature market with larger stations (> 1 000 kg/d) an investment of USD 35– 45 billion47 would be required to serve just 5% of the global car fleet (around 60 million vehicles). As well as collaborating with industrial stakeholders on roadmaps for building refuelling stations in the initial phases, before their revenue can sustain investment in expansion, policy makers could incentivise owners of captive fleet stations to open them for public use, thus allowing general users to access more stations (Box 13).
Box 13. Policy opportunities for promoting the use of hydrogen in road transport
Policy options to promote the uptake of FCEVs include fuel economy standards, zero-emission vehicle (ZEV) mandates, feebates (which tax the worst performing vehicles to subsidise those that perform best in terms of CO2 or air pollutant emissions) and purchase subsidies. The first two put the onus on private industry to provide technological solutions to climate and air quality externalities and give them the freedom to find the solutions that work best for them. Fuel economy standards and feebates can be technology-neutral, while ZEV mandates are more specific and could help to secure the demand that hydrogen refuelling stations need to bring down the costs of delivering hydrogen during an initial deployment phase.
Focusing initially on building refuelling infrastructure for captive fleets would provide a way to address the barrier of underutilisation. Examples of captive fleets include truck and handling vehicles at industrial sites and clusters and at ports; buses; and taxi fleets. Refuelling stations originally built for captive fleets could be opened for public use, thereby offering refuelling points to early adopters of FCEVs at a low marginal cost. An alternative approach would be to give credits to refuelling stations (under fuel standards) based on the gap between actual and targeted utilisation rates, as in California where a range of policy instruments combine to support private investment in refuelling infrastructure (CEC and CARB, 2018).
Public policy can also play a supportive role in the initial stages by:
Easing regulatory burdens associated with the transport of hydrogen (e.g. in vehicles on bridges and tunnels) and with the permitting and construction of necessary infrastructure.
Engaging with industry stakeholders that are able to make the required investments, brokering commitments among industry partners to support credible and well-structured business plans, and offering a critical assessment (e.g. based on audits) of areas for improvement of such plans at regular intervals.
Temporarily repurposing funds from vehicle or fuel taxes to decrease the investment risk of nascent hydrogen refuelling station networks.
Source: CEC and CARB (2018).
47 Assuming 20% of stations would be small scale (200 kg/day) and 80% would be large scale (1000 kg/day) as the market developed.
PAGE | 134
IEA. All rights reserved.
The Future of Hydrogen |
Chapter 5: Opportunities for hydrogen in transport, buildings and power |
Total cost of ownership of cars
Energy consumption per kilometre tends to be greatest on large vehicles used over long distances. This means that fuel costs generally make up a greater share of total costs for heavier vehicles, and for vehicles with high utilisation (such as long-haul trucks, intercity buses and commercial car fleets). As the capital cost of a car ranges from 70% to 95% of the total cost of ownership, depending on the vehicle, it will be imperative to bring down the cost of fuel cell systems and hydrogen storage tanks to achieve cost competitiveness with other options. The case is somewhat different for trucks, for which the capital cost ranges from 40% to 70% of the total ownership cost, meaning that cost reductions for delivered hydrogen are just as important (see section on mediumand heavy-duty vehicles below).
Car buyers typically consider the total cost of ownership as one among several decision criteria. For example, the range of a car can be important to some buyers. The global average BEV sold today has a range of around 250 km; this is sufficient for most daily trips. FCEVs sold today offer a longer range: the Toyota Mirai offers some 400 km and the Hyundai Nexo even more. This makes them attractive for consumers who prioritise range.48 To illustrate the relevance, assuming hydrogen refuelling facilities are located along desired routes, FCEVs could drive from Paris to Marseille (about 750 km) with a single short refuelling stop. The same trip in a BEV with a range of 250 km would require stopping to charge at least twice, with fast charging depending on the availability of stations. This extra range offered by FCEVs, however, comes at a price in terms of the cost of the vehicle. Different consumers will weigh the considerations differently, according to their individual priorities and preferences.
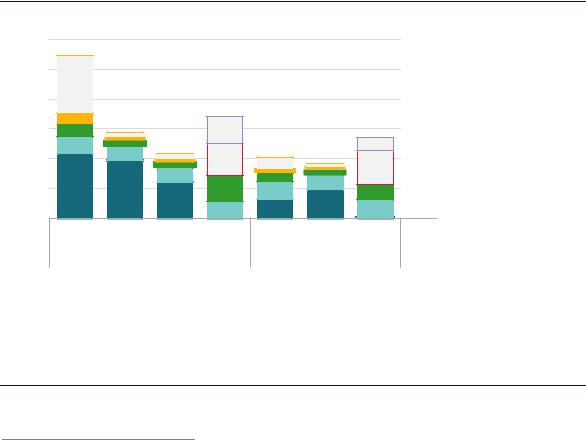
Figure 54. Total cost of car ownership by powertrain, range and fuel
(USD/km) |
0.9 |
0.8 |
|
|
|
ownership |
0.7 |
0.6 |
|
cost of |
0.5 |
Total |
0.4 |
|
|
|
0.3 |
FCEV |
BEV |
BEV |
ICE Hybrid FCEV |
BEV ICE Hybrid |
400 km |
400 km |
250 km |
400 km |
400 km |
|
Today |
|
Long term |
|

 Synthetic fuel (air capture)

 Synthetic fuel (best case)

 Low utilisation of infrastructure

 Refuelling, charging infrastructure

 Electricity, fuel

 Operations and maintenance

 Battery, fuel cell
Base vehicle cost
Notes: ICE = internal combustion engine. The y-axis intercept of the figure corresponds to base vehicle “glider” plus minor component costs, which are mostly invariant across powertrains. More information on the assumptions is available at www.iea.org/hydrogen2019.
Source: IEA 2019. All rights reserved.
FCEV costs could break even with BEV costs at a range of 400 km. Cost reductions in fuel cells and storage tanks, together with high utilisation of stations, are the keys to achieving competitiveness.
48 Real-world driving ranges of BEVs are also more sensitive to temperature and use of auxiliary systems (e.g. air conditioning) than other powertrains.
PAGE | 135
IEA. All rights reserved.
The Future of Hydrogen |
Chapter 5: Opportunities for hydrogen in transport, buildings and power |
Currently hydrogen fuel cell cars are generally more expensive than battery electric cars, owing to the high cost of the fuel cell and fuel tanks and to the fact that they are generally designed to have a longer range (Figure 54). The competitiveness improves if one assumes the same range for FCEVs and BEVs, although such range would be only possible today for a limited number of BEV models. If cost reductions through economies of scale were to bring down fuel cell costs to USD 50/kW and those of batteries fall to USD 100/kWh, then FCEVs become competitive with BEVs at a range of 400 km. If fuel cell costs were only to fall to USD 75/kW, for example because of the need for durability requirements as discussed earlier in this chapter, then FCEVs would become competitive with BEVs at a range of 500 km (Figure 55). This underscores the fact that FCEVs can be economically attractive for consumers who prioritise driving range.
Utilisation of refuelling infrastructure is another determinant of the future competitiveness of FCEVs. In the initial roll-out phase, the cost of hydrogen fuel can be expected to range from 12% (at USD 9/kgH2) to 22% (at USD 18/kgH2) of the total cost of ownership. As discussed above, the additional cost accounted for by the hydrogen refuelling station depends on size and utilisation: stations with a capacity of 200 kgH2 per day that dispense fuel at 10–33% of capacity add a margin of USD 4–13/kgH2, and that margin declines with station size and higher capacity utilisation. The risk of underutilised hydrogen refuelling stations highlights the importance of securing high utilisation to bring down costs in the initial stages of FCEV deployment, even in cars, the mode where fuel costs are least determinant.
It is worth noting that in California it took around two years to increase the average utilisation of the network from 5% to 40%; the average station size is now around 200 kgH2/d (CEC and CARB, 2018) and some stations are still operating at below 10% utilisation (NREL, 2019). The high cost of synthetic fuel, however, suggests that transitioning to alternative powertrains – whether battery or fuel cell electric – is likely to be a lower-cost strategy for reducing CO2 and local pollutant emissions from cars and trucks, also considering the significant energy consumption and need for biogenic CO2 this route would require.
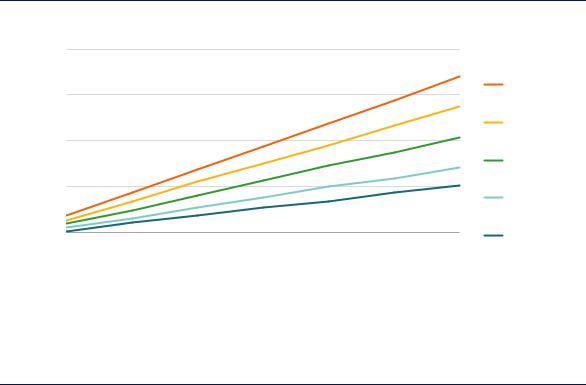
Figure 55. Break-even fuel cell cost to be competitive with BEV in the long term
(USD/kW) |
200 |
|
|
Battery price |
|
|
|
||
|
|
|
|
|
cell cost |
150 |
|
|
USD 150/kWh |
|
|
|
||
|
|
|
USD 125/kWh |
|
fuel |
100 |
|
|
|
-even |
|
|
|
USD 100/kWh |
Break |
50 |
|
|
USD 75/kWh |
|
|
|
||
|
|
|
|
|
|
0 |
|
|
USD 60/kWh |
|
100 |
300 |
500 |
700 |
Vehicle range (km)
Note: More information on the assumptions is available at www.iea.org/hydrogen2019.
Source: IEA 2019. All rights reserved.
Fuel cell electric cars are most competitive on a total cost of ownership basis with BEV cars over longer driving ranges. To break even with battery costs below USD 100/kWh could require achieving fuel cell costs below USD 60/kW.
PAGE | 136
IEA. All rights reserved.
The Future of Hydrogen |
Chapter 5: Opportunities for hydrogen in transport, buildings and power |
The above analysis suggests that BEVs and FCEVs could complement each other as alternative options satisfying different consumers, with FCEVs offering the best opportunities for vehicles driven at long ranges, with fast refuelling requirements and in regions with access to cheap hydrogen. Furthermore, it suggests that once a hydrogen refuelling infrastructure has been built out, light-duty FCEVs with different configurations (e.g. fuel cell range extenders) could take advantage of cost and performance improvements in both fuel cells and batteries.
Total cost of ownership of mediumand heavy-duty vehicles
The heavy-duty long-haul segment, including trucks and intercity buses (or “coaches”), offers strong prospects for hydrogen FCEVs because it calls for long range and high power requirements. As a result, heavy-duty FCEVs tend to be more immediately competitive against BEVs than in the case of cars. The direct electrification of regional bus operations and heavyduty trucking for long-distance freight both face major challenges with larger battery capacity, long charging times and high power requirements that translate into payload loss and additional recharging infrastructure costs. Fuel cellelectric trucks overcome some of these challenges.
In the case of heavy-duty long-haul trucks, fuel cell costs are higher than light-duty vehicle applications, mainly as a result of high durability requirements. This currently necessitates increased catalyst loading, translating into higher costs. Future fuel cell system costs for heavyduty trucks are estimated at USD 95/kW (for a production volume of 100 000 units per year) (US DOE, 2019). Even with current fuel cell costs, FCEVs could in general be competitive against BEVs in heavy-duty applications at ranges of more than 600 km if hydrogen could be delivered at less than USD 7/kgH2, although the exact hydrogen price at which they become competitive depends on overall annual mileage and other operational characteristics.
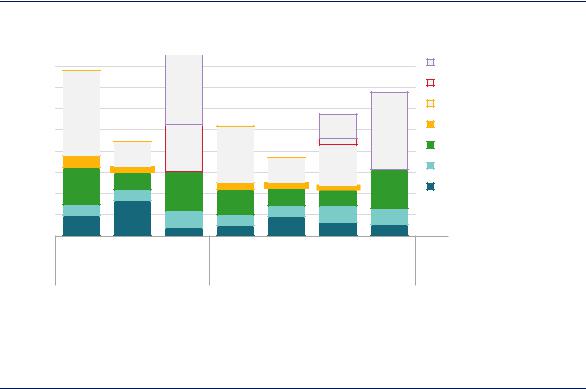
Figure 56.
(USD/km) |
1.8 |
|
|
||
|
1.6 |
|
ownership |
1.4 |
|
1.2 |
||
|
||
of |
1.0 |
|
|
||
cost |
0.8 |
|
Total |
0.6 |
|
|
0.4
0.2
Current and future total cost of ownership of fuel/powertrain alternatives in long-haul trucks
|
|
|
|
|
|
Synthetic fuel (air capture) |
|
|
|
|
|
|
Synthetic fuel (best case) |
|
|
|
|
|
|
Low utilisation of infrastructure |
|
|
|
|
|
|
Refuelling, charging |
|
|
|
|
|
|
Electricity, fuel |
|
|
|
|
|
|
Operations and maintenance |
|
|
|
|
|
|
Battery, fuel cell |
|
|
|
|
|
|
Base truck cost |
FCEV |
BEV |
Diesel ICE |
FCEV |
BEV |
Hybrid |
Diesel |
|
|
|
|
|
catenary |
Hybrid |
|
Today |
|
|
Long term |
|
|
Notes: The y-axis intercept of the figure corresponds to base vehicle “glider” plus minor component costs. Infrastructure covers stations, charging points and catenary lines. More information on the assumptions is available at www.iea.org/hydrogen2019.
Source: IEA 2019. All rights reserved.
Fuel costs make up about half of the total cost of ownership for heavy-duty trucks, so the focus for making them competitive should be on bringing down the delivered price of hydrogen.
PAGE | 137
IEA. All rights reserved.

The Future of Hydrogen |
Chapter 5: Opportunities for hydrogen in transport, buildings and power |
Powertrain and fuel options for decarbonising heavy-duty long-haul trucking include FCEVs, battery electric trucks, dynamic charging (catenaries are the most commercially advanced and lowest-cost option on existing roads)49 and conventional diesel hybrids using synthetic fuels (or advanced biofuels). Figure 56 considers diesel hybrids with 25 km of electric range on catenaries. A range of low-carbon powertrain options could conceivably co-exist: plug-in hybrid electric vehicles, BEVs with or without fuel cell range extenders and FCEVs of different configurations could be designed and ordered to cater to different mission profiles.
Bringing down fuel cell costs to USD 95/kW could make hydrogen fuel cell trucks in the heavy-duty segment competitive with diesel hybrid trucks at a hydrogen price of around USD 7/kgH2, compared with the price of USD 5/kg currently needed to make them competitive with an ICE truck running on diesel. For fuel cell electric trucks to be competitive with electric road systems or battery electric trucks at a range of less than 500 km, however, the hydrogen price would need to be less than USD 5/kg H2. Because of the limited size of the truck market, reaching this fuel cell cost target may not be feasible by deployment of fuel cells in trucks alone and will most likely rely on substantial deployment of fuel cells in cars. Fuel cell production for small mobile equipment, such as forklifts, may also help to bring down costs, but since the power requirements of this equipment is typically less than onethird that of a car, high production volumes of roughly 3 000 units per year would be needed to achieve cost reductions below USD 80/kW.
In the case of trucks (and also buses), the cost contribution from the infrastructure could be reduced by the operation of a “hub-and-spoke” model: a dedicated fleet operating on fixed routes could refuel at a single centralised hydrogen refuelling station. Since refineries and industrial clusters are often co-located at ports, port operations (and handling equipment) offer further attractive initial markets. The efficiency of these strategies has been demonstrated by the rapid adoption of hydrogen fuel cell electric buses and trucks in China, where the business case for intensive mediumand heavy-duty operations has been strengthened considerably by success in accessing low-cost hydrogen and achieving high utilisation rates of refuelling stations.
The maritime sector: Ships and ports
The maritime sector is an important consumer of oil products, accounting for around 5% of global oil demand. This section of the report focuses on international shipping, which is the cheapest way to move long-distance freight. By volume around 90% of global physical trade in goods is by sea, of which one-third is energy products, in particular oil products (IMO, 2014). About 80% of fuel use in the maritime sector is in international shipping, of which 90% is used for maritime freight. As a result, international shipping is an important contributor to climate change: it is responsible for around 2.5% of global energy-related CO2 emissions. As it uses heavy fuel oil, it also has large detrimental effects on air quality, notably around ports. Hydrogen, mostly in the form of hydrogen-based fuels, is a leading option for tackling these challenges in international shipping. One advantage of these applications is that they offer the opportunity to address not only emissions during sea transport, but also those arising from port operations, making use of synergies with forklifts, trucks and goods movement in
49 Catenary lines could provide energy to a diverse range of powertrains, including diesel hybrid electric vehicles, FCEVs and BEVs. However, they require the installation of substations and overhead catenary lines as well as retractable pantographs on trucks, increasing the investment risk. It is not clear how these costs would compare with the costs of fuel cell trucks or indeed battery electric trucks. Much like hydrogen, with a high enough utilisation rate of energy provision infrastructure, these costs can be offset by the cost and operational benefits of smaller batteries.
PAGE | 138
IEA. All rights reserved.
The Future of Hydrogen |
Chapter 5: Opportunities for hydrogen in transport, buildings and power |
and around ports (see Chapter 6). Opportunities also exist to use hydrogen and fuel cells for shorter routes within national jurisdictions, especially those operated by ferries.
How is hydrogen used in the maritime sector today?
Oil products currently dominate the shipping sector, and the use of hydrogen-based fuels in shipping is accordingly very limited. There is, however, one project in Belgium for co-firing hydrogen with diesel in maritime internal combustion engines, and more than 20 projects for fuel cells of up to 300 kW, mostly for auxiliary power units (DNV GL, 2017). Projects using fuel cells, often in combination with batteries, are planned in California (GGZEM, 2018), Ireland, Norway (AirClim, 2018) and for some Europe-wide operations.
Ships do not use ammonia as fuel today, but ammonia containing the equivalent of around 3.5 MtH2/yr is traded in ships. Several research and demonstration projects are looking at the firing of ammonia as fuel for ships (Brown, 2018). Satisfactory combustion of ammonia in existing engines would generally require ignition promotors (to overcome its lower ignition energy) and engine modifications.
Potential for hydrogen-based fuels in the maritime sector
The volume of international shipping is expected to more than triple by 2050 under current trends. In the absence of climate change mitigation policies, this could lead to a 50% increase in demand for oil products in the sector, to around 6 mb/d. Action to reduce the emissions associated with this oil use could open a pathway to the use of hydrogen-based fuels. The International Maritime Organization (IMO) has put in place strategies for reducing both sulphur and greenhouse gas emissions.
Possible measures to address the challenge of reducing sulphur emissions are the installation of scrubbers, fuel switching to LNG and the use of very low sulphur fuel oil (VLSFO), although these measures will only make a partial contribution to the 50% greenhouse gas reduction target by 2050 compared to 1990. As described in Chapter 4, limitations on sulphur emissions are likely to stimulate demand for hydrogen at refineries rather than as shipping fuel. To achieve the greenhouse gas emissions target, advanced biofuels, hydrogen and ammonia are all options, as well as hydrogen-based synthetic liquid fuels. The choice of fuel switching relies on infrastructure deployment outside the direct control of ship owners. LNG, hydrogen and ammonia would require the development of bunkering facilities, while both LNG and ammonia could build upon the existing distribution network. Availability and costs of advanced biofuels are uncertain as there is demand competition from other sectors for a limited supply of sustainable biomass.
Targets are also in place in some countries for low-carbon alternatives in domestic shipping. Sweden and Norway are two examples of this, while the European Commission is developing a strategy to set CO2 reduction targets for maritime transport based on monitoring, reporting and verification of CO2 emissions from large ships. Shipping may be incorporated into the European Emission Trading System from 2023.
Among businesses, Maersk, the world’s largest maritime company, announced in 2018 that it aims to become carbon neutral by 2050. To achieve this, it recognises that low-carbon vessels will need to be commercially viable by 2030 (Jacobsen, 2018). Industry leaders have also drafted an action plan to decarbonise the shipping sector, which includes demonstration projects, technology adoption, transparency and knowledge sharing (UNFCCC, 2017).
PAGE | 139
IEA. All rights reserved.
The Future of Hydrogen |
Chapter 5: Opportunities for hydrogen in transport, buildings and power |
Cost competitiveness of hydrogen-based fuels in the maritime sector
Ships have high per-kilometre energy intensity and large power needs (up to 130 MW for the largest container ships), and therefore pose demanding fuel requirements. The main cost components for ships are the same as for road transport: infrastructure (bunkering facilities), on-board equipment (fuel cell/engine and storage) and fuel.
Information on the costs of using liquid hydrogen for international shipping is uncertain. One estimate for the additional cost of bunkering facilities suggests that liquid hydrogen infrastructure could be 30% more expensive than LNG (Taljegard et al., 2014). However, this estimate is likely to omit the upfront costs associated with developing a new infrastructure for hydrogen that does not currently exist. The main cost components are the storage and bunker vessels, which would need to be scaled in parallel with the number of ships serviced. On-site or nearby hydrogen would be needed for small ports given the smaller flows and the high cost of dedicated hydrogen pipelines. Conversely, ship and infrastructure costs are a relatively small component of total shipping costs over a 15-year lifetime, with fuel costs being a much larger factor.
Among hydrogen-based fuels, ammonia is already globally traded and some of the infrastructure that would be needed to use it as a fuel already exists (distribution to ports and storage tanks). However, new bunkering facilities would need to be built; massive scale-up of ammonia production, port and distribution facilities and storage tanks would also be needed. As an indication, satisfying shipping demand in the long term would require 500 Mt of ammonia, almost three times the level of current global production and around thirty times the volume of ammonia currently traded.
A switch to low-carbon fuels seems unlikely to occur in the absence of policy, whether mandates, direct carbon pricing, and/or more flexible and potentially more palatable measures such as low-carbon fuel standards (LCFS) (ITF, 2018). Charterers, who currently oversee more than half of container fleet operations and who hire vessels from ship owners on a lump-sum or per-tonne basis, are likely to operate much shorter payback periods.
Ships serving long-distance maritime trade routes may offer the best potential scope for hydrogen, ammonia and other hydrogen-based fuels. This is because fuel cell system and hydrogen storage costs have a comparatively lower impact when compared to fuel costs (Figure 57). In addition, the space requirements of fuel cells could be an issue, especially for smaller ships (< 2 MW), as they need almost double the space of an ICE (Minnehan and Pratt, 2017; van Biert et al., 2016). Storage of liquid hydrogen requires at least five times more volume than conventional oil-based fuels, and ammonia requires three times more volume. In the longer term this could require the redesign of ships, shorter distance trips and more frequent refuelling, reduced cargo volumes, or a mix of these operational factors, depending on ship and cargo types and routes (UMAS, 2018).
Low-carbon fuels are expensive today compared with fuel oil and LNG (Figure 57). Fuel prices are the key to cost competitiveness; the share of total cost that comes from infrastructure is much lower for ships than for other transport modes, currently accounting for about 3% of the total cost of using hydrogen in shipping on the basis of a hydrogen price of USD 10/kgH2. This would rise to 17% if hydrogen prices were to decrease to USD 2/kgH2, and could be significantly higher (up to 40%) if bunkering facilities were oversized or underutilised. As for road transport, risks of underutilisation of bunkering facilities can be hedged by: rolling out smaller vessels; using smaller storage tanks (which can be expanded as the capacity grows);
PAGE | 140
IEA. All rights reserved.