

01 POWER ISLAND / 02 H2+NH3 / The_Future_of_Hydrogen-IEA-2020
.pdfThe Future of Hydrogen Chapter 4: Present and potential industrial uses of hydrogen
|
|
|
|
Current |
|
|
2030 |
|
|
Long-term |
|
|
Low-carbon hydrogen supply |
|
|||
|
|
|
|
|
|
|
|
|
|
||||||||
|
Sector |
|
|
|
|
hydrogen |
|
|
|
|
|
|
|
|
|
||
|
|
|
hydrogen role |
|
|
|
|
demand |
|
|
|
|
|
|
|
||
|
|
|
|
|
|
|
|
|
Opportunities |
|
|
Challenges |
|
||||
|
|
|
|
|
|
demand |
|
|
|
|
|
|
|
||||
|
|
|
|
|
|
|
|
|
|
|
|
|
|
|
|||
|
|
|
|
|
|
|
|
|
|
|
|
|
|
|
|
|
|
|
|
|
|
7% of primary |
|
|
|
|
|
|
|
|
|
|
|
|
|
|
|
|
|
steel |
|
|
|
|
|
|
|
|
|
|
|
All options |
|
|
|
|
|
production |
|
|
|
|
|
|
|
|
Retrofit DRI |
|
|
|
|
|
|
|
|
|
|
|
|
|
Steel demand |
|
|
|
|
require higher |
|
||
|
|
|
|
takes place via |
|
|
|
|
|
|
|
facilities with |
|
|
|
||
|
|
|
|
|
|
|
|
|
keeps rising, |
|
|
|
|
production costs |
|
||
|
|
|
|
the direct |
|
|
|
|
|
|
|
CCUS. Around |
|
|
|
||
|
|
|
|
|
|
A doubling |
|
|
even after |
|
|
|
|
and/or changes |
|
||
|
|
|
|
reduction of |
|
|
|
|
|
|
30% of natural |
|
|
|
|||
|
|
|
|
|
|
under existing |
|
|
accounting for |
|
|
|
|
to processes. |
|
||
|
|
|
|
iron (DRI) |
|
|
|
|
|
|
gas can be |
|
|
|
|||
|
|
|
|
|
|
policies as the |
|
|
increased |
|
|
|
|
Direct |
|
||
|
|
|
|
route, which |
|
|
|
|
|
|
substituted for |
|
|
|
|||
|
|
|
|
|
|
DRI route is |
|
|
materials |
|
|
|
|
applications of |
|
||
|
Iron and |
|
|
requires |
|
|
|
|
|
|
electrolytic |
|
|
|
|||
|
|
|
|
|
used more, |
|
|
efficiency. 100% |
|
|
|
|
CCUS are usually |
|
|||
|
steel |
|
|
hydrogen. The |
|
|
|
|
|
|
hydrogen in the |
|
|
|
|||
|
|
|
|
|
relative to the |
|
|
hydrogen-based |
|
|
|
|
projected to have |
|
|||
|
production |
|
|
blast furnace |
|
|
|
|
|
|
current DRI |
|
|
|
|||
|
|
|
|
|
currently |
|
|
production could |
|
|
|
|
lower costs, |
|
|||
|
|
|
|
route |
|
|
|
|
|
|
route. Fully |
|
|
|
|||
|
|
|
|
|
|
dominant |
|
|
dramatically |
|
|
|
|
although these |
|
||
|
|
|
|
produces by- |
|
|
|
|
|
|
convert steel |
|
|
|
|||
|
|
|
|
|
|
blast furnace |
|
|
increase demand |
|
|
|
|
are highly |
|
||
|
|
|
|
product |
|
|
|
|
|
|
plants to utilise |
|
|
|
|||
|
|
|
|
|
|
route. |
|
|
for low-carbon |
|
|
|
|
uncertain. Long- |
|
||
|
|
|
|
hydrogen as a |
|
|
|
|
|
|
hydrogen as the |
|
|
|
|||
|
|
|
|
|
|
|
|
|
hydrogen in the |
|
|
|
|
term competition |
|
||
|
|
|
|
mixture of |
|
|
|
|
|
|
|
key reducing |
|
|
|
||
|
|
|
|
|
|
|
|
|
long term. |
|
|
|
|
from direct |
|
||
|
|
|
|
gases, which |
|
|
|
|
|
|
|
agent. |
|
|
|
||
|
|
|
|
|
|
|
|
|
|
|
|
|
|
electrification. |
|
||
|
|
|
|
are often used |
|
|
|
|
|
|
|
|
|
|
|
|
|
|
|
|
|
|
|
|
|
|
|
|
|
|
|
|
|
|
|
|
|
|
|
on site. |
|
|
|
|
|
|
|
|
|
|
|
|
|
|
|
|
|
Virtually no |
|
|
|
|
|
|
|
Hydrogen from |
|
Hydrogen |
|||
|
|
|
|
|
9% increase |
|
|
|
|
any source could |
|
expected to |
|||||
|
|
|
|
dedicated |
|
|
|
|
|
|
|||||||
|
|
|
|
|
in high- |
|
|
|
|
replace natural |
|
compete poorly |
|||||
|
|
|
|
hydrogen |
|
|
Heat demand |
|
|
||||||||
|
|
|
|
|
temperature |
|
|
gas, e.g. in |
|
with biomass and |
|||||||
|
High- |
|
production for |
|
|
likely to rise |
|
|
|||||||||
|
|
|
heat demand |
|
|
industrial |
|
direct CCUS in |
|||||||||
|
temperature |
|
generating |
|
|
further, providing |
|
|
|||||||||
|
|
|
under existing |
|
|
clusters or near |
|
general, but may |
|||||||||
|
heat |
|
heat. Some |
|
|
an opportunity |
|
|
|||||||||
|
|
|
policies. No |
|
|
hydrogen |
|
prove |
|||||||||
|
(excluding |
|
limited use of |
|
|
for hydrogen if it |
|
|
|||||||||
|
|
|
additional |
|
|
pipelines. Blends |
|
competitive with |
|||||||||
|
chemicals |
|
hydrogen- |
|
|
can compete on |
|
|
|||||||||
|
|
|
hydrogen use |
|
|
with natural gas |
|
direct |
|||||||||
|
and iron and |
|
containing off- |
|
|
cost in the |
|
|
|||||||||
|
|
|
without |
|
|
are more |
|
electrification. |
|||||||||
|
steel) |
|
gases from the |
|
|
prevailing policy |
|
|
|||||||||
|
|
|
significant |
|
|
straightforward |
|
Full fuel switches, |
|||||||||
|
|
|
|
iron and steel |
|
|
environment. |
|
|
||||||||
|
|
|
|
|
policy |
|
|
but less |
|
or CCUS, tend to |
|||||||
|
|
|
|
and chemical |
|
|
|
|
|
|
|||||||
|
|
|
|
|
support. |
|
|
|
|
environmentally |
|
entail significant |
|||||
|
|
|
|
sectors. |
|
|
|
|
|
|
|||||||
|
|
|
|
|
|
|
|
|
|
|
beneficial. |
|
investment. |
||||
|
|
|
|
|
|
|
|
|
|
|
|
|
|
||||
Hydrogen in oil refining
Oil refining – turning crude oil into various end-user products such as transport fuels and petrochemical feedstock – is one of the largest users of hydrogen today. Some 38 MtH2/yr, or 33% of the total global demand for hydrogen (in both pure and mixed forms), is consumed by refineries as feedstock, reagent and energy source. Around two-thirds of this hydrogen is produced in dedicated facilities at refineries or acquired from merchant suppliers (together called “on-purpose” supply). Hydrogen use is responsible for around 20% of total refinery emissions, and produces around 230 MtCO2/yr. Refineries’ existing large-scale demand for hydrogen is set to grow as regulations for sulphur content of oil products tighten. This provides a potential early market for hydrogen from cleaner pathways, which could lower the emissions intensity of transport fuels.
PAGE | 91
IEA. All rights reserved.

The Future of Hydrogen |
Chapter 4: Present and potential industrial uses of hydrogen |
How does the refining sector use hydrogen today?
Hydrotreatment and hydrocracking are the main hydrogen-consuming processes in the refinery. Hydrotreatment is used to remove impurities, especially sulphur (it is often simply referred to as desulphurisation)23 and accounts for a large share of refinery hydrogen use globally. Today refineries remove around 70% of naturally incurring sulphur from crude oils. With concerns about air quality increasing, there is growing regulatory pressure to further lower the sulphur content in final products. By 2020 40% less sulphur will be allowed in refined products than in 2005 despite the continued growth in demand (Figure 33).
Figure 33. |
Allowed sulphur content in oil products |
|
|
|
|
|
||||||
per year |
25 |
|
|
|
|
|
|
|
|
|
|
110 |
|
|
|
|
|
|
|
|
|
|
|||
15 |
|
|
|
|
|
|
|
|
|
90 |
||
Milliontonnes |
|
|
|
|
|
|
|
|
|
|||
|
20 |
|
|
|
|
|
|
|
|
|
|
100 |
|
10 |
|
|
|
|
|
|
|
|
|
|
80 |
|
|
|
|
|
|
|
|
|
|
|
||
|
|
|
|
|
|
|
|
|
|
|
||
|
5 |
|
|
|
|
|
|
|
|
|
70 |
|
|
2005 |
2007 |
2009 |
2011 |
2013 |
2015 |
2017 |
2019 |
2021 |
2023 |
|
|
|
|
|
Allowed sulphur content in refined products |
|
Oil demand (right axis) |
|
|
|||||
Note: mb/d = million barrels per day.
Source: IEA (2018a), World Energy Outlook 2018.
mb/d
The quantity of allowed sulphur in refined products continues to decrease, while oil demand continues to increase.
Hydrocracking is a process that uses hydrogen to upgrade heavy residual oils into higher-value oil products. Demand for light and middle distillate products is growing and demand for heavy residual oil is declining, leading to an increase in the use of hydrocracking. In addition to hydrotreatment and hydrocracking, some hydrogen that is used or produced by refineries cannot be economically recovered and is burned as fuel as part of a mixture of waste gases.
The United States, the People’s Republic of China (“China”) and Europe are the largest consumers of hydrogen in refineries. The three regions represent around half of total refinery hydrogen consumption, reflecting the volume of crude oil they process and the stringency of their product quality standards.
Hydrogen is also used for upgrading oil sands and hydrotreating biofuels. For oil sands, the amount of hydrogen needed to remove sulphur from the raw bitumen varies considerably depending on the upgrading technology and the quality of the synthetic crude oil produced.
23 It also treats other chemical components – nitrogenand oxygen-containing compounds or metals – that are unfavourable to fuel quality and/or refining equipment, such as catalysts.
PAGE | 92
IEA. All rights reserved.
The Future of Hydrogen |
Chapter 4: Present and potential industrial uses of hydrogen |
Overall around 10 kg of hydrogen is used per tonne of bitumen processed.24 The resulting synthetic crude oil still needs to be refined at a refinery, using hydrogen. For biofuels, hydrotreatment removes oxygen and improves the fuel quality of vegetable oils and animal fats processed into diesel substitutes. This process requires around 38 kg of hydrogen per tonne of biodiesel produced, but no further hydrogen is needed in subsequent refining steps.
Sources and costs of hydrogen for refinery use
Globally, refinery hydrogen demand is met through the use of on-site by-products, dedicated on-site production, or merchant supply (Figure 34).
On-site by-product hydrogen comes largely from catalytic naphtha reforming, a process that produces high-octane gasoline blending components and generates hydrogen at the same time. Refineries with integrated petrochemical operations also derive by-product hydrogen from steam cracking. However, on-site by-product hydrogen is unable to fully cover refinery hydrogen demand, except in small refineries running on very low sulphur crude oils and with relatively low yields of road transport fuels. On average, on-site by-product hydrogen meets one-third of refinery hydrogen demand. The gap needs to be met, either by dedicated on-site production (about 40% globally) or procurement from merchant suppliers (around a quarter).
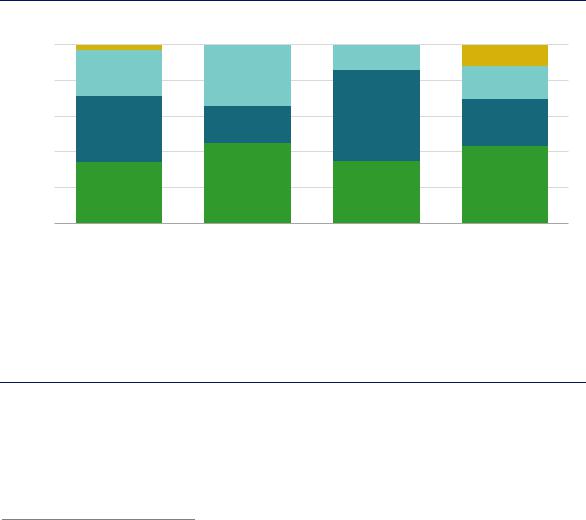
Figure 34. Sources of hydrogen supply for refineries in selected regions, 2018
100%
80%
60%
40%
20%
0%
World |
United States |
|
Europe |
|
China |
||||
|
|
Refinery by-product |
|
On-site SMR |
|
Merchant supply |
|
On-site coal |
|
|
|
|
|
|
|||||
|
|
|
|
|
|||||
Notes: SMR = steam methane reformer. For China, refinery by-product also includes hydrogen produced from refinery-integrated crackers.
Source: IEA 2019. All rights reserved.
Refinery hydrogen by-product covers only a third of hydrogen requirements, with the gap filled by dedicated on-site production and merchant supply.
Most dedicated on-site production uses natural gas feedstock, but light fractions of oil distillation and heavier feedstocks – petroleum coke, vacuum residues and coal – are also used in some regions. Use of heavier feedstocks is mostly restricted to India and China, where
24 Around 0.6 MtH2/yr is used to process 1 mb/d of bitumen.
PAGE | 93
IEA. All rights reserved.
The Future of Hydrogen |
Chapter 4: Present and potential industrial uses of hydrogen |
gas needs to be imported. Coal gasification is routinely included in new refinery setups in China as a main or auxiliary hydrogen production unit.
Merchant supply of hydrogen is an option in densely industrialised areas where developed hydrogen pipeline infrastructure exists, such as the US Gulf Coast and Europe’s Amsterdam- Rotterdam-Antwerp hub. As with dedicated on-site production, merchant hydrogen is mostly produced from natural gas, although a certain amount also comes from chemical processes, where it is a by-product of operations such as steam cracking and chlorine production. In regions such as the US Gulf Coast, merchant hydrogen can meet over a third of total hydrogen demand.
Hydrogen production costs vary widely, largely reflecting differences in natural gas prices. US production costs are among the world’s lowest, while costs are substantially higher in Europe and Asia. In the United States, hydrogen costs amount to around USD 1.1/kgH2 or USD 0.7 per barrel of oil refined. This may seem a relatively small cost component for refineries overall, for example in comparison with crude costs, but even a small cost advantage in hydrogen costs can have a notable impact on refining margins, which are generally thin in what is a very competitive market (Figure 35).
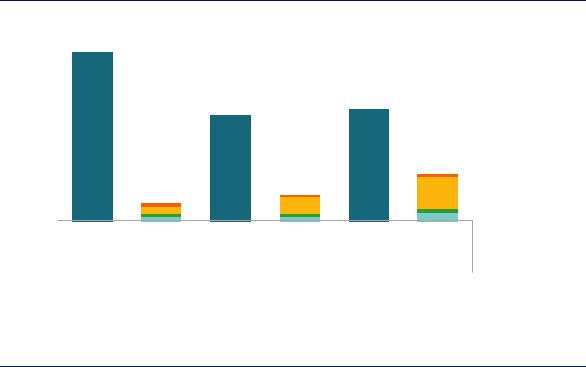
Figure 35. Hydrogen production costs compared to refining margins, 2018
barrelper |
8 |
|
|
|
|
|
CO2price |
|
|
|
|
|
|||
6 |
|
|
|
|
|
||
|
|
|
|
|
|
||
USD |
|
|
|
|
|
Fuel costs (gas) |
|
|
|
|
|
|
|||
|
|
|
|||||
|
|
|
|
|
|||
|
|
|
|
|
|
|
|
|
4 |
|
|
|
|
|
OPEX |
|
|
|
|
|
|
||
|
|
|
|
|
|
||
|
|
|
|
|
|
CAPEX |
|
|
|
|
|
|
|
||
|
2 |
|
|
|
|
|
|
|
|
|
|
|
|
||
|
|
|
|
|
|
||
|
|
|
|
|
|
Average refining |
|
|
|
|
|
|
|
||
|
|
|
|
|
|
|
|
|
|
|
|
|
|
|
|
|
|
|
|
|
|
|
|
|
|
|
|
|
|
|
margin (2010-18) |
0 |
|
Refining |
Hydrogen |
|
Refining |
Hydrogen |
|
Refining |
Hydrogen |
|
|
|
|||||||
|
|
|
|
||||||
|
|
margin |
cost |
|
margin |
cost |
|
margin |
cost |
|
|
United States |
|
European Union |
|
|
Asia |
||
Note: Based on production costs via natural-gas based SMR. More information on the assumptions is available at www.iea.org/hydrogen2019.
Source: IEA 2019. All rights reserved.
In many regions, hydrogen costs are a significant drain on refinery profits.
Potential for future hydrogen demand in oil refining
In recent decades, refinery hydrogen demand has grown substantially as a result of growing refining activity and rising requirements for hydrotreating and hydrocracking. This trend is set to continue as fuel specifications globally further reduce acceptable levels of sulphur content. Many countries, including China, have already reduced sulphur content requirements in road transport fuels such as gasoline or diesel to under 0.0015%, and others may introduce similar standards. The International Maritime Organization has also introduced new bunker fuel regulations that limit the sulphur content of marine fuels to no more than 0.5% from 2020 (IEA, 2019a), and this is likely to lead to a significant increase in hydrogen requirements for marine
PAGE | 94
IEA. All rights reserved.

The Future of Hydrogen |
Chapter 4: Present and potential industrial uses of hydrogen |
fuel production. However, hydrogen demand is also a function of inherent sulphur content in crude oils. The average quality of crude oil supply has been getting lighter and sweeter in recent years, due primarily to surging US tight oil output, and this is likely to moderate the need for hydrogen to some degree. Under current trends, overall hydrogen demand in refineries is set to grow by 7% to 41 MtH2/yr in 2030.
Beyond 2030 current trends and policies suggest the pace of hydrogen demand growth to slow down, as the scope to tighten product quality standards decreases and as oil demand for transport fuels is affected by a combination of efficiency improvements and electrification. Refiners are also likely to increase the efficiency of hydrogen recovery from waste refinery gases, lowering requirements for additional hydrogen production. Refinery hydrogen demand would decline in a scenario compatible with the objectives of the Paris Agreement, with the impact of declining oil demand more than offsetting that of higher hydrogen intensity.
Irrespective of the future trajectory of global energy demand, one common aspect is the dominant share of existing refineries in projected hydrogen demand. There is already sufficient refining capacity globally to fulfil the expected need for oil products. Together with the long lifetime of refineries, this limits the scope for substantial addition of new refining capacity. As a result, some 80–90% of cumulative on-purpose hydrogen supply (including both dedicated onsite production and merchant procurement) between today and 2030 would come from existing refineries in both scenarios (Figure 36).
Figure 36. Future hydrogen demand in oil refining under two different pathways
|
|
|
|
In line with current trends |
|
|
|
|
|
In line with the Paris Agreement |
|
|
|||||
/yr |
50 |
|
|
|
|
|
|
|
/yr |
50 |
|
|
|
|
|
|
|
|
|
|
|
|
|
|
|
|
|
|
|
|
|
||||
|
|
|
|
|
|
|
|
|
|
|
|
|
|
|
|
||
2 |
|
|
|
|
|
|
|
|
2 |
|
|
|
|
|
|
|
|
MtH |
40 |
|
|
|
|
|
|
|
MtH |
40 |
|
|
|
|
|
|
|
|
|
|
|
|
|
|
|
|
|
|
|
|
|
|
|
||
|
30 |
|
|
|
|
|
|
|
|
30 |
|
|
|
|
|
|
|
|
|
|
|
|
|
|
|
|
|
|
|
|
|
|
|
||
|
20 |
|
|
|
|
|
|
|
|
20 |
|
|
|
|
|
|
|
|
|
|
|
|
|
|
|
|
|
|
|
|
|
|
|
||
|
10 |
|
|
|
|
|
|
|
|
10 |
|
|
|
|
|
|
|
|
|
|
|
|
|
|
|
|
|
|
|
|
|
|
|
||
|
0 |
|
|
|
|
|
|
|
|
0 |
|
|
|
|
|
|
|
|
2018 |
2022 |
2026 |
2030 |
|
2018 |
2022 |
2026 |
2030 |
||||||||
|
|
|
Refinery by-product |
|
On-purpose supply (existing refineries) |
|
|
On-purpose supply (new refineries) |
|
|
|||||||
|
|
|
|
|
|
|
|||||||||||
|
|
|
|
|
|
|
|||||||||||
Note: On-purpose supply refers to both dedicated on-site production and merchant procurement.
Source: IEA 2019. All rights reserved.
Future hydrogen demand in the refining sector comes mostly from today’s existing capacity.
Meeting future hydrogen demand in oil refining while reducing emissions
Hydrogen production – unless supplied as a by-product of refining operations – currently results in considerable CO2 emissions. Globally the production of hydrogen for use in refineries contributes some 230 MtCO2/yr emissions, which is around 20% of total refinery emissions.
PAGE | 95
IEA. All rights reserved.

The Future of Hydrogen |
Chapter 4: Present and potential industrial uses of hydrogen |
Demand and emissions are all set to rise in future. If future demand growth is met using coal, which is widely used without CCUS to produce hydrogen in countries such as China, the level of CO2 emissions would further increase.
Producing hydrogen in a cleaner way is therefore vital to achieving a significant reduction in emissions from refining operations. Other key measures – such as energy efficiency and fuel switching away from emission-intensive fuels – have already been widely adopted in many refineries, limiting opportunities for further emissions reduction. Against this background, together with sizeable demand already existing today, the refining industry offers a potential early market for low-carbon hydrogen.
Cost competitiveness of cleaner pathways
There are two main cleaner pathways to hydrogen production for refineries: equipping coalor natural gas-based hydrogen production facilities with CCUS; and using electrolytic hydrogen from low-carbon electricity. Given that the bulk of future hydrogen demand comes from existing refineries and that most refineries are already equipped with SMR units, natural gas with CCUS offers a more obvious route to low-carbon hydrogen than does renewablesbased electrolysis. The incremental costs for the production of low-carbon hydrogen are limited to CCUS facilities, which makes natural gas with CCUS more competitive than electricity-based options, and capturing CO2 emissions from an SMR unit represents one of the lowest-cost opportunities to apply CCUS in a refinery because much of this CO2 is emitted in a highly concentrated stream.
However, despite the continued decline of technology costs for CCUS, the large-scale adoption of CCUS at hydrogen production units in refineries needs a helping hand from policy makers, especially given the tight margins and highly competitive nature of the refining industry. Introducing CCUS would add an incremental cost of some USD 0.25–0.5/barrel, which is higher than today’s carbon price levels (zero to USD 0.1/barrel).25 This implies that refiners are likely to be inclined to pay CO2 prices rather than to direct effort to capturing and storing CO2. Higher carbon prices, or equivalent policy incentives, would change the picture. A carbon price higher than USD 50/tCO2, for example, would make natural gas with CCUS economically attractive in most regions and could trigger a wider deployment of CCUS at SMR facilities (Figure 37). In the United States a tax incentive known as “45Q” is worth up to USD 50/tCO2 for CCUS operations online by 2026. The case for investment would be further strengthened if captured CO2 could be sold to industrial users or upstream oil companies for enhanced oil recovery (EOR). Low-carbon fuel standards could also help spur CCUS: standards of this kind have already been introduced in Canada, Europe and some US states, including California (Box 8).
25 The incremental costs for CCUS installation are also higher than the 2030 carbon price levels envisaged in the IEA New Policies Scenario, which are around USD 0.2/barrel.
PAGE | 96
IEA. All rights reserved.

The Future of Hydrogen |
Chapter 4: Present and potential industrial uses of hydrogen |
Figure 37. Hydrogen production costs from natural gas with and without CCUS by region under different carbon prices, 2030
United States |
European Union |
China |
per barrel |
4 |
|
3 |
||
USD |
||
|
||
|
2 |
1 |
|
|
|
|
|
|
|
|
|
|
|
|
|
|
|
|
|
0 |
|
|
|
|
|
0 |
20 |
40 |
60 |
80 |
100 |
0 |
20 |
40 |
60 |
80 |
100 |
0 |
20 |
40 |
60 |
80 |
100 |
||||||||||||
|
|
Carbon price (USD/tCO2) |
|
|
Carbon price (USD/tCO2) |
|
|
Carbon price (USD/tCO2) |
|||||||||
|
|
|
Natural gas without CCUS |
|
|
|
|
Natural gas with CCUS |
|
|
|
||||||
Notes: To show hydrogen costs in terms of their impact on refinery costs, 0.64, 0.63 and 1.04 kgH2/barrel are used for conversion for the United States, European Union and China respectively. More detail on the assumptions available at www.iea.org/hydrogen2019.
Source: IEA 2019. All rights reserved.
CCUS would become economically attractive at refineries in most regions if CO2 prices were above USD 50/tCO2.
The costs of introducing CCUS also depend on the costs of CO2 storage, which means that the successful introduction of CCUS is contingent on CO2 storage being available and accessible with known and manageable costs and risks. Cost reduction efforts therefore need to be complemented by policy measures to bring about the building of CO2 storage infrastructure and the development of operating businesses in the appropriate locations. This would also have the benefit of laying the ground for the adoption of CCUS in other industries.
A number of refineries have already installed CCUS facilities for hydrogen production. Some of the emissions from the 400 thousand barrels per day (kb/d) Pernis refinery in Rotterdam are captured, transported and used in nearby greenhouses. In 2017 Air Product’s Port Arthur project in Texas completed its demonstration phase; it captures CO2 for EOR operations at the West Hastings oil field. In France, Air Liquide’s Port Jerome project captures and sells CO2, and Hokkaido Refinery in Japan has put in place pilot CCUS facilities. There is also one bitumen upgrader equipped with CCUS in operation today – the Quest project in Canada – which captures around 20% of the emissions from the 255 kb/d upgrader. In total, the four CCUS plants which are now in operation in refineries have the capacity to produce over 150 ktH2/yr of low-carbon hydrogen.26
Potential also exists at refineries for electrolytic hydrogen to replace dedicated hydrogen production from natural gas or coal. For the moment no refineries are using electrolytic hydrogen, but Shell’s 200 kb/d Rheinland refinery in Germany has announced a 10 MW electrolyser project for 2020 that will supply around 1 ktH2, or 1% of the refinery’s hydrogen needs. Heide, a small refinery near Hamburg, Germany, has announced a 30 MW electrolyser paired with offshore wind power to replace purchases of up to 3 ktH2/yr. BP, Nouryon and the
26 Calculated by multiplying hydrogen production capacity by the CO2 capture rate to label a fraction of the capacity as “low carbon”.
PAGE | 97
IEA. All rights reserved.

The Future of Hydrogen |
Chapter 4: Present and potential industrial uses of hydrogen |
Port of Rotterdam Authority are also jointly assessing the feasibility of a 250 MW electrolysis plant for the production of 45 ktH2/yr for the BP refinery in Rotterdam. Despite this progress, policy support is going to be needed if electrolysis is to take off at scale.
In certain instances there is also scope to avoid some current hydrogen-related emissions through “outside-gate collaboration” (CIEP, 2018). Petrochemical steam crackers tend to generate a surplus of hydrogen that could be used in refineries; conversely, the low-value fuel gases produced by refineries can be used in steam crackers. Incentivising the development of the necessary infrastructure to exchange these products within industrial clusters would help to reduce overall emissions.
Box 8. Can California’s Low Carbon Fuel Standard support low-carbon hydrogen?
In 2007 California enacted a world-first mandate to reduce the carbon intensity of transport fuel used in the state. It requires oil refiners and distributors to meet a declining target for the complete lifecycle greenhouse gas emissions of transport fuels so as to deliver a 20% reduction in carbon intensity by 2030, compared to a 2010 baseline. Policies that take a similar approach are now in place in the European Union, Oregon and Canada, where a clean fuel standard is under development for all fuels and end uses.
Amendments in California in 2019 expanded the range of eligible abatement technologies, and introduced incentives to develop hydrogen refuelling and electric vehicle fast-charging stations. The amendments also included measures to enable carbon capture and sequestration operators to receive credit for emission reductions, including via direct air capture of CO2 outside California.
California’s Low Carbon Fuel Standard (LCFS) is a market-based standard with tradeable credits. Suppliers of fuel with a carbon intensity above the target generate deficits and must buy credits equivalent to their deficit from suppliers of lower carbon fuels. This system motivates fuel suppliers to keep improving their carbon intensity, even if they are already producing a renewable fuel or charging electric vehicles. Credits are issued in units of tonnes of CO2 equivalent, relative to a standard value for gasoline, diesel or jet fuel (CARB, 2019a). Over time the diversity of sources of credits has increased. In 2011 bioethanol suppliers received 80% of credits. In 2018 supply of renewable diesel, biodiesel, electricity and biomethane generated over 60% of credits. The average price for the 13 million credit transactions in 2018 was USD 160/tCO2.
Hydrogen can generate credits in a variety of ways, which include:
Operation of a hydrogen refuelling station
Supply of hydrogen to fuel cell electric vehicles (FCEVs) or forklifts
Supply of petroleum products produced using low-carbon hydrogen, for example from CCUS, steam-reforming of biomethane, or electrolysis in refineries
Supply of renewable diesel or alternative jet fuel produced using low-carbon hydrogen input
Use of an electrolyser at times of day with low carbon intensity electricity.
The value of a unit of hydrogen varies according to use and life cycle CO2 emissions. For example, at USD 160/tCO2 one kg of low-carbon hydrogen with zero upstream emissions would be worth roughly USD 4.3 if used directly in a fuel cell car, USD 3.6 if used directly in a fuel cell forklift, or
PAGE | 98
IEA. All rights reserved.

The Future of Hydrogen |
Chapter 4: Present and potential industrial uses of hydrogen |
|
|
|
|
USD 2.3 if replacing natural gas-based hydrogen in a refinery or renewable diesel facility. Most LCFS credits generated by hydrogen in 2018 were for the use of natural gas-derived hydrogen in vehicles; these would be worth USD 2.2/kgH2 at USD 160/tCO2 (CARB, 2019b).
Fuel suppliers have not yet used low-carbon hydrogen at refineries to generate credits to meet their obligations. One facility generates credits by fuelling buses with hydrogen produced via electrolysis using a mix of solar and grid electricity. Several renewable diesel facilities using hydrogen are certified. At USD 160/tCO2 the price of credits is above the cost of using CCUS for hydrogen production from natural gas. The LCFS also interacts with other policy instruments in California, such as the Zero Emissions Vehicle mandate, the cap-and-trade system, and infrastructure grants and tax credits for FCEVs, and this has the potential to raise the profitability of eligible projects.
Hydrogen in the chemical sector
The chemical sector accounts for the secondand third-largest sources of demand for hydrogen today: ammonia at 31 MtH2/yr and methanol at 12 MtH2/yr. Other comparatively minor applications take its overall demand to 46 MtH2/yr, or 40% of total hydrogen demand in both pure and mixed forms. It is also a large producer of by-product hydrogen, which is both consumed within the sector itself and distributed for use elsewhere. The vast majority of the hydrogen that the chemical sector consumes is produced using fossil fuels, and this generates considerable quantities of greenhouse gas emissions. Reducing the level of emissions represents an important challenge for the sustainability of the sector’s energy use, and a significant opportunity to make use of low-carbon hydrogen.
How does the chemical sector use hydrogen today?
The chemical sector produces a complex array of outputs, from plastics and fertilisers to solvents and explosives. This section focuses primarily on ammonia and methanol, and to a lesser extent on ethylene, propylene, benzene, toluene and mixed xylenes. These seven “primary chemicals” account for around two-thirds of the chemical sector’s energy consumption, and the vast majority of its demand for energy products as raw material inputs (so-called “feedstocks”).
Hydrogen is part of the molecular structure of almost all industrial chemicals, but only some primary chemicals require large quantities of dedicated hydrogen production for use as feedstock, notably ammonia and methanol (Figure 38). More than 31 MtH2/yr of hydrogen are used as feedstock to produce ammonia, and more than 12 MtH2/yr to produce methanol. A further 2 MtH2/yr are consumed in comparatively small-volume processes (for example in hydrogen peroxide and cyclohexane production), but most of this is supplied from by-product hydrogen generated within the sector.
PAGE | 99
IEA. All rights reserved.

The Future of Hydrogen |
Chapter 4: Present and potential industrial uses of hydrogen |
Figure 38. Hydrogen demand for ammonia and methanol production in 2018
MtH2/yr
4
3
2
1
0
Ammonia |
Methanol |
N. America
Ammonia |
Methanol |
|
CSA |
Ammonia |
Methanol |
Ammonia |
Methanol |
Europe |
Africa |
||
Ammonia |
Methanol |
Middle East
Ammonia |
Methanol |
Eurasia
16 |
Pacific) |
|
|
||
12 |
/yr (Asia |
|
8 |
||
2 |
||
|
MtH |
|
4 |
|
|
0 |
|
Ammonia |
Methanol |
Asia Pacific
 Coal
Coal
 Oil
Oil
 Natural gas
Notes: Only production routes comprising > 1 Mt/yr of primary chemical production are included; oil refers to refined oil products including naphtha and LPG. CSA = Central and South America. Data for 2018 are estimates based on previous years’ figures from the sources below.
Sources: IFA (2019), International Fertilizer Association Database; WoodMackenzie (2018), Methanol Production and Supply Database.
Today natural gas accounts for 65% of ammonia and methanol production; coal-based production accounts for 30%.
Fossil fuels have long been a convenient and cost-effective source of both the hydrogen and carbon for ammonia and methanol production. In 2018 around 270 Mtoe/yr of fossil fuels were used to produce the hydrogen for these two products,27 roughly equivalent to the combined oil demand of Brazil and the Russian Federation. Because production via natural gas (reforming) is more efficient than via coal (gasification), the former accounts for 65% of hydrogen production, but less than 55% of the energy inputs required to produce it. The differing regional prices of gas and coal are also a key determining factor in the choice of process route. Almost all hydrogen from coal for use in the chemical sector is produced and used in China.
Ammonia is mostly used in the manufacture of fertilisers such as urea and ammonium nitrate (around 80%). The remainder is used for industrial applications such as explosives, synthetic fibres and other specialty materials, which are an increasingly important source of demand.
Methanol is used for a diverse range of industrial applications, including the manufacture of formaldehyde, methyl methacrylate and various solvents. Methanol is also used in the production of several other industrial chemicals, and for the methanol-to-gasoline process that produces gasoline from both natural gas and coal, which has proven attractive in regions with abundant coal or gas reserves but with little or no domestic oil production. This is one of the fuel applications of methanol, whether blended in pure form or used after further conversion (e.g. to methyl-tert butlyl ether), that account for around a third of the chemical’s use globally (Levi and Cullen, 2018; Methanol Institute, 2019). The development of methanol-to-olefins and methanol-to-aromatics technology has opened up an indirect route from methanol to high-value chemicals (HVCs), and thus to plastics. Methanol-to-olefins technology is currently deployed at commercial scale in China, accounting for 9 million tonnes per year (Mt/yr) or 18%
27 Including feedstock and process energy requirements.
PAGE | 100
IEA. All rights reserved.