

БЭМЗ полищук доки / 2020 / А2000 минск / Стандарт MIL-STD-202G
.pdfMIL-STD-202G
2.2.2Transducer. The fundamental resonant frequency of the accelerometer shall be greater than 30,000 Hz, when the accelerator is employed as the shock sensor.
2.2.3Transducer calibration. Transducers shall be calibrated in accordance with ASA STD S2.2-1959. The accuracy of the calibration method shall be at least ±5 percent over the frequency range of 2 to 5,000 Hz. The amplitude of the transducer being calibrated shall also be ±5 percent over the frequency range of 4 to 5,000 Hz.
2.2.4Linearity. The signal level of the system shall be chosen so that the acceleration pulse operates over the linear portion of the system.
2.2.5Transducer mounting. When conformance to 2.3 is required, the monitoring transducer shall be rigidly secured and located as near as possible to an attachment point of the specimen but not on the specimen itself.
2.3 Application of shock measuring instrumentation. Shock measuring instrumentation shall be utilized to determine that the correct input shock pulse is applied to the test specimen. This is particularly important where a multi-specimen test is made. Generally, the shock pulse should be monitored whenever there is a change in the test setup, such as a different test fixture, different component (change in physical characteristics), different weight, different shock pulse (change in pulse shape, intensity, or duration) or different shock machine characteristics. It is not mandatory that each individual shock be monitored, provided that the repeatability of the shock application as specified in 2.1.1 has been established.
3. SHOCK PULSES. Two types of shock pulses, a half-sine shock pulse and a sawtooth shock pulse, are specified. The pulse shape and tolerances are shown on figures 213-1 and 213-2, respectively. For single degree of freedom systems, a sawtooth shock pulse can be assumed to have a damage potential at least as great as that of the half-sine pulse if the shock spectrum of the sawtooth pulse is everywhere at least as great as that of the half-sine pulse. This condition will exist for two such pulses of the same duration if over most of the spectrum the acceleration peak value of the sawtooth pulse is 1.4 times the acceleration peak value of the half-sine pulse.
3.1 Half-sine shock pulse. The half-sine shock pulse shall be as indicated on figure 213-1. The velocity change of the pulse shall be within ±10 percent of the velocity change of the desired shock pulse. The velocity change may be determined either by direct measurement, indirectly, or by integrating (graphically or electrically) the area (faired acceleration pulse may be used for the graphical representation) under the measured acceleration pulse. For halfsine acceleration pulses of less than 3 milliseconds duration the following tolerances should apply: The faired maximum value of the measured pulse shall be within ±20 percent of the specified ideal pulse amplitude, its duration shall be within ±15 percent of the specified ideal pulse duration, and the velocity change associated with the measured pulse shall be within ±10 percent of Vi = 2AD/π . See figure 213-1. The measured pulse will then be considered a nominal half-sine pulse with a nominal amplitude and duration equal to respective values of the corresponding ideal half-sine pulse. The duration of the measured pulse shall be taken as Dm = D(.1A)/.94; where D(.1A) is the time between points at .1A for the faired measured acceleration pulse.
3.1.1 The ideal half-sine pulse. An ideal half-sine acceleration pulse is given by the solid curve. See figure 213-1. The measured acceleration pulse must lie within the boundaries given by the broken lines. In addition, the actual velocity change of the shock must be within 10 percent of the ideal velocity change. The actual velocity change can be determined by direct measurements, or from the area under the measured acceleration curve. The ideal velocity change is equal to Vi = 2AD/π ; where A is the acceleration amplitude and D is the pulse duration of the ideal pulse.
METHOD 213B
16 April 1973
5
MIL-STD-202G
3.2 Sawtooth shock pulse. The sawtooth pulse shall be as indicated on figure 213-2. The velocity change of the faired measured pulse shall be within ±10 percent of the velocity change of the ideal pulse.
3.2.1 The ideal terminal-peak sawtooth. An ideal terminal-peak sawtooth acceleration pulse is given by the solid line. See figure 213-2. The measured acceleration pulse must be within the boundaries given by the broken lines. In addition, the actual velocity change of the shock pulse must be within 10 percent of the ideal value. The actual velocity change can be determined from direct measurements, or from the area under the measured acceleration curve. The ideal velocity change is equal to Vi = PD/2; where P is the peak value of acceleration, and D is the pulse duration.
4. PROCEDURE. The test specimen shall be mounted as specified in the component specification. Whenever possible, the test load shall be distributed uniformly on the test platform in order to minimize the effects of unbalanced loads.
4.1 Basic design test. Three shocks in each direction shall be applied along the three mutually perpendicular axes of the test specimen (18 shocks). If the test specimen is normally mounted on vibration isolators, the isolators shall be functional during the test. The specified test pulse (half-sine or sawtooth pulse) shall be in accordance with figures 213-1 and 213-2, respectively, and shall have a duration and peak value in accordance with one of the test conditions of table 213-1.
TABLE 213-1. Test condition values.
Test |
Peak value |
Normal |
Waveform |
Velocity |
|
condition |
(g’s) |
duration (D) (ms) |
|
|
change (Vi) ft/sec |
A |
50 |
11 |
Half-sine |
|
11.3 |
B |
75 |
6 |
Half-sine |
|
9.2 |
C |
100 |
6 |
Half-sine |
1/ 2/ 3/ |
12.3 |
D |
500 |
1 |
Half-sine |
10.2 |
|
E |
1,000 |
0.5 |
Half-sine |
1/ 2/ 3/ |
10.2 |
F |
1,500 |
0.5 |
Half-sine |
1/ 2/ 3/ |
15.4 |
G |
50 |
11 |
Sawtooth 2/ |
8.8 |
|
H |
75 |
6 |
Sawtooth 2/ |
7.2 |
|
I |
100 |
6 |
Sawtooth |
2/ |
9.7 |
J |
30 |
11 |
Half-sine |
|
6.8 |
K |
30 |
11 |
Sawtooth |
|
5.3 |
1/ For half-sine shock pulses of less than 3 milliseconds duration, it is not required that the envelope fall within the tolerances specified on figure 213-1. The faired amplitude of the measured pulse shall be within ±20 percent of the ideal amplitude. The measured duration shall be within ±15 percent of the specified amplitude duration. The velocity change of the faired measured pulse shall be within ±10 percent of the ideal pulse. The duration of the pulse shall be measured at the 0.1A point on the pulse. The duration of the pulse shall be the duration measured at the 0.1A point divided by .94. Test conditions D, E, and F are principally applicable to semiconductors.
2/ Test conditions G, H, and I (sawtooth) waveforms are preferred, except for semiconductors, for which test conditions D, E, and F (half-sine) are preferred.
3/ For test condition D. Where the weight of multi-specimen and fixtures exceeds 150 pounds, there is a question as to whether the shock pulse is properly transmitted to all specimens. Due consideration should be given to the design of the test fixture to assure the proper shock input to each specimen. This also applies to test conditions E and F except that where the weight of the multi-specimen and fixtures exceeds 25 pounds.
METHOD 213B
16 April 1973
6
MIL-STD-202G
5.MEASUREMENTS. Measurements are to be made before and after the required number of shocks unless otherwise specified, and during the test if specified.
6.SUMMARY. The following details are to be specified in the individual specification:
a.Mounting method and accessories (see 2.2.5 and 4).
b.Test condition letter (see 4.1).
c.Measurements before, during, and after the test (see 5).
METHOD 213B
16 April 1973
7
MIL-STD-202G
METHOD 214A
RANDOM VIBRATION
1.PURPOSE. This test is conducted for the purpose of determining the ability of component parts to withstand the dynamic stress exerted by random vibration applied between upper and lower frequency limits to simulate the vibration experienced in various service field environments. Random vibration is characteristic of modern field environments produced by missiles, high-thrust jets and rocket engines. In these types of environments, the random vibration provides a more realistic test. For design purposes, however, a swept frequency sinusoidal test may yield more pertinent design information.
2.APPARATUS.
2.1 Vibration system. The vibration system, consisting of the vibration machine, together with its auxiliary equipment shall be capable of generating a random vibration for which the magnitude has a gaussian (normal) amplitude distribution, except that the acceleration magnitudes of the peak values may be limited to a minimum of three times the rms (three-sigma (σ) limits). The machine shall be capable of being equalized so that the magnitude of its spectral density curve will be between specified limits (for example, see figures 214-1 and 214-2) when the test item, or a substitute equivalent mass, is appropriately secured to the vibration machine. The equalization of an electro-dynamic vibration machine system is the adjustment of the gain of the electrical amplifier and control system so that the ratio of the output vibration amplitude to the input signal amplitude is of a constant value (or given values) throughout the required frequency spectrum.
2.1.1 Control and analysis of vibration.
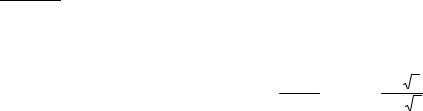
a.Spectral density curves. The output of the vibration machine shall be presented graphically as power spectral density versus frequency. 1/ The spectral density values shall be within +40 and -30 percent (±1.5 dB) of the specified values between a lower specified frequency and 1,000 Hz, and within +100 and -50 percent (±3 dB) of the specified values between 1,000 and 2,000 Hz. A filter bandwidth will be a maximum of 1/3 octave or a frequency of 25 Hz, whichever is greater.
b.Distribution curves. A probability density distribution curve may be obtained and compared with a gaussian distribution curve. The experimentally obtained curve should not differ from the gaussian curve by more than ±10 percent of the maximum value.
1/ Power spectral density is the mean square value of an oscillation passed by a narrow-band filter per unit filter bandwidth. For this application it is expressed as G2/f where G2/f is the mean square value of acceleration expressed in gravitational units per number of cycles of filter bandwidth. The spectral density curves are usually plotted either on a logarithmic scale, or in units of decibels (dB). The number of decibels is defined by the equation:
dB = 10 log |
G2 |
/ f |
= 20 log |
G / |
f |
|
G2r / f |
Gr / |
f |
||||
|
|
|||||
The rms value of acceleration within a frequency band between f1 and f2 is:
|
|
∫ |
f |
2 |
|
|
1/2 |
|
Grms = |
|
2 |
f df |
|
||||
|
G |
|||||||
|
|
|
|
|||||
|
|
f1 |
|
|
|
|
||
Where G2r/f is a given reference value of power spectral density, usually the maximum specified value.
METHOD 214A
28 March 1984
1 of 4
MIL-STD-202G
2.2 Monitoring. Monitoring involves measurements of the vibration excitation and of the test item performance. When required in the individual specification, the specimen may be monitored during the test. The details of the monitoring circuit, including the method and points of connection to the specimen, shall be specified.
2.2.1 Vibration input. The vibration magnitude shall be monitored on a vibration machine, on mounting fixtures, at locations that are as near as practical to the test item mounting points. When the vibration input is measured at more than one point, the minimum input vibration shall normally be made to correspond to the specified test curve (see figures 214-1 and 214-2). For massive test items and fixtures, and for large force exciters or multiple vibration exciters, the input-control value may be an average of the average magnitudes of three or more inputs. Accelerations in the transverse direction, measured at the test item attachment points, shall be limited to 100 percent of the applied vibration. The individual specification shall specify the number and location of the test points.
3.METHOD OF MOUNTING. The specimens shall be mounted in accordance with the instructions in the individual specifications. The orientation of the specimen or direction(s) of the applied vibration motion shall be as specified. Any special test fixtures or jigs required to run the test shall be as specified in sufficient detail in the individual specification to assure reproducibility of the input motion applied to the specimen. These details shall include the dimensions, the materials, temper, etc., as applicable.
4.PROCEDURE. The specimen, or substitute equivalent mass, shall be mounted in accordance with 3 and the monitoring equipment attached, if applicable, in accordance with 2.2. The vibration machine shall then be operated and equalized or compensated to deliver the required frequencies and intensities conforming to the curves specified test condition I, figure 214-1, or test condition II, figure 214-2 (see 2.1). If the order of application of the different directions is critical, it also shall be specified in the individual specification. The specimen shall then be subjected to the vibration specified by the test condition letter (see tables 214-I and 214-II) for the duration as specified in the individual specification:
3-minutes; 15-minutes; 1-1/2 hours; or, 8-hours;
In each of three mutually perpendicular directions, and in the order specified as applicable. The measurements made before, during, and after the test shall be made in accordance with 5 and if the specimen shall be monitored during the test, the details shall be as specified in 2.2.
5.MEASUREMENTS. Measurements shall be performed before, during, and after the test as specified in the individual specification.
6.SUMMARY. The following details are to be specified in the individual specification:
a.Monitoring instrumentation, if applicable (see 2.2).
b.The number and location of test points (see 2.2.1).
c.Method of mounting and orientation (see 3).
d.Test condition (I or II); letter (A-K); and duration of test (3-minutes, 15-minutes, 1-1/2 hours, or 8-hours) (see 4).
e.Order of application of vibration direction, if applicable (see 4).
f.Measurements before, during, and after test (see 5).
METHOD 214A
28 March 1984
2

MIL-STD-202G
FIGURE 214-1. Test condition I, random vibration test-curve envelope (see table 214-I).
TABLE 214-I. Values for test-condition I. 1/
Characteristics
Test |
Power spectral |
Overall |
condition letter |
density |
rms G |
A |
.02 |
5.35 |
B |
.04 |
7.56 |
C |
.06 |
9.26 |
D |
.1 |
11.95 |
E |
.2 |
16.91 |
F |
.3 |
20.71 |
G |
.4 |
23.91 |
H |
.6 |
29.28 |
J |
1.0 |
37.80 |
K |
1.5 |
46.30 |
1/ For duration of test, see 4.
METHOD 214A
28 March 1984
3
MIL-STD-202G
FIGURE 214-2. Test condition II, random vibration test-curve envelope (see table 214-II).
TABLE 214-II. Values for test-condition II. 1/
Characteristics
Test |
Power spectral |
Overall |
condition letter |
density |
rms G |
A |
.02 |
6.21 |
B |
.04 |
8.78 |
C |
.06 |
10.76 |
D |
.1 |
13.89 |
E |
.2 |
19.64 |
F |
.3 |
24.06 |
G |
.4 |
27.78 |
H |
.6 |
34.02 |
J |
1.0 |
43.92 |
K |
1.5 |
53.79 |
1/ For duration of test, see 4.
METHOD 214A
28 March 1984
4

MIL-STD-202G
METHOD 215K
RESISTANCE TO SOLVENTS
1.PURPOSE. The purpose of this test is as follows:
a.To verify that markings or color coding will not become illegible or discolored on the parts (including printed wiring boards) when subjected to solvents and processes normally used to clean solder-flux, fingerprints, and other contaminants from printed-wiring and terminal-board assemblies, etc.
b.To verify that component protective coatings and encapsulant materials are not degraded to the point where electrical or mechanical integrity is disturbed when subjected to solvents and processes normally used to clean solder flux, fingerprints, and other contaminants from printed-wiring and terminal-board assemblies, etc.
1.1Formulation of solvents. The formulation of solvents is considered typical and representative of the solvents used in printed wiring assembly processing of electronic components. Processing conditions are representative of processes used for printed wiring assembly.
1.2Checks for conflicts. When this test is referenced, care should be exercised to assure that conflicting requirements, as far as the properties of the specified finishes and markings are concerned, are not invoked.
2. MATERIALS
2.1 Solvent solutions. The solvent solutions used in this test shall consist of the following (see table I for summary).
a.A mixture consisting of the following:
1.One part by volume of isopropyl alcohol, American Chemical Society (ACS) reagent grade, or isopropyl alcohol in accordance with TT-I-735, grade A or B, and
2.Three parts by volume of mineral spirits in accordance with MIL-PRF-680, type I, or three parts by volume of a mixture of 80 percent by volume of kerosene and 20 percent by volume ethylbenzene.
b.This solvent has been deleted. When a suitable replacement solvent has been determined, it will be added as solution b.
c.A terpene defluxer consisting of a minimum of 90 percent d-limonene and 10 percent surfactant. 1/
d.A mixture consisting of the following:
1.Forty-two parts by volume water, 1 megohm-cm minimum resistivity.
2.One part by volume of propylene glycol monomethyl ether (glycol ether PM, 1-methoxy-2-propanol).
3.One part by volume of monoethanolamine. 2/
2.1.1Solvent solutions, safety aspects. Solvent solutions listed in 2.1a through 2.1d exhibit some potential for health and safety hazards. Safety precautions as listed in the appropriate manufacturers material safety data sheet shall be observed.
1/ A commonly used terpene defluxer is BIOACT EC-7R. "BIOACT" is a registered Trademark of Petroferm INC; "EC-7 and EC7R" are trademarks of Petroferm INC.
2/ Normal safety precaution for handling this solution (e.g., same as those for diluted ammonium hydroxide) based on O.S.H.A. rules for monoethanolamine.
METHOD 215K
8 February 2002
1 of 4
MIL-STD-202G
2.2Vessel. The vessel for solvent immersion shall be a container made of non-reactive material and of sufficient size to permit complete immersion of the specimens in the solvent solutions specified in 2.1.
2.3Brush. The brush shall be a toothbrush with a handle made of a non-reactive material. The brush shall have three or four long rows, 1 and 1/8 ±1/8 inch in length, of hard bristles. Each row shall contain eight to twelve tufts, the free ends of which shall lie substantially in the same plane. The brush shall be used with a single solvent and when there is any evidence of softening, bending, wear, or loss of bristles, it shall be discarded.
3. PROCEDURE
3.1Procedure. The specimens subjected to this test shall be divided into three groups of approximately equal size. a. The first group shall be exposed to the solution specified in 2.1a.
The solution shall be maintained at a temperature of 25°C ±5°C. The specimens shall be completely immersed for 3 minutes +0.5, -0 minutes in the specified solution contained in the vessel specified in 2.2. Immediately following immersion, each specimen shall be tested as follows: The bristle portion of the brush, specified in 2.3, shall be dipped in the solution until wetted and the specimen shall be brushed with normal hand pressure (approximately 2 to 3 ounce force applied normal to the surface) for ten strokes on the portion of the specimen where marking has been applied. The brush stroke shall be directed in a forward direction across the surface of the specimen being tested. Immediately after brushing, the procedure shall be repeated two more times, for a total of three immersions, followed by brushing. After completion of the third immersion and brushing, the specimens shall be air-blown dry. The specimens shall be inspected in accordance with 4.1 and 4.2 to determine the extent, if any, of deterioration that has occurred.
b.This solvent solution has been deleted.
c.The second group shall be exposed to the solution specified in 2.1c.
The solution shall be maintained at a temperature of 25°C ±5°C. The specimens shall be completely immersed for 3 minutes +0.5, -0 minutes in the specified solution contained in the vessel specified in 2.2. Immediately following immersion, each specimen shall be tested as follows: The bristle portion of the brush, specified in 2.3, shall be dipped in the solution until wetted and the specimen shall be brushed with normal hand pressure (approximately 2 to 3 ounce force applied normal to the surface) for ten strokes on the portion of the specimen where marking has been applied. The brush stroke shall be directed in a forward direction across the surface of the specimen being tested. Immediately after brushing, the procedure shall be repeated two more times, for a total of three immersions, followed by brushing. After completion of the third immersion and brushing, the specimens shall be rinsed in approximately 25°C water and all surfaces air-blown dry. The specimens shall be inspected in accordance with 4.1 and 4.2 to determine the extent, if any, of deterioration that has occurred.
d. The third group shall be exposed to the solution specified in 2.1d.
The solution shall be maintained at a temperature of 63°C to 70°C. The specimens shall be completely immersed for 3 minutes +0.5, -0 minutes in the specified solution contained in the vessel specified in 2.2. Immediately following immersion, each specimen shall be tested as follows: The bristle portion of the brush, specified in 2.3, shall be dipped in the solution until wetted and the specimen shall be brushed with normal hand pressure (approximately 2 to 3 ounce force applied normal to the surface) for ten strokes on the portion of the specimen where marking has been applied. The brush stroke shall be directed in a forward direction across the surface of the specimen being tested. Immediately after brushing, the procedure shall be repeated two more times, for a total of three immersions, followed by brushing. After completion of the third immersion and brushing, the specimens shall be rinsed in approximately 25°C water and all surfaces air-blown dry. The specimens shall be inspected in accordance with 4.1 and 4.2 to determine the extent, if any, of deterioration that has occurred.
METHOD 215K
8 February 2002
2