

vk.com/id446425943
Equities: Probing what is cheap and why
Global Macro Strategy 19 November 2018 |
41 |

vk.com/id446425943
Briefing
•There are spells of time when EM is cheap enough and the international context is changing in a manner that EM becomes a passive buy and hold. This is not such a time.
•The sectors in which EM's long-term strength lies – consumer, IT, health care and financials – are all seeing earnings downgrades. We expect these downgrades to end at some point in Q2 next year, when EM's sequential growth should bottom. Our EM Cycle Index helps to identify this turning point more precisely.
•As a style, we prefer Growth over Value in EM for the long haul, but in the coming months expect strong earnings downgrades in the Growth sectors, and therefore go into 2019 long Value vs Growth.
•China's stimulus is likely to be more modest and of a different nature from previous downturns. Although China will stabilise its own economy, the EPS pass-through to the rest of EM is likely to be much more limited.
•By country, we recommend being overweight China, Indonesia and Brazil; we are less enthusiastic about India, Malaysia and South Africa.
•The pressure on EM may not increase sharply, but it should sustain. We expect a total return of 7–8% on MSCI EM next year – significantly better than in 2018 – but not sufficient to undo its post-2017 losses.
Figure 82: Annualised total return vs volatility since 2011
14 |
|
Total return (%, |
|
|
|
|
|
|
|
|
|
|
|
annualised, since |
|
|
|
|
|
MSCI US |
|
|
|
||
|
|
|
|
|
|
|
|
|
|
|||
12 |
|
2011) |
|
|
|
|
|
|
|
|
|
|
|
|
|
|
|
|
|
|
|
|
|
||
|
|
|
|
|
|
|
|
|
|
|
|
|
10 |
|
|
|
|
|
|
|
|
|
|
|
|
|
|
|
|
|
|
|
MSCI World |
|
|
|
||
8 |
|
|
|
|
|
|
|
|
|
|
||
|
|
|
|
|
|
|
|
|
|
|
|
|
|
|
US HY |
|
|
|
|
|
MSCI Japan |
|
|
||
6 |
|
|
|
|
|
|
|
|
|
|||
|
|
|
|
|
|
|
|
|
|
|||
|
EMBI GD |
|
|
|
|
|
|
|
|
|
|
|
|
|
|
|
|
|
|
|
|
|
|
|
|
4 |
|
|
UST |
US IG |
|
|
|
|
|
MSCI Europe |
|
|
|
|
|
|
|
|
|
|
|
|
|
||
2 |
|
|
|
|
|
|
|
|
|
|
|
|
|
|
|
|
|
|
|
|
|
|
|
|
|
|
|
|
|
|
|
|
|
MSCI EM |
|
|
||
0 |
|
|
|
|
|
|
|
|
|
|
||
|
|
|
|
|
GBI-EM |
|
|
|
|
|
|
|
|
|
|
|
|
|
|
|
|
|
|
|
|
-2 |
|
|
|
|
|
|
|
|
|
|
|
|
|
|
|
|
|
|
|
|
|
|
|
|
|
0 |
2 |
4 |
6 |
8 |
10 |
12 |
14 |
16 |
18 |
20 |
||
Volatility (%, annualised, since 2011)
Source: Bloomberg, MSCI, Datastream, UBS
Note: The calculations are based on daily data.
EM's reputation as an asset did not improve in 2018. The narrative of superior returns for higher risk is being challenged (Figure 82) in a world in which the premium of EM growth over that of DM has shrunk close to the lowest levels in 20 years. GDP growth does not equate to equity returns, but earnings growth is not coming through consistently either. EM earnings have been treading water in the post-crisis era since late-2010, compared with a 40%+ EPS expansion in DM, which implies a healthy 5% CAGR. Therefore this is an asset class for a strong active manager; one has to pick the right style, the right sector and, most importantly, the right stocks. There are spells of time, typically when very strong China growth and a dovish Fed coincide, through which a 'buy and hold' ETF strategy works very well in EM. However, 2019 is not lining up to be one of them.
With a subpar overall risk-return profile, EM has become a stockpicker's market
Global Macro Strategy 19 November 2018 |
42 |
vk.com/id446425943
The 'where and how' of EM being cheap – taking a lens to EM multiples
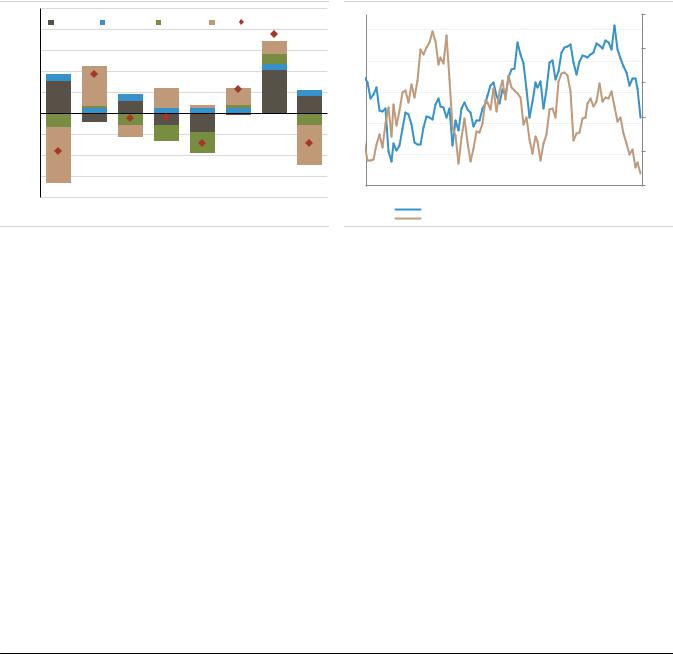
The de-rating of multiples has made, by far, the largest negative contribution to EM total return this year (Figure 83). The MSCI EM 12-month forward P/E ratio fell from over 13x in January to 10-11x times in recent weeks, below its long-term average. EM's valuation discount to DM has widened further, with relative P/BV falling to the bottom decile of its long-term distribution (Figure 85).
It is notable, however, that this de-rating has been in line with what would have been expected in the context of the rise in local currency bond yields and credit spreads (Figure 84). We do not see any additional risk premium being priced on future earnings volatility or trade tariffs. In other words, the higher EM cost of equity – experienced when bond and credit prices fall – has pulled EM valuations lower. Valuations cheaper than historical averages do not in themselves imply an imminent re-rating. It is important to establish what fundamentally drives valuations in EM, and where exactly EM's cheapness lies.
EM valuation de-rating has been in line with rising bond yields and spreads; we see limited scope for re-rating next year
Figure 83: EM yearly total returns in USD terms |
Figure 84: EM equity valuations vs cost of capital |
50% |
|
|
|
|
|
|
|
|
|
|
|
|
|
|
|
3.0 |
|
Earnings |
|
Dividends |
Currency |
P/E |
Total return (USD) |
|
|
|
|
|
|
|
|||
40% |
|
13 |
|
|
|
|
|
|
|
|||||||
|
|
|
|
|
|
|
|
|
|
|
|
|
|
|
||
30% |
|
|
|
|
|
|
|
|
12 |
|
|
|
|
|
|
3.5 |
20% |
|
|
|
|
|
|
|
|
|
|
|
|
|
|
|
|
|
|
|
|
|
|
|
|
|
|
|
|
|
|
|
|
|
10% |
|
|
|
|
|
|
|
|
11 |
|
|
|
|
|
|
4.0 |
|
|
|
|
|
|
|
|
|
|
|
|
|
|
|
||
0% |
|
|
|
|
|
|
|
|
10 |
|
|
|
|
|
|
4.5 |
|
|
|
|
|
|
|
|
|
|
|
|
|
|
|
||
|
|
|
|
|
|
|
|
|
|
|
|
|
|
|
|
|
-10% |
|
|
|
|
|
|
|
|
|
|
|
|
|
|
|
|
-20% |
|
|
|
|
|
|
|
|
9 |
|
|
|
|
|
|
5.0 |
|
|
|
|
|
|
|
|
|
|
|
|
|
|
|
||
-30% |
|
|
|
|
|
|
|
|
|
|
|
|
Correlation: -0.62 |
|
||
|
|
|
|
|
|
|
|
8 |
|
|
|
|
|
|
5.5 |
|
|
|
|
|
|
|
|
|
|
|
|
|
|
|
|
||
-40% |
|
|
|
|
|
|
|
|
11 |
12 |
13 |
14 |
15 |
16 |
17 |
18 |
|
11 |
12 |
13 |
14 |
15 |
16 |
17 |
YTD |
|
|
MSCI EM: 12m fwd P/E |
|
|
|
||
|
|
|
|
|
|
|
|
|
|
|
10y UST+10y CDS (RHS, inverted, MSCI-weighted) |
|||||
Source: MSCI, Datastream, UBS |
|
|
|
|
|
Source: IBES, MSCI, Datastream, UBS |
|
|
|
|
||||||
It is largely EM Value sectors, such as materials, energy, financials and utilities that are cheap relative to DM (Figure 86). Growth-overweight sectors – consumer discretionary, consumer staples and health care – still screen as expensive relative to DM. As we show later in this section, it does not help that these expensive Growth sectors, are precisely the ones that are facing larger earnings downgrades.
EM Value sectors cheapened relative to DM, but Growthoverweight sectors still look expensive
Global Macro Strategy 19 November 2018 |
43 |

vk.com/id446425943
Figure 85: MSCI EM forward P/E and trailing P/BV premium over MSCI World (DM)
Figure 86: Percentile of 12m fwd P/E relative to MSCI World (since 2002) vs proportion of Value stocks in sector
20% |
|
|
|
|
|
|
|
|
|
|
|
|
|
|
|
|
100% |
12m fwd P/E |
|
|
|
|
|
|
|
|
|
|
|
|
|
|
|
|
|
|
|
|
|
|
|
|
|
|
|
|
|||
10% |
|
|
|
|
|
|
|
|
|
|
|
|
|
|
Current |
90% |
relative to |
|
|
|
|
|
||
|
|
|
|
|
|
|
|
|
|
|
|
|
|
|
DM |
HTC |
|
|
|
|
||||
|
|
|
|
|
|
|
|
|
|
|
|
|
EM/DM P/E |
|
|
|
|
|
||||||
|
|
|
|
|
|
|
|
|
|
|
|
|
|
|
(percentile |
|
|
TEL |
|
|||||
0% |
|
|
|
|
|
|
|
|
|
|
|
|
|
premium at |
80% |
CST |
|
|
||||||
|
|
|
|
|
|
|
|
|
|
|
|
|
since 2002) |
|
|
|
|
|||||||
|
|
|
|
|
|
|
|
|
|
|
|
|
|
|
33th |
70% |
|
|
CDS |
|
|
|
|
|
-10% |
|
|
|
|
|
|
|
|
|
|
|
|
|
|
percentile |
|
|
|
|
|
|
|||
|
|
|
|
|
|
|
|
|
|
|
|
|
|
|
|
|
|
|
|
|
||||
|
|
|
|
|
|
|
|
|
|
|
|
|
|
|
|
|
|
|
|
|
|
|
|
|
-20% |
|
|
|
|
|
|
|
|
|
|
|
|
|
|
|
|
60% |
|
|
|
|
|
|
|
|
|
|
|
|
|
|
|
|
|
|
|
|
|
|
|
50% |
|
|
|
|
|
|
|
|
|
|
|
|
|
|
|
|
|
|
|
|
|
|
|
|
|
|
|
|
|
|
|
|
|
-30% |
|
|
|
|
|
|
|
|
|
|
|
|
|
|
|
|
40% |
|
|
|
|
ENE |
UTL |
|
-40% |
|
|
|
|
|
|
|
|
|
|
|
|
|
|
Current |
30% |
|
ITS |
EM |
|
MAT |
FIN |
|
|
|
|
|
|
|
|
|
|
|
|
|
|
|
|
EM/DM P/BV |
|
|
IND |
|
|
|||||
|
|
|
|
|
|
|
|
|
|
|
|
|
|
20% |
|
|
|
|
|
|||||
-50% |
|
|
|
|
|
|
|
|
|
|
|
|
|
premium at |
|
|
|
|
|
|
||||
|
|
|
|
|
|
|
|
|
|
|
|
|
|
|
|
|
|
|
|
|||||
|
|
|
|
|
|
|
|
|
|
|
|
|
|
8th |
|
|
|
|
|
|
|
|
||
|
|
|
|
|
|
|
|
|
|
|
|
|
|
|
10% |
|
|
|
REL |
|
|
|
||
-60% |
|
|
|
|
|
|
|
|
|
|
|
|
|
percentile |
|
|
|
|
|
|
||||
|
|
|
|
|
|
|
|
|
|
|
|
|
0% |
|
|
|
|
|
|
|
||||
02 |
03 |
04 |
05 |
06 |
07 |
08 |
09 |
10 |
11 |
12 |
13 |
14 |
15 |
16 |
17 |
18 |
0% |
20% |
40% |
60% |
80% |
100% |
||
|
|
EM/DM P/E premium |
|
|
|
|
Average |
|
|
|
|
|||||||||||||
|
|
|
|
|
|
|
|
|
|
|
Proportion of Value stocks in sector |
|
|
|||||||||||
|
|
EM/DM P/BV premium |
|
|
|
|
Average |
|
|
|
|
|
|
|
||||||||||
Source: IBES, MSCI, Datastream, UBS |
|
|
|
|
|
|
|
|
|
Source: IBES, MSCI, Datastream, UBS |
|
|
|
|
||||||||||
In this report, we introduce a regression model for the MSCI EM 12-month forward P/E ratio (Figure 87). There are three explanatory variables in this model:
9m change in long-term MSCI EM EPS growth forecast.
12m change in macro balance sheet risk score (see pages 12–15 in our quarterly EM Navigator report published on 30 June 2017).
EM CDS spread – an MSCI-EM weighted average of the CDS spreads for major EM economies.
Our base-case scenario in Figure 87 assumes an MSCI EM valuation re-rating to 11x on 12-month forward P/E in 2019 from 10.5x currently. Our optimistic scenario assumes a bigger re-rating to 12.3x, which is in line with its 2017 average. The pessimistic scenario points to P/E valuations of approximately 10x, which is marginally below current levels (Figure 88).
A new top-down model for MSCI EM 12-month forward P/E
Our base case assumes re-rating to 11x on a 12-month forward P/E basis from just over 10x now
Figure 87: MSCI EM 12m forward P/E: Base case, upside and downside scenarios
2018E |
2019E |
Downside |
Base Case |
Upside |
9m change in long-term MSCI |
-5.0 |
-5.0 |
|
-1.5 |
|
2.0 |
|
|
EM EPS growth forecast |
|
|
|
|||||
|
|
|
|
|
|
|
|
|
12m change in MBS risk score |
0.1 |
0.2 |
|
|
0.1 |
|
-0.1 |
|
|
|
|
|
|
|
|
|
|
EM CDS spread |
147.9 |
200.0 |
|
160.0 |
|
125.0 |
|
|
12m forward P/E |
10.6 |
10.0 |
11.0 |
12.3 |
Source: Bloomberg, Haver, IBES, MSCI, Datastream, UBS |
|
|
||
Figure 88: Actual, fitted and residual of our forward P/E model
13.5 |
|
2.0 |
13.0 |
|
1.5 |
12.5 |
|
1.0 |
|
|
|
12.0 |
|
0.5 |
|
|
|
11.5 |
|
0.0 |
11.0 |
|
|
|
|
|
10.5 |
|
-0.5 |
|
|
|
10.0 |
|
-1.0 |
|
|
|
9.5 |
|
-1.5 |
9.0 |
|
-2.0 |
Jan-12 Jan-13 Jan-14 Jan-15 |
Jan-16 Jan-17 Jan-18 |
|
Residual (RHS) |
Actual |
Fitted |
Source: Bloomberg, Haver, IBES, MSCI, Datastream, UBS
Global Macro Strategy 19 November 2018 |
44 |