


vk.com/id446425943
Box 2: How far are we from capitulation in EM equities?
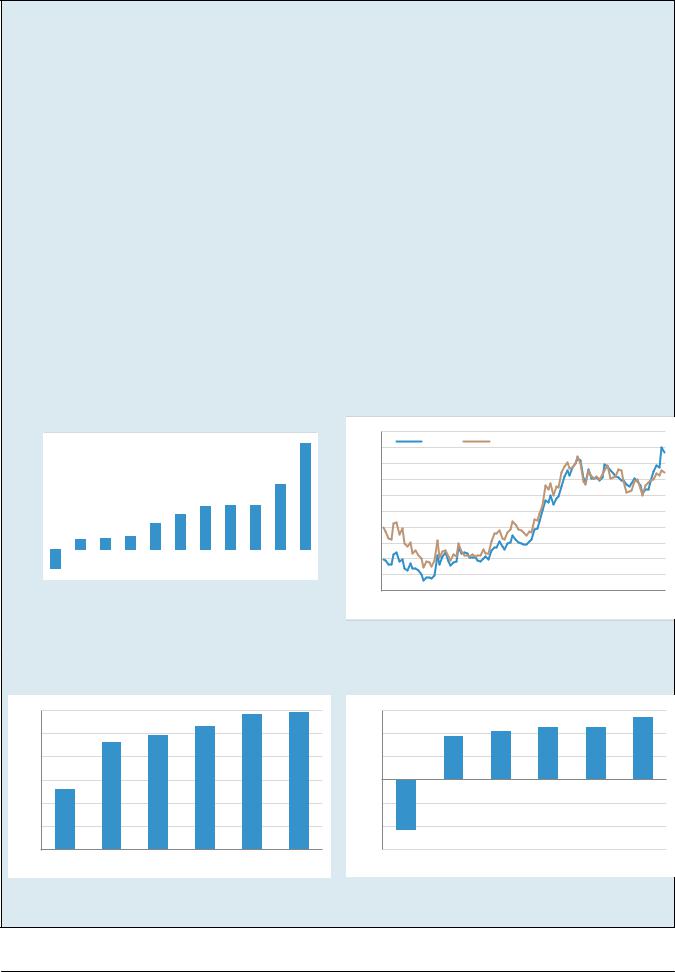
To answer this, we work with our Quant team's data on investor positioning and assess several sentiment indicators. Figure 28 shows the evolution of the active weight, defined as the difference between the actual weight of each stock in investor portfolios and its weight in the MSCI EM benchmark, for the 25 most overweight stocks as of the recent market peak. We track this active weight in the ±12m period around market peaks (which we call 0m) over the past 15 years. We normalise the active weight to zero at 0m (i.e. at each market peak). Unlike previous episodes of market weakness, investors have added a further 2.70 pp through this year to their biggest overweight positions as of the early 2018 market peak. Prices have come lower, but the pattern of positioning has not changed. Investors have not had to sell in distress, probably because flows into the asset class have not yet been compromised. This, in turn, is very likely because US financial conditions, an important driver for flows into EM, have not tightened yet.
Figure 28: Active weight deviation of the top-25 EM stocks from the level at market peak
4pp |
|
|
|
|
|
|
|
|
|
|
|
|
|
|
|
|
|
|
|
2pp |
|
|
|
|
|
|
|
|
|
|
|
|
|
|
|
|
|
|
|
0pp |
|
|
|
|
|
|
|
|
|
|
|
|
|
|
|
|
|
|
|
-2pp |
|
|
|
|
|
|
|
|
|
|
|
|
|
|
|
|
|
|
|
-4pp |
|
|
|
|
|
|
|
|
|
|
|
|
|
|
|
|
|
|
|
-6pp |
|
|
|
|
|
|
|
|
|
|
|
|
|
|
|
|
|
|
|
-8pp |
|
|
|
|
|
|
|
|
|
|
|
|
|
|
|
|
|
|
|
-12m -11m -10m -9m -8m |
-7m |
-6m |
-5m |
-4m |
-3m |
-2m |
-1m |
0m |
1m |
2m |
3m |
4m |
5m |
6m |
7m |
8m |
9m |
10m 11m |
12m |
12-Apr-04 |
|
|
08-May-06 |
|
|
|
29-Oct-07 |
|
|
|
19-May-08 |
|
|
|
04-Nov-08 |
|
|||
06-Jan-09 |
|
|
02-May-11 |
|
|
|
28-Apr-15 |
|
|
|
23-Oct-15 |
|
|
|
26-Jan-18 |
|
|||
Source: FactSet, MSCI, UBS Quantitative Research
Note: Active weight is normalised to zero at t=0m, which corresponds to each prior market peak.
In Figure 29 we show the values of nine metrics designed to assess investor sentiment towards EM. We show their values at a) the previous MSCI EM trough (21 January 2016), b) the recent peak (26 January 2018), and c) the latest levels. The last column calculates the percentage 'improvement' in EM sentiment through the last rally (since the January 2016 trough to the January 2018 peak) that has already been given back this year. For example, in the first row, 'Cumulative EM equity fund flow (3m, USD bn): the trough-to-peak 'improvement' was USD41.6bn (USD26.6bn minus -USD15.0bn); the subsequent 'retreat' has been USD17.3bn (USD26.6bn minus USD9.3bn); the ratio of the 'retreat' to ‘improvement' is 42% (USD17.3bn divided by USD41.6bn). In aggregate, sentiment has retreated nearly two-thirds from the market peak earlier this year towards the 2016 market trough. Strong commodity prices have helped earnings expectations stay high, otherwise this measure would probably indicate an even greater degree of reversal in the bullish sentiment.
The message from these two indicators seems to be that sentiment has turned a long way, but in a 'slow-bleed' manner that has prevented catharsis. There has been no distress that compels a big clear-out from consensus (Growth) stocks.
Figure 29: Indicators of investor sentiment towards EM
|
|
MSCI EM trough |
|
MSCI EM peak |
|
Current: 15 Nov 18 |
|
% Retreat from 2018 market |
|
|
|
|
|
|
|
|
|
||||
|
|
(21 Jan 16) |
|
(26 Jan 18) |
|
|
peak to 2016 trough |
|
|
|
|
|
|
|
|
|
|
|
|||
|
|
|
|
|
|
|
|
|
|
|
Cumulative EM equity fund flow (3m, $bn) |
|
-15.03 |
|
+26.60 |
|
+9.27 |
|
42% |
|
|
EMBI+ spread v. US 10-year yields (bp) |
|
466 |
|
317 |
|
419 |
|
69% |
|
|
CRB Index (3m % chg) |
|
-18.6% |
|
8.2% |
|
-0.2% |
|
31% |
|
|
12m forward P/E |
|
10.1x |
|
13.4x |
|
10.5x |
|
88% |
|
|
12m forward EPS growth |
|
+7.68% |
|
+13.23% |
|
+10.70 |
|
46% |
|
|
3m revisions in 12m forward earnings |
|
-3.86% |
|
+1.78% |
|
-2.38% |
|
74% |
|
|
% of MSCI EM stocks > 250 day MA |
|
22% |
|
84% |
|
16% |
|
109% |
|
|
Normalised EM FX volatility |
|
1.67 |
|
1.08 |
|
1.34 |
|
45% |
|
|
MSCI EM volatility (90 days) |
|
18.71% |
|
9.87% |
|
17.05% |
|
81% |
|
|
Average |
|
|
|
|
|
|
|
65% |
|
|
|
|
|
|
|
|
|
|
|
|
|
Source: EPFR Global, IBES, MSCI, Datastream, Bloomberg, UBS
Bhanu Baweja and Alexey Ostapchuk
Global Macro Strategy 19 November 2018 |
17 |
vk.com/id446425943
Box 3: How can investors overcome EM's weakest link – currencies?
We have long argued that EM currencies are the most problematic part of the EM asset spectrum. They have fundamentally compromised value in this asset class. In local-currency terms, the MSCI EM total return over the past five years is 30%, but in USD terms this drops to 7.8% (Figure 30). While currency performance hugely impacted total return in equities, in local debt it was pretty much the only thing that mattered, leading to negative returns over the past five years.
The good news is that this currency risk can be hedged to improve Sharpe ratios by a factor of 2–3x, or more, by funding EM positions in currencies that a) mimic EM spot moves, b) do not cost much to hedge in, and c) have abundant liquidity.
Our analysis suggests that funding in AUD, CAD and GBP is the best way of dealing with EM's currency weakness, and maximising long-term Sharpe ratios. These cheap funders are driven by roughly the same factors as the broad EM return pattern: global growth and commodity prices. The AUD and CAD, in particular, fit this profile very closely (Figure 31). Sensitivity to commodities also applies to EM's oil and metal exporters – RUB, ZAR and BRL, etc. – but the hedging cost (not to mention lower liquidity) means that the improvement in Sharpe ratios is much lower than funding in AUD or CAD (Figure 32 and Figure 33).
Our preferred hedges account for beta, not alpha risk. In other words, the position will do much better in a slowing global economy, particularly one led by China and lower commodity prices, or in a higher US rates and strong USD environment, but will not be able to protect against local political flare ups or bad policy. However, we believe idiosyncratic risk is overstated, and that the interplay between China growth and US rates has a profound impact on EM assets.
In EM Navigator: How to overcome EM's weakest link, we discuss this hedging thesis, and the results of our analysis, by country and sector in detail.
Figure 30: 5-year total returns across asset classes (nonannualised) : USD funded EM returns have been weak
Figure 31: EM currencies and an equal-weighted index of AUD and CAD vs USD: Common drivers
|
80% |
|
|
|
5y total return |
|
|
|
|
|
|
|
|
|
|
|
|
73% |
|
||||||
|
|
|
|
|
|
|
|
|
|
|
|
|
|
|
|
|
|||||||||
|
60% |
|
|
|
|
|
|
|
|
|
|
|
|
|
|
|
|
|
|
|
|||||
|
|
|
|
|
|
|
|
|
|
|
|
|
|
|
|
|
|
|
|
||||||
|
|
|
|
|
|
|
|
|
|
|
|
|
|
|
|
|
|
|
|
|
|
|
|
|
|
|
|
|
|
|
|
|
|
|
|
|
|
|
|
|
|
|
|
44% |
|
|
|
|
|||
|
|
|
|
|
|
|
|
|
|
|
|
|
|
|
|
|
|
|
|
|
|
|
|||
|
40% |
|
|
|
|
|
|
|
|
|
|
|
|
|
|
|
|
|
|
|
|
|
|
|
|
|
|
|
|
|
|
24% |
30% |
30% |
30% |
|
|
|
|
|
|
|
|||||||||
|
|
|
|
|
|
|
|
|
|
|
|
|
|
||||||||||||
|
|
|
|
|
|
|
|
|
|
|
|
|
|
|
|
|
|
|
|
|
|
|
|||
|
20% |
|
|
|
|
18% |
|
|
|
|
|
|
|
|
|
|
|
|
|
|
|
|
|
|
|
|
|
|
|
|
|
|
|
|
|
|
|
|
|
|
|
|
|
|
|
|
|
|
|
|
|
|
7% |
8% |
9% |
|
|
|
|
|
|
|
|
|
|
|
|
|
|
|
|
|
|
|
|
||
|
|
|
|
|
|
|
|
|
|
|
|
|
|
|
|
|
|
|
|
|
|
||||
|
0% |
|
|
|
|
|
|
|
|
|
|
|
|
|
|
|
|
|
|
|
|
|
|
|
|
|
-13% |
|
|
|
|
|
|
|
|
|
|
|
|
|
|
|
|
|
|
|
|
|
|
|
|
|
-20% |
|
|
|
|
|
|
|
|
|
|
|
|
|
|
|
|
|
|
|
|
|
|
|
|
|
EM UST ($) |
MSCI |
|
MSCI |
US IG |
EM hard |
USHY |
MSCI |
MSCI |
MSCI |
MSCI US |
|
|||||||||||||
|
|
|
|||||||||||||||||||||||
|
|
Local |
EM ($) |
Europe |
($) |
currency |
($) |
|
EM (LC) |
Japan |
World |
($) |
|
|
|||||||||||
|
|
currency |
|
($) |
|
debt ($) |
|
|
|
|
|
|
($) |
|
($) |
|
|
|
|
|
|||||
|
|
debt ($) |
|
|
|
|
|
|
|
|
|
|
|
|
|
|
|
|
|
|
|
|
|
|
|
|
|
|
|
|
|
|
|
|
|
|
|
|
|
|
|
|
|
|
|
|
|
|
|
|
|
|
|
|
|
|
|
|
|
|
|
|
|
|
|
|
|
|
|
|
|
|
|
|
|
|
|
Source: MSCI, Bloomberg, Datastream, UBS
110 |
|
USDEM |
|
Equal-weighted USDAUD and USDCAD |
|||||
105 |
|
|
|||||||
|
|
|
|
|
|
|
|
|
|
100 |
|
|
|
|
|
|
|
|
|
95 |
|
|
|
|
|
|
|
|
|
90 |
|
|
|
|
|
|
|
|
|
85 |
Dec 2015 =100 |
|
|
|
|
|
|
||
|
|
|
|
|
|
|
|
|
|
80 |
|
|
|
|
|
|
|
|
|
75 |
|
|
|
|
|
|
|
|
|
70 |
|
|
|
|
|
|
|
|
|
65 |
|
|
|
|
|
|
|
|
|
60 |
|
|
|
|
|
|
|
|
|
2010 |
2011 |
2012 |
2013 |
2014 |
2015 |
2016 |
2017 |
2018 |
|
Source: Bloomberg, UBS. Note: USDEM is based on a simple average of spot returns on 20 EM currencies vs USD.
Figure 32: Five-year Sharpe ratios for MSCI EM funded in different currencies
0.6 |
|
|
|
|
|
0.5 |
|
|
|
|
|
0.4 |
|
|
|
|
|
0.3 |
|
|
|
|
|
0.2 |
|
|
|
|
|
0.1 |
|
|
|
|
|
0.0 |
|
|
|
|
|
USD |
JPY |
EUR |
GBP |
AUD |
CAD |
Source: MSCI, Datastream, UBS. Note: Based on weekly total returns.
Figure 33: Five-year Sharpe ratios for GBI EM funded in different currencies
0.3 |
|
|
|
|
|
0.2 |
|
|
|
|
|
0.1 |
|
|
|
|
|
0.0 |
|
|
|
|
|
-0.1 |
|
|
|
|
|
-0.2 |
|
|
|
|
|
-0.3 |
|
|
|
|
|
USD |
JPY |
EUR |
GBP |
AUD |
CAD |
Source: Datastream, UBS. Note: Based on weekly total returns.
Bhanu Baweja
Global Macro Strategy 19 November 2018 |
18 |

vk.com/id446425943
Figure 34: EM export growth y/y vs EM nominal effective exchange rate (MSCI EM weighted) y/y
40 |
|
|
|
|
|
|
10 |
30 |
|
|
|
|
|
|
|
20 |
|
|
|
|
|
|
5 |
|
|
|
|
|
|
|
|
10 |
|
|
|
|
|
|
0 |
|
|
|
|
|
|
|
|
0 |
|
|
|
|
|
|
|
-10 |
|
|
|
|
|
|
-5 |
|
|
|
|
|
|
|
|
-20 |
|
|
|
|
|
|
-10 |
|
|
|
|
|
|
|
|
-30 |
|
|
EM export value growth (% y/y) |
|
|||
|
|
|
|
||||
-40 |
|
|
EM NEER (% y/y, rhs) |
|
-15 |
||
|
|
|
|
|
|
||
97 |
00 |
03 |
06 |
09 |
12 |
15 |
18 |
Source: Haver, UBS. EM aggregates are based on a simple average for 19 countries.
Figure 35: EM FX cross-country dispersion of returns
15%
Dispersion of returns (Equal-weighted)
China deval
13% GFC
11% |
Taper |
|
tantrum |
9% |
|
7%
5%
3%
06 |
08 |
10 |
12 |
14 |
16 |
18 |
Source: Haver, UBS. Cross-country dispersion is based on y/y returns on NEERs of 23 EM currencies.
But at a time like this, when dispersion among EM currencies is higher than at the GFC, taper tantrum, or the CNY weakening episode in 2015 (Figure 35), it is important to examine the aggregates. For most of 2018, the pain has been concentrated in EMEA and LatAm currencies, with volatility in Asian currencies remaining low (Figure 36). As the change in US back-end rates next year is likely to be only 20bp compared with 80bp this year, we believe that on a total-return basis, the high-yielding currencies of the GBI EM debt benchmark are likely to do better than those in the Asia-heavy MSCI EM equity benchmark (Figure 37).
With a lower delta in US yields, EM’s high yielders should yield a better total return; weak trade and CNY to sustain pressure on Asia
Figure 36: EM FX: Volatility* in 3 regions |
Figure 37: EM FX: GBI-weighted and MSCI-weighted |
2.5 |
Asia |
EMEA |
LatAm |
110 |
|
|
|
|
|
|
|
|
|
EM vs USD (GBI-weighted) |
|
||
|
|
|
|
|
|
|
||
|
|
|
13th |
105 |
|
EM vs USD (MSCI-weighted) |
|
|
2.0 |
|
|
|
|
|
|||
|
|
percentile |
|
|
|
|
||
|
|
|
|
|
|
|
||
1.5 |
|
|
|
100 |
|
|
|
|
|
|
|
|
|
|
|
||
1.0 |
|
|
42nd |
95 |
|
|
-7.9% |
|
|
|
percentile |
|
|
|
|||
|
|
|
|
|
|
|
||
0.5 |
|
|
|
90 |
|
|
|
|
|
|
|
35th percentile |
|
|
|
-10.5% |
|
|
|
|
|
|
|
|
||
0.0 |
|
|
|
85 |
|
|
|
|
Jan-18 |
Apr-18 |
Jul-18 |
Oct-18 |
|
|
|
||
Jan-18 |
Apr-18 |
Jul-18 |
Oct-18 |
|||||
|
|
|
|
Source: Bloomberg. UBS. Note: Aggregates are equally weighted and volatility |
Source: Bloomberg, UBS |
based on 90 days’ daily return. |
|
EM fixed income: Heading into 2019 on a defensive note, but local debt to outperform through the year
The asset class where valuations have genuinely become attractive is local duration. The spread between GBI-weighted EM yields and an average of US and Europe (G2) yields is at the 93rd percentile of its post-crisis distribution in nominal terms, and at the 91st percentile in real terms (Figure 38). There is enough cushion at EM back ends to withstand a modest repricing of the US curve. To be fair, credit spreads have also driven a repricing in local debt, and these are unlikely to drop aggressively, but lower currency volatility amid a better-priced Fed should help.
High real rates, steep curves make EM duration attractive
Global Macro Strategy 19 November 2018 |
19 |

vk.com/id446425943
Figure 38: EM real yields relative to G2 real yields*
3.8 |
EM spread to G2 (ex Turkey) |
|
|
|
Latest: 96%ile |
||
3.3 |
EM (ex turkey, GBI-weighted) |
||
|
|||
2.8 |
G2 real yields |
Latest: 91%ile |
|
|
|||
|
|
||
2.3 |
|
|
|
1.8 |
|
|
|
1.3 |
|
|
|
0.8 |
|
Latest: 83%ile |
|
0.3 |
|
||
|
|
||
(0.2) |
|
|
|
(0.7) |
|
|
|
Jan-11 |
Jan-12 Jan-13 Jan-14 Jan-15 Jan-16 Jan-17 Jan-18 |
||
Source: Bloomberg, UBS *Based on 36-month exponential headline inflation.
Figure 39: 2018 YTD total return attribution for GBI EM
25% |
|
|
Coupon |
|
Price |
Spot FX |
Total return |
|
|
|
|
|
|
|
|
|
|||||
20% |
|
|
|
|
|
|
|
|
|
|
15% |
|
|
|
|
|
|
|
|
|
|
10% |
|
|
|
|
|
|
|
|
|
|
5% |
|
|
|
|
|
|
|
|
|
|
0% |
|
|
|
|
|
|
|
|
|
|
-5% |
|
|
|
|
|
|
|
|
|
|
-10% |
|
|
|
|
|
|
|
|
|
|
-15% |
|
|
|
|
|
|
|
|
|
|
-20% |
|
|
|
|
|
|
|
|
|
|
-25% |
|
|
|
|
|
|
|
|
|
|
08 |
09 |
10 |
11 |
12 |
13 |
14 |
15 |
16 |
17 |
YTD |
Source: Datastream, UBS
Just the yield spread over developed market debt should make for decent total returns in local currency debt next year. However, currencies have always made or broken this asset class; so far in 2018, currencies have given a negative performance of 8.7%, which has made for a total return of -7.6% (Figure 39). But the lower delta at the US back end next year will make all the difference for the performance of both currencies and duration. As such, we expect relative stability for GBI-weighted EM currencies against the USD next year. As a base case, we estimate total returns for GBI EM in the range of around 5-6% next year. Similar to EM equities and broader FX, these returns will likely be backloaded in 2019.
Valuations have also adjusted considerably in EM credit, especially relative to US and European HY markets. However, the valuation gap is driven more by a narrower set of countries – Venezuela, Argentina, Turkey and Lebanon – which has explained nearly 35% of the year-to-date widening in spreads. Spreads in most other major credit markets remain relatively tight (Figure 40).
Figure 40: Percentiles of EMBI spreads in 5y distributions
100%
90%  5y percentile of top-20 countries by weight
80%
70%
60%
50%
40%
30%
20%
10%
0%
Lebanon |
Mexico |
Turkey |
China |
SouthAfrica |
Argentina |
Ecuador |
Chile |
Colombia |
Philippines |
Russia |
Peru |
Malaysia |
Indonesia |
Brazil |
Panama |
2 |
|
Source: Datastream, UBS
We expect 5-6% total returns in GBI EM next year; these returns should be back loaded in 2019
2007 2009 2011 2013 2015 2017
Global Macro Strategy 19 November 2018 |
20 |
vk.com/id446425943
Figure 42: EM public debt vs DM public debt (% of GDP) |
Figure 43: EM corporate credit spreads: Rich by about 50bp |
110 |
% of GDP |
|
|
|
|
|
|
|
|
|
|
600 |
|
|
|
|
|
|
180 |
|
|
|
|
|
|
|
|
|
|
|
|
|
|
|
|
|
|
|
|||
|
|
|
DM |
|
EM |
|
|
|
|
|
|
|
550 |
|
Spread (rhs) |
|
Forecast |
|
Actual |
|
100 |
|
|
|
|
|
|
|
|
|
|
|
|
|
|
|
|
|
|
130 |
|
|
|
|
|
|
|
|
|
|
|
|
|
|
|
|
|
|
|
|
||
|
|
|
|
|
|
|
|
|
|
|
|
|
500 |
|
|
|
|
|
|
|
90 |
|
|
|
|
|
|
|
|
|
|
|
|
|
|
|
|
|
|
|
|
|
|
|
|
|
|
|
|
|
|
|
|
|
|
|
|
|
|
|
|
|
80 |
|
|
|
|
|
|
|
|
|
|
|
|
450 |
|
|
|
|
|
|
80 |
|
|
|
|
|
|
|
|
|
|
|
|
400 |
|
|
|
|
|
|
|
|
|
|
|
|
|
|
|
|
|
|
|
|
|
|
|
|
|
|
|
30 |
|
70 |
|
|
|
|
|
|
|
|
|
|
|
|
350 |
|
|
|
|
|
|
|
|
|
|
|
|
|
|
|
|
|
|
|
|
|
|
|
|
|
|
||
|
|
|
|
|
|
|
|
|
|
|
|
|
|
|
|
|
|
|
|
|
60 |
|
|
|
|
|
|
|
|
|
|
|
|
300 |
|
|
|
|
|
|
-20 |
|
|
|
|
|
|
|
|
|
|
|
|
|
|
|
|
|
|
|
||
50 |
|
|
|
|
|
|
|
|
|
|
|
|
250 |
|
|
|
|
|
|
-70 |
|
|
|
|
|
|
|
|
|
|
|
|
|
200 |
|
|
|
|
|
|
|
40 |
|
|
|
|
|
|
|
|
|
|
|
|
|
|
|
|
|
|
|
|
30 |
|
|
|
|
|
|
|
|
|
|
|
|
150 |
|
|
|
|
|
|
-120 |
|
|
|
|
|
|
|
|
|
|
|
|
11 |
12 |
13 |
14 |
15 |
16 |
17 |
18 |
|
|
00 |
02 |
04 |
06 |
08 |
10 |
12 |
14 |
16 |
18 |
20 |
22 |
||||||||
|
|
|
|
|
|
|
|
|
||||||||||||
Source: IMF, Haver, UBS |
|
|
|
|
|
|
|
|
|
Source: Bloomberg, Haver, Datastream |
|
|
|
|
||||||
In the context of weaker growth next year, limited capital inflows and potentially greater pressure on EM’s fiscal positions (Figure 42), our Macro Balance Sheet Risk Score2, the core of our EM credit valuations, is likely to slowly deteriorate towards a level of 10.5-10.6 (Figure 41). Taking a neutral view on global risk appetite and commodity prices, this should be consistent with spreads widening modestly by 20bp next year vs the 68bp widening year to date.
Along with slight drift wider in US rates, this still makes for a total return of about 4% in EM hard currency sovereign debt. In total return terms, this is less than what we are expecting in local currency debt. However, based on our view that a weaker USD and GBI EM stability is likely to be back-loaded in 2019, we go into 2019 with a modest preference for hard over local currency debt.
Corporate spreads, which have widened with a much lower beta to sovereigns in this round of credit weakness than in the past (Figure 43), could be at greater risk next year as energy growth stalls, and USD/CNY volatility, a key input for this asset class, picks up somewhat. We expect a widening of 30-50bp in this asset class, with an expected total return of 3.5%.
A grind wider of 20-30bp in sovereign spreads is the base case; corporate spreads should widen by 30-50bp amid higher USD/CNY volatility
2 Please see pages 12-15 in our quarterly EM Navigator report published on 30 June 2017.
Global Macro Strategy 19 November 2018 |
21 |