

vk.com/id446425943
hedged owing to IDR's overvaluation, and THB's and MYR's moderate undervaluation on our FX FEER valuation metrics (see FX Section for details).
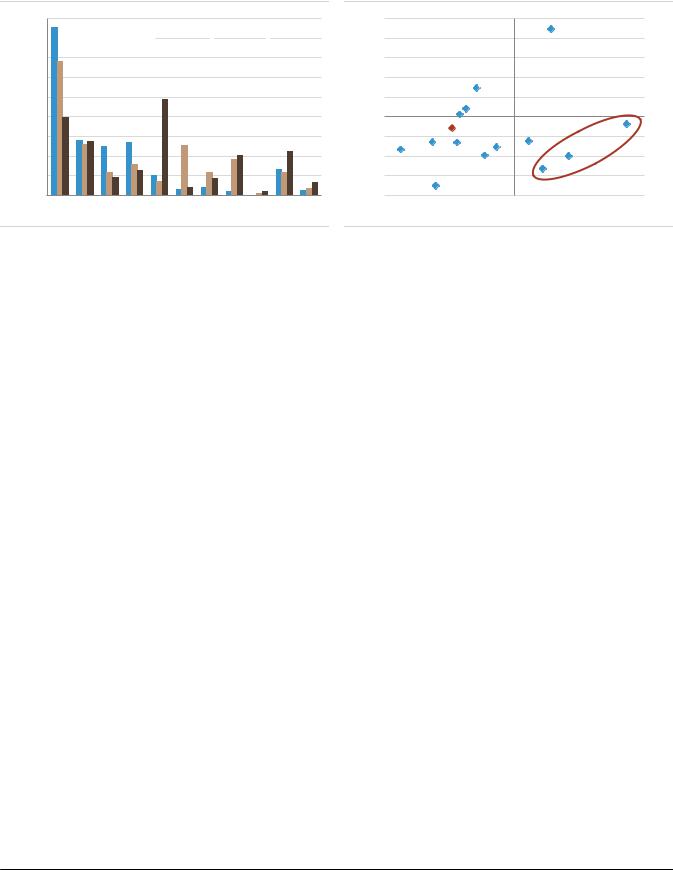
Figure 50: Indonesia, Malaysia and Thailand: sector weights
Figure 51: Percentile of 12m fwd P/E relative to MSCI World (percentile since 2002) vs 6m revisions in 12m fwd EPS
45%
40% 
 Indonesia
  Malaysia
  Thailand
35%
30%
25%
20%
15%
10%
5%
0%
FIN CST CDS TEL ENE UTL HTC IND ITS MAT REL
Source: MSCI, Datastream, UBS
10% |
6m change in |
|
|
|
|
|
|
|
12m forward RU (19%,18%) |
|
|
BZ |
|
||||
8% |
|
EPS |
|
|
|
|
|
|
|
|
|
|
|
|
|
||
|
|
|
|
|
|
|
|
|
6% |
|
Cheap and |
|
|
|
|
|
|
|
|
|
|
|
|
|
|
|
4% |
|
Upgraded |
|
CL |
|
|
|
|
|
|
|
|
|
|
|
|
|
2% |
|
|
|
|
|
|
|
|
0% |
|
|
TW |
MX |
|
|
|
|
|
|
|
|
|
|
|
||
-2% |
|
EM |
|
|
|
|
TH |
|
|
|
PL |
CN |
|
ID |
|
|
|
|
|
TR |
PH |
|
|
|||
-4% |
|
|
ZA |
|
IN |
|
||
|
|
|
|
|
|
|||
-6% |
|
|
|
|
|
|
MY |
|
|
KR |
|
|
|
|
Expensive and |
||
|
|
|
|
|
|
|||
-8% |
|
|
|
|
|
Downgraded |
||
|
|
|
|
|
|
|||
|
|
|
|
|
|
|
|
|
|
0% |
20% |
40% |
|
60% |
80% |
100% |
|
|
|
12m fPE relative to DM (percentile since 2002) |
|
|||||
Source: IBES, MSCI, Datastream, UBS
5. Long G3 currencies vs KRW
The KRW faces three challenges: 1) more cautious fiscal stimulus and slower |
The KRW faces three key |
Chinese growth will dent demand for Korean exports to China for domestic use. In |
challenges |
2017, these exports made up 40% of Korean exports to China and 13% of |
|
exports overall. 2) DRAM prices are likely to fall by 34% (see Box 7) by the end of |
|
2019, which will weigh on Korean tech export values (Figure 52). 3) Global trade |
|
volumes are likely to slow further as global growth slows in 2019. Although Korea |
|
may be able to capture some market share from China, these other issues are likely |
|
to pose greater challenges for Korea's external balance. |
|
The KRW appears resilient to the market challenges of the recent months: trade tensions, deteriorating risk sentiment, ongoing concerns about Chinese growth. This is probably because exports have been solid, perhaps reflecting some front loading ahead of the increase in US tariffs on Chinese goods on 1 January 2019. And owing to notable, sticky, probably unhedged bond inflows. We do not know when the latter will stop, but the broad trade outlook will dent the resilience of exports and, we think, will cause the KRW to weaken (Figure 53). Short KRW vs the G3 captures the trade-weighted challenges that the KRW will face in 2019.
The resilience of the KRW will crack as export growth, softens
Global Macro Strategy 19 November 2018 |
26 |

vk.com/id446425943
Figure 52: A deteriorating tech cycle will weigh on exports.
200 |
(%y/y) |
|
|
|
|
Korean semiconductor exports |
|
||||||
|
|
|
|
|
|
|
|||||||
|
|
|
|
|
|
|
DRAM revenues |
|
|
|
|
||
150 |
|
|
|
|
|
|
|
|
|
|
|
|
UBSe |
|
|
|
|
|
|
|
|
|
|
|
|
|
|
100 |
|
|
|
|
|
|
|
|
|
|
|
|
|
50 |
|
|
|
|
|
|
|
|
|
|
|
|
|
0 |
|
|
|
|
|
|
|
|
|
|
|
|
|
(50) |
|
|
|
|
|
|
|
|
|
|
|
|
|
(100) |
|
|
|
|
|
|
|
|
|
|
|
|
|
|
07 |
08 |
09 |
10 |
11 |
12 |
13 |
14 |
15 |
16 |
17 |
18 |
19 |
Source: Haver, Bloomberg, UBS
6. Long CZK vs ZAR
Figure 53: KRW is sensitive to softening exports
60 |
(%y/y) |
USDKRW |
|
|
|
50 |
|
|
|
|
|
40 |
|
|
|
|
|
30 |
|
|
|
|
|
20 |
|
|
y = -0.5325x + 4.3576 |
|
|
|
|
R² = 0.5295 |
|
|
|
|
|
|
|
|
|
10 |
|
|
|
|
(%y/y) |
|
|
|
|
|
|
0 |
|
|
|
|
|
(10) |
|
|
|
|
|
(20) |
|
|
|
|
|
(30) |
|
|
|
|
Exports |
|
|
|
|
|
|
-50 |
-25 |
0 |
25 |
50 |
75 |
Source: Bloomberg, Haver, UBS estimates
We keep our long exposure to the CZK, one of our top trades in 2017 and 2018. Even though monetary conditions have already tightened after 175bp of rate hikes, and the currency has appreciated, the output gap remains positive, the labour market is tight and inflation remains above target (Figure 54). This backdrop implies the CNB's 'orthodox' tightening will continue in 2019–20. We expect 75bp of rate hikes in the next two years (50bp in 2019 and 25bp in 2020) vs market expectations of 55bp over the same horizon. However, if the currency weakens, the likelihood of more rate hikes than we currently expect increases. In our baseline projections we expect cumulative monetary conditions tightening 275bp through 2020: 75bp via rate hikes and 200bp via FX appreciation (i.e. ~6% CZK/EUR appreciation).
On external sector fundamentals, the surplus on the extended basic balance (external balance + FDI + capital account) should remain stable at around 2.2– 2.4% of GDP in 2018–20. Moreover, foreign investor positioning in the bond market and in deposits has decreased, which in conjunction with a potential rise in interest in CE3 owing to a stronger EUR, could bring additional inflows in the CZK market as well.
In contrast, the ZAR sits in the intersection of impact from a weaker China and a tighter Fed. In 2018, we have seen hope of reform and a moderation in the deficit help the ZAR to some extent, but these tailwinds should slowly fade. Despite our bullish EUR view for 2019, we forecast a mild depreciation of the ZAR/USD to 15.25 for three major reasons: 1) the current-account deficit is likely to worsen in 2019 and 2020; basic balance to remain in a deep deficit -3.9% of GDP (Figure 55). This is why the ZAR stands out as the most overvalued EM FX on our FEER metric (see FX section). 2) Moderating China growth and CNY weakness (UBS forecasts 5.3% weakness in 2019) would weigh on ZAR more than other EM FX. Asia accounts for one-third of South Africa's exports; perhaps, this explains why ZAR has one of the highest betas to CNY across global FX (see Box 5). 3) Potential for portfolio outflow, although foreign positioning in local-currency bond market has also eased somewhat to 39.4% (yet, it is still higher than the 37% average level over the past five years). Note that the upcoming MSCI index rebalancings of Q2/Q3 2019 and the potential inclusion of China in global bond indices could also result in a larger collateral damage for the ZAR (see Box 9).
Long CZK: Positive output gap, a tight labour market and abovetarget inflation should imply further tightening of the monetary conditions by the CNB
Sell ZAR: Deteriorating current account, overvaluation, high beta to CNY weakness and portfolio outflows mean ZAR is likely to underperform EM FX in 2019
Global Macro Strategy 19 November 2018 |
27 |

vk.com/id446425943
Figure 54: CZK: tight labour markets, rising unit labour costs
Figure 55: South Africa basic balance (% of GDP)
9.5% |
|
|
|
|
|
|
|
|
|
|
|
|
|
|
|
76 |
6% |
% of GDP, 4q |
|
|
|
|
net FDI (% of GDP) |
|
|
|||||||
|
|
|
Unit Labor Cost (4-qtr %change) |
|
|
|
|
|
|
|
|
|
|
|
|
|
|
|
|
|
||||||||||||
|
|
|
|
|
|
|
|
|
|
|
|
|
|
|
|
|
|
CA (% of GDP) |
|
|
|
|||||||||||
|
|
|
|
|
|
|
|
|
|
|
|
|
|
|
|
|
4% |
|
|
|
|
|
|
|
|
|
|
|
||||
7.5% |
|
|
|
|
|
|
|
|
|
|
|
|
|
|
|
74 |
|
|
|
|
|
|
|
|
Basic Balance (% of GDP) |
|
||||||
|
|
Employment Rate of Persons Aged 15-64 (rhs) |
|
|
|
|
|
|
|
|
|
|
|
|
||||||||||||||||||
|
|
|
|
|
|
|
|
|
|
|
|
|
|
|
|
|
|
|
|
|
|
|||||||||||
5.5% |
|
|
|
|
|
|
|
|
|
|
|
|
|
|
|
72 |
2% |
|
|
|
|
|
|
|
|
|
|
|
|
|
|
|
|
|
|
|
|
|
|
|
|
|
|
|
|
|
|
|
|
|
|
|
|
|
|
|
|
|
|
|
|
|
|
||
|
|
|
|
|
|
|
|
|
|
|
|
|
|
|
|
|
0% |
|
|
|
|
|
|
|
|
|
|
|
|
|
|
|
3.5% |
|
|
|
|
|
|
|
|
|
|
|
|
|
|
|
70 |
|
|
|
|
|
|
|
|
|
|
|
|
|
|
|
|
|
|
|
|
|
|
|
|
|
|
|
|
|
|
|
|
|
-2% |
|
|
|
|
|
|
|
|
|
|
|
|
|
|
|
1.5% |
|
|
|
|
|
|
|
|
|
|
|
|
|
|
|
68 |
-4% |
|
|
|
|
|
|
|
|
|
|
|
|
|
|
|
|
|
|
|
|
|
|
|
|
|
|
|
|
|
|
|
|
|
|
|
|
|
|
|
|
|
|
|
|
|
|
|
|
-0.5% |
|
|
|
|
|
|
|
|
|
|
|
|
|
|
|
66 |
-6% |
|
|
|
|
|
|
|
|
|
|
|
|
|
|
|
|
|
|
|
|
|
|
|
|
|
|
|
|
|
|
|
|
|
|
|
|
|
|
|
|
|
|
|
|
|
|
|
|
-2.5% |
|
|
|
|
|
|
|
|
|
|
|
|
|
|
|
64 |
-8% |
|
|
|
|
|
|
|
|
|
|
|
|
|
|
|
03 |
04 |
05 |
06 |
07 |
08 |
09 |
10 |
11 |
12 |
13 |
14 |
15 |
16 |
17 |
18 |
|
|
06 |
07 |
08 |
09 |
10 |
11 |
12 |
13 |
14 |
15 |
16 |
17 |
18 |
19 |
20 |
Source: Haver, UBS |
|
|
|
|
|
|
|
|
|
|
|
|
|
|
Source: Haver, UBS |
|
|
|
|
|
|
|
|
|
|
|
|
|||||
7. Long 10y Russia OFZ, long RUBCAD
We see Russian 10y bond valuations as cheap. Real yields still rank among the most attractive when compared with the rest of EM (Figure 57). The CBR is likely to hike by another 25bp in Q1 2019 because inflation is set to rise temporarily, but we expect cuts to start being priced in after this. This monetary policy path, coupled with slowing growth, should lead the local yield curve to flatten, with back-end yields largely stable (and possibly lower) in 2019. The RUB screens around 14% cheap on our FEER metric (see FX section) and 10% cheap on our BEER model (Figure 56). These signals imply that there is a large cushion to absorb external and/or geopolitical risks. The current account surplus will continue acting as a strong anchor, while the CBR's FX purchases will happen if the authority wants to limit excessive FX appreciation and not to depreciate the currency from current levels.
A key risk to our view is geopolitics – more sanctions on Russia are still being considered by the US Congress. The share of non-resident holdings of OFZs has already dropped from 34.5% at the end of March to 24.4% by November, but it is still significantly above the previous low of 19% in early 2015. The long end of the yield curve is relatively more exposed to changes in foreign positioning as nonresident holdings were more concentrated in the 5y+ maturities. We fund this position in CAD to decrease the sensitivity to oil prices. As discussed in the Box: How to overcome EM's weakest link?, the Sharpe Ratio of GBI-EM Russia can be improved when funded in CAD, instead of USD, hence the exposure to oil price risk can be hedged relatively inexpensively.
Russian bonds have the largest real yields across EM
Hike to be followed by expected cuts
RUB screens as cheap on our valuation models anchored by a strong external balance
Foreign positioning eased but OFZs are still vulnerable to nonresident outflows
Funding in CAD decreases the sensitivity to oil price swings
Global Macro Strategy 19 November 2018 |
28 |

vk.com/id446425943
Figure 56: RUB REER misalignment from fair value
20% |
|
Residual |
|
+1 Stdev |
|
-1 stdev |
|
|
|
|
|
|
|||
15% |
|
|
|
|
|
|
|
10% |
|
|
|
|
|
|
|
5% |
|
|
|
|
|
|
|
0% |
|
|
|
|
|
|
|
-5% |
|
|
|
|
|
|
|
-10% |
|
|
|
|
|
|
|
-15% |
|
|
|
|
|
|
|
-20% |
|
|
|
|
|
|
|
11 |
12 |
13 |
14 |
15 |
16 |
17 |
18 |
Source: Haver, Bloomberg, UBS Note: BEER valuation for RUB is based on the regression of LN(REER) against our Macro balance sheet risk score, oil prices and real interest rate bond yields in the periods 2011M01 to 2014M11, 2015M02 to 2016M12 and 2017M04 to 2018M11.
Figure 57: RUB real rates fundamentally attractive vs peers
7 |
Real Yield (%) |
|
|
|
|
|
|
|
|
|
|
|
|
|
BZ |
|
|
6 |
|
|
|
|
|
|
|
|
5 |
|
RU |
|
|
|
MX |
|
|
4 |
|
|
|
ID |
|
|
|
|
|
|
|
|
CO |
ZA |
|
||
|
|
|
|
|
|
|||
|
|
|
|
|
|
|
||
3 |
|
|
|
|
|
|
IN |
|
2 |
|
|
|
CL |
MY |
|
|
|
|
|
|
TH |
|
|
|
||
1 |
|
IL |
|
|
|
CN |
TU |
|
|
|
|
PL |
|
||||
|
|
|
|
|
||||
|
|
|
|
KR |
HU |
|
|
|
0 |
CZ |
|
|
|
|
|
|
|
|
TW |
|
|
|
|
|
||
|
|
|
|
|
Macro Balance Sheet Risk Score |
|||
-1 |
|
|
|
|
|
|||
|
|
|
|
|
|
|
|
|
4 |
6 |
|
8 |
|
|
10 |
12 |
14 |
Source: Bloomberg, Haver, UBS estimates
8. Long NTN-F 2025, Long BRLCOP
We recommend extending duration in the Brazil local bond yield curve from our 2018 top-trade recommendation of buying the NTN-F 2023 bonds to the NTN-F 2025 bond, and to continue hedging the BRL exposure in COP. Despite Brazil's post-election relief rally across asset classes, the new Bolsonaro administration has vowed to undertake a multi-year period of market liberalisation and fiscal consolidation (see Box 8). Proposals to strengthen the independence of the central bank, pass the pension reform, cut government expenditure and privatise public assets, among others, would decrease fiscal risks, the main reason, in our view, for the high risk premia in the local bond yield curve (Figure 58). Implementation risks abound as the new administration will need to garner Congressional support, but members of centrist parties have stated that they would back the reform agenda. The domestic and macro picture, coupled with the reforms, would imply a flatter local bond curve in 2019, in our view. UBS economists expect 3% activity growth buoyed by an 8% annual increase in investment. The BCB would hike around 200bp in 2019, according to our estimates, as inflation accelerates mildly. However, the recovery in activity should not be imperilled by the re-start of the hiking cycle as the positive momentum for the economy does not rely on low real rates, but on improved confidence amid a wide and negative output gap. External accounts remain in a good position, with a low current account deficit more than fully covered by the FDI flows (Figure 59).
Commodity exports could be threatened by the expected deceleration in global and Chinese GDP growth. Hedging the long local bond position in COP mitigates this risk. Brazil's export basket depends more heavily on metals and agricultural goods than oil (Colombia's main export), but lower carry amid higher macro risk makes the COP a good candidate to decrease the BRL's exposure to heightened external growth pressures. Foreign participation in the local bond market appears to have peaked in Colombia at around 27% after several years of credit improvement. However, the high dependence of external and fiscal accounts on oil revenues amid falling production makes further support from portfolio inflows unlikely.
We still see value in duration in local bond in Brazil, despite the post-election rally
A continuation of the reform agenda and better growth prospects would decrease longterm fiscal risk, favouring the long end of the yield curve
Commodity exports could suffer as global and Chinese growth decelerates in 2019; a short COP position can mitigate this risk
Global Macro Strategy 19 November 2018 |
29 |