

vk.com/id446425943
Global Research |
19 November 2018 |
Global Macro Strategy
EM Outlook 2019: Are cheap valuations enough?
Will 2019 be another difficult year for EM?
Yes, but after a big de-rating this year, returns should be better than the low bar set by post-crisis averages. The nature of the EM's challenges is changing, too. While 2018 was about pressure from rising yields and tighter financial conditions, 2019 will be about weaker growth. This is likely to shift the pressure from current account-deficit economies to the open economies of Asia. Turn to page 3 for a full list of our trades.
When will EM equities begin a decent rally; what support is required?
EM's sequential growth should bottom around Q2 next year, at which point its performance prospects should improve. Tactically, we prefer Value over Growth, but believe that the case for a medium-term rally in EM has to be built on Growth stocks, which are now becoming less expensive. Reduced and domestically-focused stimulus should help Chinese equities, but bring smaller EPS gains for the rest of EM. After 12.7% losses YTD, we expect total returns of 7–8% in EM equities in 2019.
Is there a case for local-currency debt over hard-currency debt?
A smaller rise in US rates and some EUR strength should help stabilise high-yielding currencies that have a high weight in the local bond benchmark. Backed by high real rates and term premium, EM duration should remain well anchored, yielding total returns of 6% for local debt, although returns will be back-loaded next year. With spreads drifting wider, returns in hard-currency debt should be around 4%.
Positives to rely on; developments to be warned of
EM suffers weak income statements, but does not have a balance sheet problem today. A handful of small economies that had solvency issues have already seen their risk premiums adjust in 2018. The bulk of EM is not levered, and could build a domestic demand cycle. But this is urgently needed, because EM is not benefiting as much from US growth as it used to. A long spell of low growth leads to weak labour markets; populism and a lack of policy independence follow shortly thereafter. There is fiscal room today, but this is the space to watch.
Top-down & Bottom-up: UBS answers EM's big questions. Click for Box
What do asset, product and labour markets tell us about the stage of the economic cycle? How can investors overcome EM's weakest link?
How far are we from capitulation in EM equities?
How sensitive are different global assets to a weaker CNY?
Can global demand for CNY help fund a potential deficit in China? Can Indian stocks find their groove again?
Where next for the fading 'Memory Supernova'? What reforms can we expect from Brazil?
Where is term premium in EM local currency debt?
Why is EM growth not benefitting from stronger US growth? Which EM debt market is most vulnerable to slower portfolio flows?
What is the collateral damage from China's inclusion in global indices? What will ECB and BoJ normalisation mean for EM assets?
Is it time to buy after the rough ride in Argentina? Will onshore defaults continue in China?
www.ubs.com/investmentresearch
Global Macro Strategy
Global
Bhanu Baweja
Strategist bhanu.baweja@ubs.com +44-20-7568 6833
Rohit Arora
Strategist rohit-b.arora@ubs.com +65-6495 5232
Armando Armenta
Strategist armando.armenta@ubs.com +1-203-719 5466
Fiona Lake
Strategist fiona.lake@ubs.com +65-6495 4416
Alexey Ostapchuk
Strategist alexey.ostapchuk@ubs.com +44-20-7567 0239
Anna Ho
Analyst anna.ho@ubs.com +852-3712 2965
Mary Xia, CFA
Strategist S1460512040001 mary.xia@ubssecurities.com +86-105-832 8508
Stephen Caprio, CFA
Strategist stephen.caprio@ubs.com +44-20-7567 5788
This report has been prepared by UBS Limited. ANALYST CERTIFICATION AND REQUIRED DISCLOSURES BEGIN ON PAGE 100. UBS does and seeks to do business with companies covered in its research reports. As a result, investors should be aware that the firm may have a conflict of interest that could affect the objectivity of this report. Investors should consider this report as only a single factor in making their investment decision.

vk.com/id446425943
Table of Contents |
|
Recommended trades, key messages and signposts..................... |
3 |
Pictures that tell the story ............................................................... |
4 |
Overview of EM asset calls.............................................................. |
9 |
Box 1: What do asset, product and labour markets tell us about the stage |
|
of the economic cycle?........................................................................... |
13 |
Box 2: How far are we from capitulation in EM equities? ....................... |
17 |
Box 3: How can investors overcome EM's weakest link – currencies? ..... |
18 |
Top trades for 2019........................................................................ |
22 |
China (too) makes difficult choices now ...................................... |
32 |
Box 4: Can a more globally accepted CNY help fund a potential deficit in |
|
China? ................................................................................................... |
37 |
Box 5: How sensitive are global assets to a weaker CNY?....................... |
39 |
Equities: Probing what is cheap and why .................................... |
41 |
Box 6: Can Indian equities find their groove? ......................................... |
49 |
Box 7: Semiconductors: Where next for the fading Memory Supernova? 54 |
|
Currencies: A shift in pressure points........................................... |
56 |
Box 8: What reforms can we expect from Brazil?.................................... |
59 |
Box 9: What is the collateral damage from China's inclusion in global |
|
indices?.................................................................................................. |
60 |
Box 10: Why is EM growth not benefitting from stronger US growth? ... 64 |
|
Local rates: Buffered by term premia & real rates....................... |
69 |
Box 11: Which EM debt market is most vulnerable to slower portfolio |
|
flows? .................................................................................................... |
74 |
Box 12: What will ECB and BoJ normalisation mean for EM assets? ....... |
75 |
Box 13: Where is term premium in EM local currency debt? ................... |
79 |
Credit: Help from more realistic risk premia ................................ |
82 |
Box 14: Is it time to buy after the rough ride in Argentina? .................... |
84 |
Box 15: Will onshore defaults continue in China?................................... |
88 |
Political calendar ............................................................................ |
91 |
Performance of 2018 top trades ................................................... |
93 |
UBS FX & macroeconomic forecasts.............................................. |
95 |
We would like to thank Sumit Chugh, Daksh Gupta, Esha Segan, Sarbartho Mukherjee, Sreeram Sarja and Sagarika Asrani, our research support service professionals, for their assistance in preparing this research report.
Global Macro Strategy 19 November 2018 |
2 |

vk.com/id446425943
Recommended trades, key messages and signposts
Recommended trades |
|
Key messages |
|
|
|
•Long China A-shares vs MSCI EM ex China, Long USDCNY
•Long MSCI EM Value vs MSCI EM Growth
•Long 10y Indian government bonds vs MSCI India
•Long MSCI Indonesia vs Malaysia and Thailand, FX-hedged
•Long G3 currencies vs KRW
•Long CZK vs ZAR
•Long 10y Russia OFZ, Long RUBCAD
•Long NTN-F 2025, Long BRLCOP
•Receive 2y Mexico TIIE rates
•Long Asia HY vs Asia IG
•EM-DM growth differentials will likely slip further. No strong case for a big re-rating in equities, but things may improve from Q2 2019 when earnings downgrades should end. Target: 7-8% returns.
•Prefer Value style today amid further adjustment in EM Growth stocks. Strong preference for Growth over the medium and long term.
•China makes choices between external stability and growth for the first time in 25 years. This impacts the size and nature of its stimulus.
•A better year for EM currencies at an aggregate level, but pressure shifts from high yielders to growth-sensitive Asia. 1-2% losses in spot allow for small positive total returns.
•We enter 2019 with a preference for hard-currency debt over local-currency debt. Local debt should do better in H2 2019, and through the full year. We look for 4% & 6% in hard & local currency debt in 2019.
|
Key EM forecasts |
|
|
Signposts and triggers for change |
|
|
|
|
|
|
|
|
YTD (2018) |
2019 |
Post-crisis |
|
• Bullish: DM capex broadens and imports accelerate |
|
average* |
|
|||
|
|
|
|
||
MSCI EM |
-12.7% |
7%-8% |
2.0% |
|
• Bullish: Wages stay sluggish, Fed reassesses |
|
|
|
|
|
|
|
|
|
|
|
|
GBI EM |
-7.6% |
5%-6% |
0.1% |
|
• Bullish: Private sector confidence revives in China |
EMBI GD |
-5.3% |
4.0% |
5.4% |
|
• Bearish: Fed reassess terminal rate |
|
|
|
|
|
|
EM Corporate Credit* |
-2.7% |
3.5% |
4.6% |
|
• Bearish: US inflation or term premium rises sharply |
|
|
|
|
|
• Bearish: Continuing tight credit conditions in China |
EMBI GD spread |
96bp wider |
20-30bp wider |
15bp wider |
|
|
|
|
|
|
• Bearish: Protectionist 'tit-for-tat' increases |
|
EM Corporate Spreads* 119bp wider |
30-50bp wider |
5bp wider |
|
||
|
|
|
|
|
|
EM FX vs USD* |
-9.3% |
-0.5% |
-5.8% |
|
|
|
|
|
|
|
|
|
|
|
|
|
|
Source: UBS MSCI, Datastream, Haver, UBS estimates *EM aggregate based on equalweighted measure of 20 countries and EM Corporate Credit based on Bloomberg Barclays EM Corporate Index. Post-crisis average based on yearly average since 2011.
Global Macro Strategy 19 November 2018 |
3 |

vk.com/id446425943
Pictures that tell the story
Global Macro Strategy 19 November 2018 |
4 |
vk.com/id446425943
Figure 1: MSCI-weighted EM and DM real GDP growth and forecast
10 |
%, y/y growth |
|
|
|
|
Spread (EM-DM) |
|
EM |
|
DM |
|
|||
|
|
|
|
|
|
|
|
|||||||
|
|
|
|
|
|
|
|
|
|
|
|
|
||
8 |
|
|
|
|
|
|
|
|
|
|
|
|
|
|
6 |
|
|
|
|
|
|
|
|
|
|
|
%ile (20E): 19% |
||
|
|
|
|
|
|
|
|
|
|
|
|
|
|
|
|
|
|
|
|
|
|
|
|
|
|
|
%ile (20E): 30% |
||
4 |
|
|
|
|
|
|
|
|
|
|
|
|
|
|
2 |
|
|
|
|
|
|
|
|
|
|
|
|
|
|
0 |
|
|
|
|
|
|
|
|
|
|
|
%ile (20E): 22% |
||
|
|
|
|
|
|
|
|
|
|
|
|
|||
-2 |
|
|
|
|
|
|
|
|
|
|
|
|
|
|
-4 |
|
|
|
|
|
|
|
|
|
|
|
|
|
|
-6 |
|
|
|
|
|
|
|
|
|
|
|
|
|
|
91 |
93 |
95 |
97 |
99 |
01 |
03 |
05 |
07 |
09 |
11 |
13 |
15 |
17 |
19 |
Source: Haver, Datastream, MSCI, Bloomberg, UBS |
|
|
|
|
|
|
|
|
||||||
We expect DM and EM growth to slip next year, with EM growth declining modestly more in 2019, before recovering in 2020. Overall, the premium of EM growth over DM should remain broadly unchanged over the next two years. This premium is in the bottom decile of its long termdistribution. more →
Figure 2: What do different assets say about the stage of the cycle?
|
|
US |
EU |
|
|
Corporate credit |
|
|
|
|
Corp debt (% of GDP) |
96% |
76% |
|
|
|
|||
|
Change in corp debt (% of GDP) |
48% |
4% |
|
|
B and CCC (% of HY index) |
27% |
42% |
|
|
|
|||
|
HY Index yield minus coupon |
49% |
45% |
|
|
HY spreads levels |
94% |
79% |
|
|
Change in HY spreads |
49% |
68% |
|
|
Bank credit |
|
|
|
|
NPLs levels |
72% |
73% |
|
|
Change in NPLs (% of bank assets) |
38% |
31% |
|
|
Bank assets (% of GDP) |
49% |
73% |
|
|
Philips curve |
|
|
|
|
Unemployment rate |
100% |
88% |
|
|
Change in unemployment rate |
45% |
8% |
|
|
Inflation gap |
88% |
47% |
|
|
Equity market |
|
|
|
|
Profit margin |
100% |
80% |
|
|
Change in profit margin |
28% |
49% |
|
|
Bond markets |
|
|
|
|
Policy rate priced over 5y |
86% |
40% |
|
|
Aggregate |
66% |
51% |
|
|
|
|
|
|
Source: Haver, Bloomberg, UBS * Values in the table are a percentile of current level since 1999 for US and early 2000 for EU. Colours refer to different quartiles with red representing top quartile and green representing bottom quartile of the distribution.
The aggregate of our subindicators puts the US cycle in the middle of its third quartile, and the EU cycle closer to the median. The leading sub-indices in our metric – bond markets and the Phillips curve – suggest the US is even further along in the cycle. However, this expansion has been more gradual than the previous ones, giving more time to policy makers and economic agents to adapt, thereby aiding the longevity of the cycle. more →
Figure 3: EM equity valuations vs cost of capital
13.5 |
|
|
|
3.5 |
13.0 |
|
|
|
|
12.5 |
|
|
|
4.0 |
12.0 |
|
|
|
|
11.5 |
|
|
|
4.5 |
11.0 |
|
|
|
|
10.5 |
|
|
|
5.0 |
10.0 |
|
|
|
|
9.5 |
|
|
|
5.5 |
14 |
15 |
16 |
17 |
18 |
|
MSCI EM: 12m fwd P/E |
|
10y UST+10y CDS (RHS, inverted, MSCI-weighted) |
|
Source: IBES, MSCI, Datastream, UBS
EM equities have de-rated sharply this year, but little more than what would have been expected given the change in the EM cost of capital – the US 10y yield (a proxy for the risk-free rate) and EM credit spreads (risk premium). The room for major re-rating is limited given that the Fed is set to continue rate hikes. However, the second half of next year may bring better news as EM growth hitting sequential bottom should add confidence. more →
Global Macro Strategy 19 November 2018 |
5 |

vk.com/id446425943
Figure 4: UBS Leading Tech Index vs MSCI EM IT price index and 12m trailing EPS
250 |
Dec-2010=100 |
|
|
Correlation with UBS Tech Index: +0.75 |
2.5 |
|||
|
MSCI EM IT: Price index |
|
|
|
||||
230 |
|
|
|
|
|
|
||
|
|
MSCI EM IT: 12m trailing EPS |
|
|
|
2.0 |
||
210 |
|
|
First principal component of tech indicators (RHS) |
|
|
|||
|
|
|
|
|
|
|
1.5 |
|
|
|
|
|
|
|
|
|
|
190 |
|
|
|
|
|
|
|
1.0 |
|
|
|
|
|
|
|
|
|
170 |
|
|
|
|
|
|
|
0.5 |
150 |
|
|
|
|
|
|
|
|
|
|
|
|
|
|
|
0.0 |
|
130 |
|
|
|
|
|
|
|
|
|
|
|
|
|
|
|
|
|
110 |
|
|
|
|
|
|
|
-0.5 |
|
|
|
|
|
|
|
|
|
90 |
|
|
|
|
|
|
|
-1.0 |
|
|
|
Correlation with UBS Tech Index: +0.62 |
|
||||
70 |
|
|
|
-1.5 |
||||
|
|
|
|
|
|
|
||
50 |
|
|
|
|
|
|
|
-2.0 |
11 |
12 |
13 |
14 |
15 |
16 |
17 |
18 |
|
Source: Haver, Bloomberg, MSCI, Datastream, UBS
Figure 5: 12m fwd EM sector P/E relative to MSCI World (DM; percentiles) vs proportion of Value in EM sector
100% |
12m fPE relative |
|
HTC |
|
|
to DM (percentile |
|
|
|
||
90% |
|
|
|
||
since 2002) |
CST |
|
TEL |
|
|
|
|
|
|||
80% |
|
|
|
|
|
|
|
CDS |
|
|
|
|
|
|
|
|
|
70% |
|
|
|
|
|
60% |
|
|
|
|
|
50% |
|
|
|
UTL |
ENE |
40% |
|
|
|
||
|
|
EM |
MAT |
FIN |
|
30% |
|
ITS |
|||
|
|
IND |
|
||
20% |
|
|
|
|
|
|
|
|
|
|
|
10% |
|
|
|
|
|
0% |
|
|
|
REL |
|
0% 10% 20% 30% 40% 50% 60% 70% 80% 90%
Proportion of Value stocks in sector
Source: IBES, MSCI, Datastream, UBS
Figure 6: Share of investors from different domiciles in EM markets: US investors are the dominant holders of EM assets
100% |
|
|
|
|
|
90% |
|
|
|
|
|
80% |
|
|
|
|
|
70% |
|
|
|
|
|
60% |
|
|
|
|
|
50% |
|
|
|
|
|
40% |
|
|
|
|
|
30% |
|
|
|
|
|
20% |
|
|
|
|
|
10% |
|
|
|
|
|
0% |
|
|
|
|
|
BZ CL CO CZ |
HU IN |
ID IS |
KO MA |
MX PH |
PO RU ZA TH TU CH |
US |
Japan |
UK |
EA |
Offshore |
Others |
Source: CPIS, IMF, Haver, UBS
Our Leading Tech Index suggests downgrades will continue in IT earnings. We have been underweight EM IT relative to DM IT for nearly all of this year. We are no longer in this position because of a widening difference in valuation multiples, but will wait for our Leading Tech Index to give us a signal to switch positions and go long EM IT.
more →
EM is often regarded as very cheap to DM, but looking at sectors gives a good perspective on why this is so. It is EM's Value sectors that drive EM's cheapness relative to DM. EM's Growth sectors are still expensive relative to DM. We are long EM Value to Growth tactically. But, Growth is a better long-term style for EM, in our view. We should get a good entry point in 2019. We are keeping a close eye on our leading indicators for Tech and Consumer to signal this. more →
US investors are more important to EM markets than Eurozone and Japanese investors. As the ECB and BoJ normalise, we do not expect the same incremental pressure on EM as witnessed through Fed's normalisation.
more →
Global Macro Strategy 19 November 2018 |
6 |

vk.com/id446425943
Figure 7: China's onshore spreads suggest a measured easing in liquidity
180 |
|
Average spread between 1y AA and AAA CNY bonds (bps) |
24% |
|||
|
TSF growth (% y/y, 3mma, rhs) |
|
|
|||
|
|
|
|
|
||
160 |
|
|
|
|
|
22% |
|
|
|
|
|
|
|
140 |
|
|
|
|
|
20% |
|
|
|
|
|
|
|
120 |
|
|
|
|
|
18% |
|
|
|
|
|
|
|
100 |
|
|
|
|
|
|
80 |
|
|
|
|
|
16% |
|
|
|
|
|
|
|
60 |
|
|
|
|
|
14% |
|
|
|
|
|
|
|
40 |
|
|
|
|
|
12% |
|
|
|
|
|
|
|
20 |
|
|
|
|
|
10% |
Jan-12 |
Jan-13 |
Jan-14 |
Jan-15 |
Jan-16 |
Jan-17 |
Jan-18 |
Source: CEIC, UBS
In EM's biggest markets, China and India, onshore liquidity has tightened as non-bank actors came under pressure. In China this was by design, in India, by accident. However, Chinese authorities have recently suggested they will pay attention not just to growth, but specifically to easier liquidity to the private sector. This may make for onshore credit spreads contracting and equity valuations improving in sympathy. more →
Figure 8: Impact of a 1% change in USDCNY on global equities
1.0 |
(%) |
|
|
|
|
|
|
|
|
Periods of concentrated CNY weakness |
|
Full sample |
||||
0.5 |
|
|
|
Stronger |
|
|
|
|
|
|||||||
|
|
|
|
|
|
|
|
|
|
|
|
|
|
|
||
0.0 |
|
|
|
|
|
|
|
|
|
|
|
|
|
|
|
|
-0.5 |
|
|
|
|
|
|
|
|
|
|
|
|
|
|
|
|
-1.0 |
|
|
|
|
|
|
|
|
|
|
|
|
|
|
|
|
-1.5 |
|
|
|
|
|
|
|
|
|
|
|
|
|
|
|
|
-2.0 |
|
|
|
|
|
|
|
|
|
|
|
Weaker |
|
|
|
|
-2.5 |
|
|
|
|
|
|
|
|
|
|
|
|
|
|
|
|
|
|
|
|
|
|
|
|
|
|
|
|
|
|
|
|
|
-3.0 |
Taiwan |
India |
Korea |
Australia |
Japan |
China (Shenzhen) US Canada |
Colombia |
Chile |
Turkey |
Brazil |
Sweden UK |
Malaysia Thailand Poland |
Singapore Mexico South Africa |
Hong Kong China (Hang Seng) |
Eurozone |
Norway Indonesia Argentina |
|
||||||||||||||||
Source: Bloomberg, Haver, UBS Note: Light bars indicate statistically insignificant betas. The periods of concentrated CNY weakness are: i) August 2015 to January 2016, ii) October 2016 to January 2017, iii) June 2018 to October 2018.
We estimated the impact of weaker CNY on global equity markets controlling for the oil price and US 10y rate. US stocks screened as better protected than Euro area equities. China's A- shares were better placed than most EM markets. The commodity-heavy markets were, unsurprisingly, most exposed.
more →
Figure 9: China 'Other Investment' in the capital account & house prices % y/y
12% |
(%y/y) |
|
|
|
|
|
Home prices growth |
|
|
3% |
||
10% |
|
|
|
|
|
|
OI (% of GDP, rhs) |
|
|
2% |
||
|
|
|
|
|
|
|
|
|
|
|
||
|
|
|
|
|
|
|
|
|
|
|
|
|
8% |
|
|
|
|
|
|
|
|
|
|
|
1% |
6% |
|
|
|
|
|
|
|
|
|
|
|
|
|
|
|
|
|
|
|
|
|
|
|
|
|
4% |
|
|
|
|
|
|
|
|
|
|
|
0% |
|
|
|
|
|
|
|
|
|
|
|
|
|
2% |
|
|
|
|
|
|
|
|
|
|
|
-1% |
0% |
|
|
|
|
|
|
|
|
|
|
|
-2% |
|
|
|
|
|
|
|
|
|
|
|
|
|
-2% |
|
|
|
|
|
|
|
|
|
|
|
-3% |
-4% |
|
|
|
|
|
|
|
|
|
|
|
|
|
|
|
|
|
|
|
|
|
|
|
|
|
-6% |
|
|
|
|
|
|
|
|
|
|
|
-4% |
|
|
|
|
|
|
|
|
|
|
|
|
|
-8% |
|
|
|
|
|
|
|
|
|
|
|
-5% |
06 |
07 |
08 |
09 |
10 |
11 |
12 |
13 |
14 |
15 |
16 |
17 |
18 |
Source: Haver, UBS
While China will continue to attract portfolio flows, one must remain alert to CNY risk from other capital outflows. The demand for offshore assets has increasingly become negatively correlated to the housing market. It bears watching in 2019 as house price growth is due to moderate. more →
Global Macro Strategy 19 November 2018 |
7 |
vk.com/id446425943
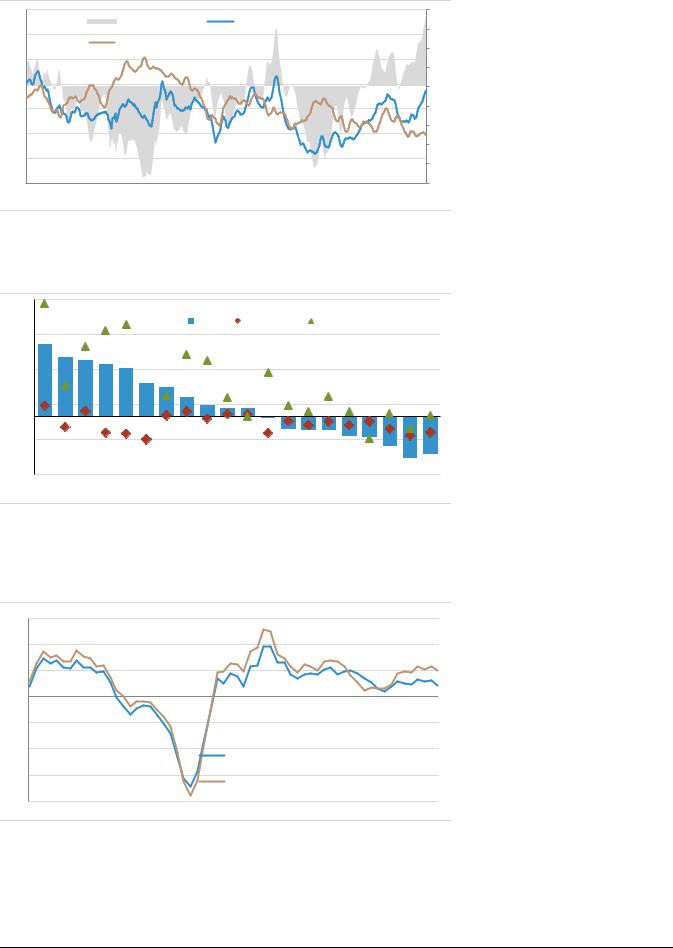
Figure 10: EM vs US and EU term premia
140 |
|
|
|
|
|
40 |
|
|
Spread (rhs) |
|
GBI-EM (ex TRY) |
|
30 |
120 |
|
|
|
|
|
|
|
Avg (US and EU) |
|
|
|
|
|
|
|
|
|
|
20 |
|
|
|
|
|
|
|
|
100 |
|
|
|
|
|
10 |
|
|
|
|
|
|
|
80 |
|
|
|
|
|
0 |
|
|
|
|
|
|
|
60 |
|
|
|
|
|
-10 |
|
|
|
|
|
|
|
40 |
|
|
|
|
|
-20 |
|
|
|
|
|
|
|
|
|
|
|
|
|
-30 |
20 |
|
|
|
|
|
-40 |
|
|
|
|
|
|
|
0 |
|
|
|
|
|
-50 |
12 |
13 |
14 |
15 |
16 |
17 |
18 |
Source: Bloomberg, UBS
Figure 11: 12m FX carry: Latest vs 12m ago vs end-2015
10% |
|
|
|
|
|
|
|
|
|
|
|
|
|
|
|
|
|
|
|
|
|
|
|
|
|
|
|
Latest |
|
12m change |
|
End-2015 |
|
|
|
|
|||
7% |
|
|
|
|
|
|
|
|
|
|
|
|
|
|
|
|
|
|
|
4% |
|
|
|
|
|
|
|
|
|
|
|
|
|
|
|
|
|
|
|
1% |
|
|
|
|
|
|
|
|
|
|
|
|
|
|
|
|
|
|
|
-2% |
|
|
|
|
|
|
|
|
|
|
|
|
|
|
|
|
|
|
|
-5% |
|
|
|
RUB |
|
|
|
CNY |
|
|
CLP |
SGD |
|
|
|
|
HUF |
|
|
IDR |
MXN |
INR |
ZAR |
BRL |
PHP |
COP |
MYR |
RON |
PLN |
THB |
KRW |
CZK |
ILS |
TWD |
|||||
Source: Bloomberg, UBS |
|
|
|
|
|
|
|
|
|
|
|
|
|
|
|
|
|
||
Unlike 2013, when the EM term premium reacted to an increase in that in the US, in 2018, it has picked up from the pressure in the US front-end yields. Its spread against DM is now at the highest level in the post-crisis period, similar to the spread in real rates. EM duration is attractively valued. The question is on FX risk. This can be hedged by using the AUD, CAD or GBP as funding currencies. more →
EM carry has improved in the high-yielders over the past year, but it is still well below the level seen in the last cyclical slowdown. For the low-yielders in Asia, carry has worsened further. With US Libor rising steadily, the carry protection for EM going into the global growth and trade slowdown is low. more →
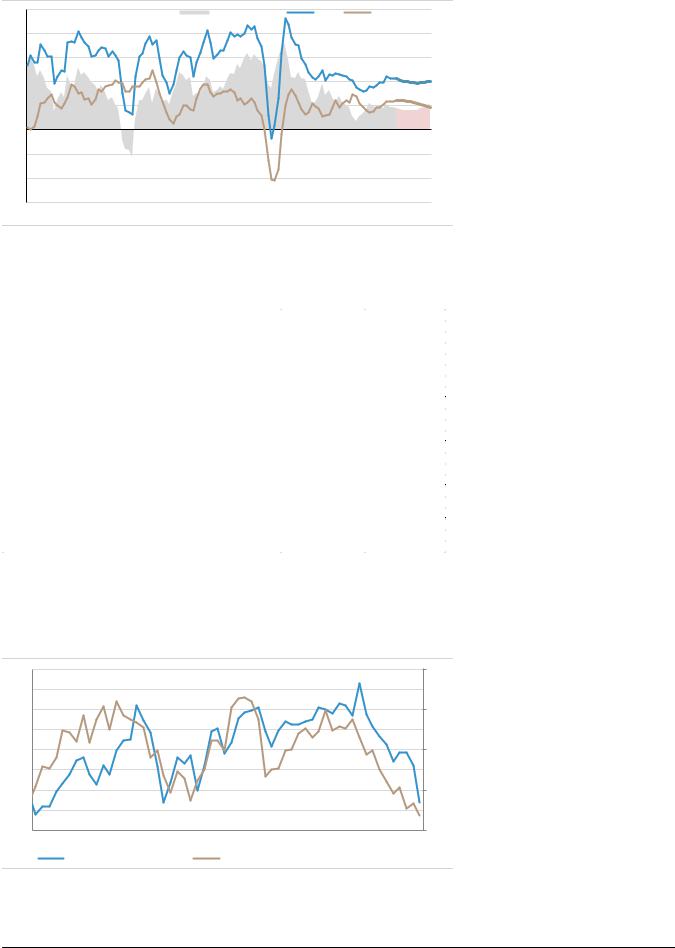
Figure 12: Why has EM growth benefitted less from the US? US non-residential investment, and ex Shale & Intellectual property
15
10
5 |
|
|
|
|
|
|
|
|
|
|
|
|
|
|
|
0 |
|
|
|
|
|
|
|
|
|
|
|
|
|
|
|
-5 |
|
|
|
|
|
|
|
|
|
|
|
|
|
|
|
-10 |
|
|
|
|
|
|
|
US non-residential investment growth ex shale oil/gas |
|||||||
|
|
|
|
|
|
|
|
||||||||
-15 |
|
|
|
|
|
|
|
and IP |
|
|
|
|
|
|
|
|
|
|
|
|
|
|
US non-residential investment growth |
|
|
||||||
|
|
|
|
|
|
|
|
|
|
||||||
-20 |
|
|
|
|
|
|
|
|
|
|
|
|
|
|
|
03 |
04 |
05 |
06 |
07 |
08 |
09 |
10 |
11 |
12 |
13 |
14 |
15 |
16 |
17 |
18 |
Source: |
Haver, UBS |
|
|
|
|
|
|
|
|
|
|
|
|
|
|
The nature of US capex in this round of growth is focussed much more on intellectual property and shale gas & oil. These sectors, which made up 58% of capex growth in the last 12 months, do not help EM much. In order for EM manufacturers to benefit more amidst a China-driven loss of growth momentum in the commodity producers, US capex must broaden out more. more →
Global Macro Strategy 19 November 2018 |
8 |