

Учебники / Head_and_Neck_Cancer_Imaging
.pdf352 |
S. Nuyts |
18.4.1.2 MRI
Evidence is growing that complementary information from alternative imaging modalities could help decrease the variability encountered for GTV delineation. MRI shows several potential advantages over CT, such as better discrimination between tumour and normal tissues in many organs. Rash et al. (1997) studied the potential impact of the combined use of CT and MRI on tumour volume delineation in advanced head and neck cancer. Four observers outlined the GTV in six patients with advanced cancers with extension to the base of skull on CT, axial MRI, and coronal or sagittal MRI. They found that MRI-de- rived GTVs are smaller (difference of 30%) and have less interobserver variation than CT-derived GTVs. The ability to obtain images in any anatomical plane and the superior soft tissue contrast of MRI has led to its use in target delineation in nasopharyngeal carcinoma (NPC). Enami et al. (2003) examined the use of MRI and CT in eight NPC patients. Compared with CT, the MRI-based targets were 74% larger, more irregularly shaped, and did not always include the CTV targets. On average, the composite CT+MRI GTV was 10% larger than the GTV drawn from MRI alone. Therefore, the use of CT-based targets may lead to underdosing of some regions of the tumour. Image fusion allows one to use both CT and MRI information in drawing the target volumes. The authors concluded that fusion of MRI and CT images is recommended in treatment planning for NPC, because it significantly reduces the possibility of missing parts of the tumour volume. This was confirmed by Chung et al. (2004) who studied the impact of MRI versus CT on NPC in 258 patients. They found that MRI was superior to detect intracranial infiltration since in 40.3% of patients this was detected by MRI, whereas CT showed negative findings. Detection of pterygopalatine fossa involvement accompanying intracranial invasion was higher with MRI than CT (96.1% vs. 56.9%).
18.4.1.3 PET
A recent literature survey on the use of 18FDG PET in HNC indicates that when compared with CT, PET has a higher sensitivity (87% vs. 62%) and specificity (89% vs. 73%) for staging cancer, higher sensitivity (93% vs. 54%) and specificity (83% vs. 74%) for imaging recurrences, and higher sensitivity (84% vs. 60%) and specificity (95% vs. 39%) for monitoring effects
of therapy (Gambhir et al. 2001). However, 18FDG is not a specific marker for cancer since other normal tissues, including salivary gland, skeletal muscle, brain, and heart can have increased tracer uptake. In addition, activated macrophages and areas of inflammation also show high tracer uptake, which can lead to false-positive examinations.
The impact of PET imaging on target delineation in radiotherapy for HNC has recently been investigated. The utility of PET further improved by the introduction of combination PET/CT scanners. Syed et al. (2005) examined the impact of combined FDG PET/ CT in HNC in 24 patients and concluded that PET/ CT significantly increases interobserver agreement and improved the confidence in disease localisation of FGD-avid lesions with 51%. However, one crucial remark must be made concerning the interpretation of the PET images. If we want to use PET to delineate volumes, we must define the way the PET images are viewed. For example, changing the window setting changes the interpretation of lesion margins; the optimal window setting for radiotherapy contouring applications has yet to be determined. Until now, every study uses its own threshold, or even does not comment on which threshold was used, which makes it difficult to compare the data.
Scarfone et al. (2004) evaluated the influence and accuracy of FDG-PET in target volume definition as a complementary study to CT. Six HNC patients were studied. Tumours were delineated on CT and modified based on the PET data. The resulting PET-CT GTV was larger than the original CT volume by an average of 15%. The final lymph node volume based on PET+CT was on average 17% larger than the initial CT volume. The authors concluded that PET can act as a complementary modality, providing information on target viability not visible by CT. Koshy et al. (2005) also examined the use of FDG PET in radiotherapy planning for HNC. A total of 36 patients with HNC received PET-CT as part of their treatment planning. In 38% of patients, PET-CT fusion altered the TNM score. Radiotherapy volumes and dose were altered in five patients (14%) and four patients (11%), respectively. Paulino et al. (2005) compared the GTV identified on CT to that obtained from FDG-PET in 40 patients with HNC. They found that the PET-GTV was smaller, the same size, and larger than the CTGTV in 75%, 8% and 18% of cases, respectively. In approximately 25% of patients, the primary GTV would have been underdosed when the CT-GTV was used for IMRT planning. The authors therefore recommend using both CTand PET-defined primary tumour in determining the GTV for IMRT. Ciernik

Use of Imaging Data in Radiotherapy Planning of Head and Neck Cancer |
353 |
et al. (2003) used integrated PET-CT for target volume definition in 39 patients with various solid tumours, 12 were HNC. They detected an increase in PET-GTV of >=25% compared to CT-GTV in 17% of patients, while the GTV was reduced >=25% in 33% of patients. In patients with nasopharyngeal (n, 9) and oropharyngeal (n, 12) tumours, Nishioka et al. (2002) found that PET-CT detected 39 positive nodes in contrast to only 28 nodes detected by clinical examination and CT/MRI. In four patients, the nodal status was increased, which impacted on target delineation. Parotid sparing became possible in 71% of patients whose upper neck areas near the parotid glands were tumour free on PET-CT, and, except for one patient, no recurrences were seen at 18 months when the PET-CT defined volumes were used as GTV. In general, all studies conclude that PET adds extra information to both CT and MRI concerning target delineation.
However, we must keep in mind that the majority of FDG-PET findings lack corresponding pathology data. A small study by Schwartz et al. (2005) compared FDG-PET findings with the pathology findings in 20 patients undergoing neck dissection. FDG-PET/CT showed a high nodal staging sensitivity and specificity of 96% and 98.5%, respectively. FDG-PET/CT detected nodal disease in two patients considered to have node-negative disease by CT alone. Daisne et al. (2004) compared CT, MR and FDG-PET in 29 patients with stages II–IV HNC. Nine patients underwent total laryngectomy. PET volumes were delineated based on a specific tumour to background ratio (Daisne et al. 2003). The key finding of this study was that, in comparison with the surgical specimen used as reference, all the imaging modalities tended to result in overestimation of the tumour extension. For anatomical imaging, average GTVs were up to 107% larger, whereas for functional imaging, a 46% overestimation was still observed. Despite this finding, all three imaging modalities failed to depict a small fraction of the subclinical tumour extension, which thereby revealed their insufficient resolution.
Overall, two general questions remain unsolved concerning the use of FDG-PET in radiotherapy treatment planning:
•What is the optimal PET volume for radiation therapy? To the contouring physician, the edges of tumours on PET are fuzzy, unlike CT. As discussed above, some authors arbitrarily define the FDG-avid volume as the region encompassed by the 50% intensity level relative to the tumour maximum (e.g. Paulino et al. 2005; Scarfone et al.
2004; Koshy et al. 2005), others use certain signal- to-background ratio’s (e.g. Daisne et al. 2004) as threshold.
•Will treatment of PET-defined tumour improve outcome? In theory, better delineation of the target should mean better tumour coverage and hence better local control. Whether this better treatment planning will have an impact on clinical outcome, either by improving local tumour control or by reducing toxicity remains to be determined.
Clinical studies with optimal follow-up will hopefully bring clarity in these issues.
18.4.2
Target Delineation: Biological Information
Besides the location, size and extent of the tumour, knowledge about biological features of the tumour might be useful in the management of head and neck cancer. Treatment selection may be based on this information, dose-painting can be applied, or response prediction can be extrapolated from these data.
The concept of biological target volume (BTV) was therefore introduced (Ling et al. 2000). This implies the integration of physical and biological conformality, leading to multidimensional conformal radiotherapy. The concept of gross, clinical, and planning target volume (GTV, CTV, and PTV), as proposed by the International Commission on Radiation Units and Measurements Report No. 50 (ICRU 50), is currently used in radiotherapy treatment design. In general, CT, MRI and sometimes FDG-PET are used to delineate the GTV and CTV, and radiation portals are designed to entirely cover the volumes and deliver a uniform dose distribution to it. Recent interest has been developed to create nonuniformity within the targets, more specifically to increase dose to certain tumour subregions in order to increase local control (so-called dose-painting). IMRT has the ability to deliver nonuniform dose distributions, but the question remains how to track the regions of interest. Therefore, there has been a lot of interest in developing imaging modalities to deliver molecular and biological information regarding hypoxia, proliferation, apoptosis, angiogenesis and receptor status of tumours (Chapman et al. 2003). Biological imaging can be of value, but still a lot of research and clinical studies are needed before this can be realized in clinical routine.

354 |
S. Nuyts |
18.4.2.1 Hypoxia
Hypoxia is believed to be a major determinant in tumour response to radiation and their subsequent outcome. Hypoxic cells are 2.5–3 times more resistant to ionising irradiation than well-oxygenated cells. Identifying and quantifying tumour hypoxia may predict outcome and identify patients who could benefit from more aggressive radiotherapy to overcome the hypoxic effect. Escalating the dose to these tumour regions might improve outcome. A variety of methods have been used to measure oxygenation of tumours. Clinical studies have been performed using polarographic needle electrodes (Eppendorf, Hamburg, Germany) (e.g. Nordsmark and Overgaard 2004). This, however, is an invasive technique and no discrimination is possible between necrotic tissue and viable hypoxic tissue. Moreover, the presence of tumour heterogeneity prompts the question as to whether these measurements are representative for the entire tumour.An additional drawback is the fact that this technique is only useful for accessible tumours by electrodes. Other noninvasive techniques have gained interest in recent years.
Tumour perfusion and tumoral oxygen concentration are factors that are usually strongly linked, although tumour oxygenation also depends on oxygen consumption by the tumour cells. The tumour perfusion rate can be determined noninvasively by dynamic CT. Hermans et al. (2003) used dynamic CT in 105 patients, treated with radiotherapy, to determine the rate of tumour perfusion. Therefore, a contrast agent bolus was rapidly injected i.v., while during the first pass a dynamic data acquisition was performed at the level of the largest axial tumour slice. The perfusion was calculated by using the time-density curve of the tumour and the maximal value in arterial density. When the patients were stratified according to the median perfusion value, those with lower perfusion rate had a significantly higher local failure rate. The authors concluded that CT-determined tumour perfusion rate was an independent predictor of local outcome in irradiated HNC.
Tissue perfusion can be estimated using MRI from the increase in the T1 signal after the bolus administration of a gadolinium-based contrast medium. Echo-planar dynamic imaging (EPI) can track the uptake of the contrast agent using fast pulse sequences. The derived parametric image can yield pixel by pixel information on blood volume, blood perfusion, diffusion, extravascular space, etc. These techniques can be applied to assess tumour grade and type, treatment
response and prognosis. Hoskin et al. (1999) used dynamic contrast enhanced MRI in 13 patients with advanced HNC before and after completion of radiotherapy. The authors found that tumours with diminished tumour perfusion at the end of therapy are those most sensitive to radiotherapy and that those tumours which show greater tumour enhancement after radiotherapy are likely to fail locally. Schmitt et al. (2003) used noninvasive MR spin-labeling techniques to quantify tissue perfusion in HNC patients before and during radiation therapy. Ten patients were examined before radiotherapy, five of them were investigated twice during radiotherapy. In four of five patients studied at the start and end of radiotherapy, perfusion decreased, while in one patient there was an increase. Tumours with high initial perfusion tended to be smaller in size and showed a better response than those showing weak pre-treatment perfusion. Tissue oxygen levels can be assessed noninvasively by blood–oxygen level-dependent (BOLD) fMRI (Krishnan et al. 1988; Taylor et al. 2001; Landuyt et al. 2001) This technique is based on the paramagnetic property of deoxygenated hemoglobin that induces magnetic inhomogeneities, enhances the relaxation of the adjacent water molecules, and thereby decreases the T2* signal adjacent to the blood vessels. Studies by Kaanders et al. (2002) showed that treatment results in advanced HNC can be improved by accelerated radiotherapy with carbogen breathing (a hyperoxic hypercapnic gas mixture) and nicotinamide (ARCON). The mechanism of action of carbogen and nicotinamide is thought to be an increase in tumour oxygenation and thus a reduction of hypoxic regions in the tumour. Rijpkema et al. (2002) investigated tumour vascularity and oxygenation by dynamic gadolinium contrast-enhanced MRI and BOLD MRI, respectively, in 11 HNC patients. Patients were investigated twice, with and without breathing the hyperoxic hypercapnic gas mixture. BOLD MRI revealed a significant increase of the MRI time constant of transverse magnetization decay (T2*) in the tumour during hypercapnic hyperoxygenation, which correlates to a decrease of the deoxyhemoglobin concentration. No changes in overall tumour vascularity were observed, as measured by the gadolinium contrast uptake rate in the tumour. Multiple gradient-echo MRI may thus be an important tool for the assessment of the local oxygenation status of tumours and may assist in the prediction of responses to therapy.
PET scanning can be used to identify and quantify hypoxia in solid tumours. Several tracers have been tested so far, both imidazole and non-imidazole containing agents. 18F fluorinated misonidazole (FMISO)

Use of Imaging Data in Radiotherapy Planning of Head and Neck Cancer |
355 |
and 123I-arabinoside act as bioreductive molecules which are reduced and incorporated into the cells under hypoxic conditions (Chapman et al. 1983; Koh et al. 1992). In a study of Rasey et al. (1996), using FMISO-PET, 36 of the 37 patients investigated had hypoxic regions, with fractional hypoxic volumes of 9%. Eschmann et al. (2005) compared the uptake of FMISO of HNC with clinical outcome after treatment. A total of 26 patients with HNC were scanned before radiotherapy and FMISO uptake was quantified using standardized uptake values (SUV) and tumour- to-background ratios. The authors found that patients with local recurrence could be separated from disease-free patients by SUV 4h after injection (all recurrences had SUV>2). All patients with tumour- to-muscle ratio>1.6 presented with tumour recurrence. The authors also found that the activity curve of FMISO was prognostic: tumours with a rapid washout showed no recurrences in contrast to tumours with an accumulation curve. However, FMISO distribution over timed seemed not to be constant. As a consequence, tumour regions defined as hypoxic on the basis of the cutoff values shifted. If one wants to use these data for radiotherapy planning, regional kinetic analysis that takes into account early as well as late FMISO data are needed.
Newer generations of nitroimidazoles have been studied including 18F-labeled fluoroerythronitroimidazole (FETNIM), fluoroetanidazole (FETA) and 2-(2-nitro-1[H]-imidazol-1-yl)-N-(2,2,3,3,3-pen- tafluoropropyl)-acetamide (EF5). FETNIM and FETA are both more stable to non-oxygen dependent metabolism and have higher tumour-to-background contrast secondary to their increased hydrophilicity (Yang et al. 1995; Lehtio et al. 2001; Rasey et al. 1999). EF5 has already been used for immunohistochemical detection of hypoxia, creating the opportunity to correlate PET findings with immunohistochemistry (Ziemer et al. 2003). A possible drawback of EF5 is the low tumour-to-background ratio due to nonspecific binding caused by its lipophilic nature. FETNIM has already been used clinically to determine the oxygenation status of HNC in patients undergoing radiotherapy. Lehtio et al. (2004) studied 21 patients who underwent multitracer PET scans with FETNIM to evaluate the oxygenation status and [15O2] H2O to measure the blood flow. PET findings were correlated with the radiotherapy outcome and survival. The authors concluded that tumours with a high blood flow were associated with poor survival. A high FETNIM tumour/plasma ratio or fractional hypoxic volume had no significant relationship with survival in this small series.
Other non-imidazole agents like 62Cu-diacetylbis (N-4-methyl-thiosemicaarbazone; Cu-ATSM) are being evaluated. Cu-ATSM is a potentially good marker for hypoxia because of its rapid uptake, activity ratio, rapid blood clearance and washout from normally oxygenated cells. Chao et al. (2001) examined the feasibility of dose-escalation to hypoxic areas using IMRT by co-registration of Cu-ATSM PET to CT images for treatment planning. This planning study showed that 80 Gy could be delivered in 35 fractions to the hypoxic target volume, with 70 Gy in 35 fractions delivered to the rest of the clinical target volume.
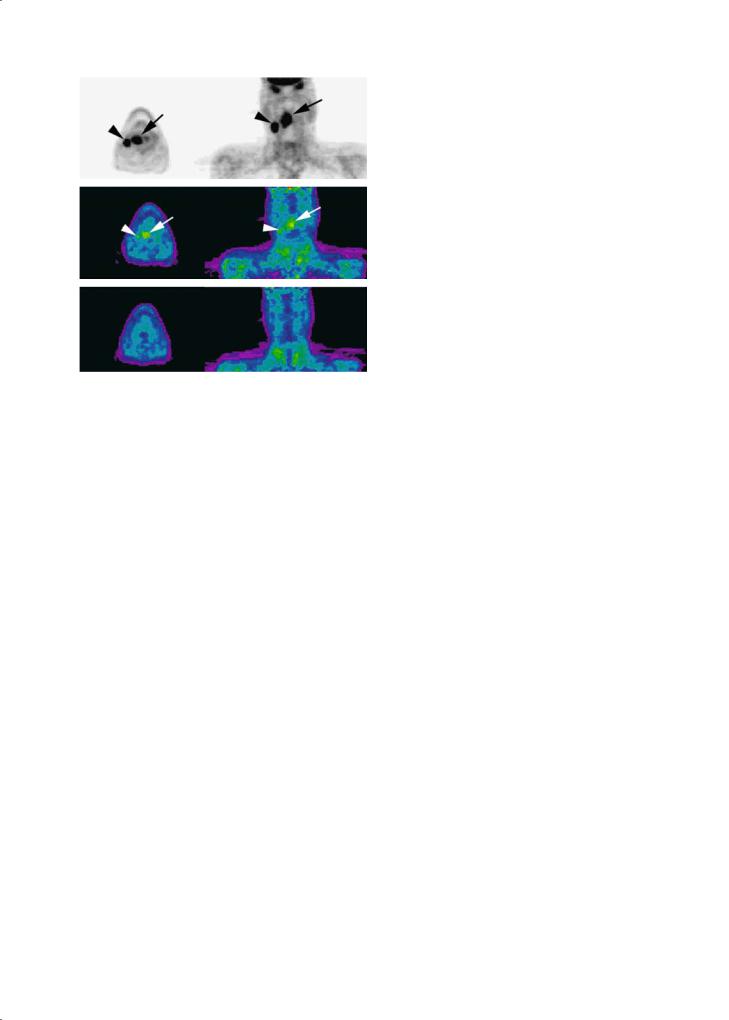
However, temporal stability might be a concern for hypoxia imaging. Intermittent opening and closure of vessels can cause microscopic changes in oxygenation, so-called acute hypoxia (Chaplin et al. 1986). In addition, reoxygenation of hypoxic regions occurs during the 6- to 7-week period of fractionated radiotherapy. Studies on the temporal stability of tumour hypoxia mapping are therefore necessary (Fig. 18.5).
Although these new tracers have promise, much more work remains to be done before they can be used to influence treatment decisions for these patients. The difficult challenge is to validate the correlation with marker uptake and the presence of viable hypoxic cells. This validation is difficult, however, because no gold standard for measuring these tumour properties exists.
18.4.2.2 Proliferation
Uncontrolled proliferation is one of the hallmarks of cancer. Imaging the amount of proliferation may be predictive for tumour response, and regions of high cell proliferation may benefit from dose escalation. Slowly proliferating tumours generally show less FDG uptake than rapidly proliferating tumours. FDG uptake in cells, however, is not an absolutely specific measure of tumour growth or proliferative activity, because regions of inflammation, musculature, are known to take up FDG. Because of this, more specific tracers have been studied. Radiolabeled nucleosides can be used to quantify DNA synthesis and radiolabeled amino acids to infer protein synthesis. The most studied nucleoside tracers is 18F-labeled fluorothymine (FLT), a pyrimidine analogue, which measures indirectly DNA synthesis via the DNA salvage pathway. FLT has high specific activity and good tumour-to-background ratio (Shields et al. 1998). Cobben et al. (2004) studied the use of FLT-PET for visualization of laryngeal cancer in 21 patients and
356 |
S. Nuyts |
|
umes were significantly smaller than CT. They con- |
|
cluded that MET-PET does not have any additional |
|
value since MET volumes are not different from CT |
|
volumes, probably because of the high uptake of MET |
|
by the normal mucosa and salivary glands surround- |
a |
ing the tumour. |
Another indicator of proliferation is an increased |
|
|
level of choline in cells. 1H MR-spectroscopy can be |
|
used to estimate choline levels in human tumours. |
|
This procedure has already been successfully used |
|
to localize active disease sites within the prostate |
|
(Kurhanewicz et al. 1996), but data on HNC are |
b |
missing. |
|
18.4.2.3 |
|
Apoptosis |
c
Fig. 18.5a–c. Temporal change in hypoxia.A 57-year-old patient presented with a squamous cell carcinoma of the oropharynx, stage T3N2b. A base-line FDG-PET (a) shows uptake at the primary tumour (black arrow) and regional adenopathy (black arrowhead). A FMISO-PET (b) was acquired 1 day later and shows uptake both in the primary tumour (white arrow) and the adenopathy (white arrowhead), demonstrating the presence of hypoxia. The repeat FMISO-PET after 4 weeks of radiotherapy (c) shows a loss in the FMISO uptake suggesting a temporal change in hypoxia
compared these data with FDG-PET. The authors detected an equal amount of tumours with FLT and FDG-PET. In laryngeal cancer, they detected a higher uptake of FDG than FLT. Therefore, the authors concluded that FLT-PET seems less adequate for the detection of laryngeal cancer but further research is warranted. Sensitivity of FLT imaging, however, is not optimal because DNA synthesis is not as robust as glucose uptake and less tracer is taken up (Buck et al. 2003).
The most studied amino acid tracers are 11C-me- thionine (MET) and 11C-tyrosine. One advantage of using amino acid tracers over FDG is that they can better discriminate between tumour and inflammatory tissue because inflammatory cells have lower protein metabolism than glucose metabolism (Kubota et al. 1995). Geets et al. (2004) studied the role of MET-PET for the delineation of the tumour volume in pharyngolaryngeal squamous cell carcinoma. In all, 23 patients received CT, FDG-PET and MET-PET before treatment (radiotherapy or surgery). The authors found that the MET volumes did not differ from the CT volumes, while the FDG vol-
Apoptosis can be a marker for radiosensitivity and prognosis for radiotherapy treatment outcome because apoptosis is a major form of cell death after ionising irradiation. Annexin V binds to membranebound phosphatidyl serine and is selectively exposed on the surface of cells as they undergo apoptosis. 99mTc-radiolabeled annexin V is therefore being tested to measure apoptosis (Green and Steinmetz 2002). Annexin accumulation has been imaged successfully using 99mTc-SPECT and near infrared fluorescence (NIRF) in several tumoral sites. van de Wiele et al. (2003) performed a quantitative tumour apoptosis imaging using 99mTc-radiolabeled annexin V and SPECT. A total of 20 patients with HNC underwent CT, 99mTc-radiolabeled annexin V SPECT and subsequent surgical resection. Quantitative 99mTc-ra- diolabeled annexin V tumour uptake values correlated well with the number of apoptotic cells derived from TUNEL assays (detects apoptosis-induced DNA fragmentation), if only tumour samples with no or minimal amounts of necrosis are considered. The authors conclude that radiolabeled annexin V can be used to monitor treatment response, if the treatment does not alter the diffusion-related uptake of the peptides. 99mTc-radiolabeled annexin V scintigraphy has already been used successfully in monitoring radiation-induced apoptotic cell death in follicular lymphoma patients (Haas et al. 2004). Data on HNC are missing.
18.4.2.4
Receptor Status/Molecular Imaging
Proliferation of certain tumours is regulated by growth factors and hormones that bind to membrane or intracellular receptors to activate signal

Use of Imaging Data in Radiotherapy Planning of Head and Neck Cancer |
357 |
transduction pathways. In vivo imaging of the receptor status might provide relevant information concerning prognosis and choice of therapy. One example is epidermal growth factor receptor (EGFr) imaging using SPECT and NIRF optical imaging. EGFr is a transmembrane glycoprotein involved in activating several pathways associated with proliferation, migration, stromal invasion, angiogenesis and resistance to cell death-inducing signals (Dancey 2004). EGFR is overexpressed in nearly all HNC (80%–100%) (Grandis et al. 1996), and this overexpression is associated with both increased metastatic potential and poor prognosis (Ang et al. 2002). Optical contrast agents to visualise EGFr are under development.
18.4.3
Treatment Verification
Treatment guiding and verification refer to the use of imaging to ensure that the field of irradiation is appropriate throughout the entire treatment period, taking into consideration factors such as changes in tumour size and shape, patient positioning and organ movement. Today, the treatment fields are routinely verified using the accelerator beam and conventional film or, in modern systems, using 2D electronic portal image detectors (EPID) as detectors (Fig. 18.3). As with portal films, electronic portal images are compared with some reference image. The latter can be a digitized simulator film or a digitally reconstructed radiograph in case of 3D treatment planning. Recently, cone beam CT has been introduced for verification of treatment fields in 3D view. To create these fields, an extra tube is mounted on the accelerator producing a divergent X-ray beam, which is captured using a portal detector, opposed to the CT tube. Both make a 360° rotation around the patient. This allows a 3D visualisation of the treatment field in relation to organs of interest.
Recently, the next generation in radiation oncology has been developed, called four-dimensional (4D) conformal radiotherapy (CRT), a logical regression from 3D-CRT. During a course of radiotherapy, when successful, tumours shrink. Patients may also lose weight which will further alter their geometry and dosimetry (Barker et al. 2004). 4D CRT accounts for these geometrical changes. In radiotherapy, spatio-temporal instability of target and normal structures, and/or geometric uncertainty of patient positioning are one of the reasons for treatment failure. Especially in sophisticated radiotherapy such as
IMRT, devices and methods of increasing precision and accuracy are needed. Latest generation linear accelerators are therefore equipped with CT and/or fluoroscopy modes. A CT-based image guidance system can visualize soft-tissue structures while fluoroscopy can be used to track fiducial markers e.g. during breathing. The recent development of megavoltage cone beam CT (MVCT) will allow the reconstruction of the actual daily-delivered dose based on patient’s anatomy in real time (Pouliot et al. 2003; Ghilezan et al. 2004). By acquiring a low-dose megavoltage CT image on the treatment machine immediately prior to therapy, the patient position – including soft tissue anatomy – can in principle be verified on-line. The same imaging device can then be used to record the portal dose during treatment. By converting this portal dose to primary fluence at the plane of the detector and back projecting through the MVCT model of the patient, the 3D dose delivered at the time of treatment can be obtained. This may lead to ‘adaptive radiotherapy’ with modulation of prescription and delivery based on the actual delivered dose, as opposed to planned dose (Welsh et al. 2002). Further studies are ongoing to optimize MVCT imaging and better define its utility in patients.
18.5
Conclusion and Future Challenges
The use of multimodality imaging, both anatomical and functional, has already led in several cancer centers to improved staging of disease, as well as to improved treatment planning, by better dose delivery to GTV while sparing critical normal structures. The development of imaging markers associated with prediction of radioresistance and/or outcome could impact significantly on treatment planning. Such information could be used in the (near) future to design conformal dose distributions, ‘paint’ additional dose to specific tumour regions, or rationally describe adjuvant therapy targeted to specific tumour phenotype and genotype.
The ability to predict the ultimate outcome early in treatment would have tremendous implications for patients. Functional imaging could identify nonresponders early, which allows for a switch in therapy.
There still remain some hurdles to be overcome, including imaging pathological validation, timing of post-treatment imaging, and accounting for spatial and temporal tumour motion during radiation therapy.

358
However, we must keep in mind that no single imaging modality can provide us the entire picture of tumour profiling. Anatomical and functional imaging fusion will be essential. Knowledge about the capabilities and especially limitations of all the imaging modalities remains essential in their clinical use.
References
Adams S, Baum RP, Stuckensen T, et al. (1998) Prospective comparison of 18F-FDG PET with conventional imaging modalities (CT, MRI, US) in lymph node staging of head and neck cancer. Eur J Nucl Med 25:1255–1260
Ang KK, Berkey BA, Tu X, et al. (2002) Impact of epidermal growth factor receptor expression on survival and pattern of relapse in patients with advanced head and neck carcinoma. Cancer Res 62:7350–7356
Barker JL Jr, Garden AS, Ang KK,, et al. (2004) Quantification of volumetric and geometric changes occurring during fractionated radiotherapy for head-and-neck cancer using an integrated CT/linear accelerator system. Int J Radiat Oncol Biol Phys 59:960–970
Benchaou M, Lehmann W, Slosman DO, et al. (1996) The role of FDG-PET in the preoperative assessment of N-staging in head and neck cancer. Acta Otolaryngol 116:332–335
Brink I, Kleznr T, Krause T, et al. (2002) Lymph node staging in extracranial head and neck cancer with FDG PET-appro- priate uptake period and size-dependence of the results. Nuklearmedizin 41:108–113
Buck AK, Halter G, Schirrmeister H, et al. (2003) Imaging proliferation in lung tumors with PET: 18F-FLT versus 18F-FDG. J Nucl Med 44:1426–1431
Chao C, Bosch WR, Mutic S, et al. (2001) A novel approach to overcome hypoxic tumor resistance: Cu-ATSM-guided intensity-modulated radiation therapy. Int J Radiat Oncol Biol Phys 49:1171–1182
Chao C, Wippold FJ, Ozyigit G, et al. (2002) Determination and delineation of nodal target volumes for head-and-neck cancer based on patterns of failure in patients receiving definitive and postoperative IMRT. Int J Radiat Oncol Biol Phys 53:1174–1184
Chaplin DJ, Durand RE, Olive PL (1986) Acute hypoxia in tumors: implications for modifiers of radiation effects. Int J Radiat Oncol Biol Phys 12:1279–82
Chapman JD, Baer K, Lee J (1983) Characteristics of the metab- olism-induced binding of misonidazole to hypoxic mammalian cells. Cancer Res 43:1523–1528
Chapman JD, Bradley JD, Eary JF, et al. (2003) Molecular (functional) imaging for radiotherapy applications: an RTOG symposium. Int J Radiat Oncol Biol Phys 55:294–301
Chung N, Ting L, Hsu W, et al. (2004) Impact of magnetic resonance imaging versus CT on nasopharyngeal carcinoma: primary tumor target delineation for radiotherapy. Head Neck 26:241–246
Ciernik FI, Dizendorf E, Baumert B, et al. (2003) Radiation treatment planning with an integrated positron emission and computer tomography (PET/CT):a feasibility study. Int J Radiat Oncol Biol Phys 57:853–863
Cobben DCP, van der Laan BFAM, Maas B, et al. (2004) 18F-FLT
S. Nuyts
PET for visualization of laryngeal cancer: comparison with 18F-FDG PET. J Nuclear Med 45:226–231
Daisne JF, Sibomana M, Bol A, et al. (2003) Evaluation of a multimodality image (CT, MRI and PET) coregistration procedure on phantom and head and neck cancer patients: accuracy, reproducibility and consistency. Radiother Oncol 69:237–245
Daisne JF, Duprez T, Weynant B, et al. (2004) Tumor volume in pharyngolaryngeal squamous cell carcinoma: comparison at CT, MR imaging, and FDG PET and validation with surgical specimen. Radiology 233:93–100
Dancey J (2004) Epidermal growth factor receptor inhibitors in clinical development. Int J Radiat Oncol Biol Phys 58:1003–1007
Eisbruch A, Foote RL, O’Sullivan B, et al. (2002) Intensitymodulated radiation therapy for head and neck cancer: emphasis on the selection and delineation of the targets. Sem Radiat Oncol 12:238–249
Enami B, Sethi A, Petruzelli GJ (2003) Influence of MRI on target volume delineation and IMRT planning in nasopharyngeal carcinoma. Int J Radiat Oncol Biol Phys 57:481– 488
Eschmann S, Paulsen F, Reimold M, et al. (2005) Prognostic impact of hypoxia imaging with 18F-misonidazole PET in non small lung cancer and head and neck cancer before radiotherapy. J Nucl Med 46: 253–260
Geets X, Daisne JF, Gregoire V, et al. (2004) Role of 11-C-methio- nine positron emission tomography for the delineation of the tumor volume in pharyngo-laryngeal squamous cell carcinoma: comparison with FDG-PET and CT. Radiother Oncol 71:267–273
Gambhir SS, Czernin J, Schwimmer J, et al. (2001) A tabulated summary of the FDG PET literature. J Nucl Med 42:1S– 93S
Ghilezan M, Yan D, Liang J, et al. (2004) Online image-guided intensity-modulated radiotherapy for prostate cancer: How much improvement can we expect? A theoretical assessment of clinical benefits and potential dose escalation by improving precision and accuracy of radiation delivery. Int J Radiat Oncol Biol Phys 60:1602–1610
Grandis JR, Melhem MF, Barnes El, et al. (1996) Quantitative immunohistochemical analysis of transforming growth factor-alpha and epidermal growth factor receptor in patients with squamous cell carcinoma of the head and neck. Cancer 78:1284–1292
Green AM, Steinmetz ND (2002) Monitoring apoptosis in real time. Cancer J 8:82–92
Gregoire V, Levendag P, Ang KK, et al. (2003) CT-based delineation of lymph node levels and related CTVs in the nodenegative neck: DAHANCA, EORTC, GORTEC, NCIC, RTOG consensus guidelines. Radiother Oncol 69:227–236
Haas RLM, De Jong D, Valdes Olmos R, et al. (2004) In vivo imaging of radiation-induced apoptosis in follicular lymphoma patients. Int J Radiat Oncol Biol Phys 59:782–787
Hermans R, Feron M, Bellon E, et al. (1998) Laryngeal tumor volume measurements determined with CT: a study on intraand interobserver variability. Int J Radiat Oncol Biol Phys 40:553–557
Hermans R, Meijerink M, Van den Bogaert W, et al. (2003) Tumor perfusion rate determined noninvasively by dynamic computed tomography predicts outcome in head- and-neck cancer after radiotherapy. Int J Radiat Oncol Biol Phys 57:1351–1356

Use of Imaging Data in Radiotherapy Planning of Head and Neck Cancer |
359 |
Hoskin PJ, Saunders MI, Goodchild K, et al. (1999) Dynamic contrast enhanced magnetic resonance scanning as a predictor of response to accelerated radiotherapy for advanced head and neck cancer. Br J Radiol 72:1093–1098
Kaanders JHAM, Pop LA, Marres HAM, et al. (2002) ARCON: experience in 215 patients with advanced head-and-neck cancer. Int J Radiat Oncol Biol Phys 52:769–778
Koh WJ, Rasey JS, Evans ML, et al. (1992) Imaging of hypoxia in human tumors with [F-18] fluoromisonidazole. Int J Radiat Oncol Biol Phys 22:1299–212
Koshy M, Paulino AC, Howell R, et al. (2005) F-18 FDG PET-CT fusion in radiotherapy treatment planning for head and neck cancer. Head Neck 27:494–502 (epub ahead of print)
Krishnan L, Krishnan EC, Jewell WR (1988) Immediate effect of irradiation on microvasculature. Int J Radiat Oncol Biol Phys 15:147–50
Kubota R, Kubota K, Yamada S, et al. (1995) Methionine uptake by tumor tissue: a microautoradiographic comparison with FDG. J Nucl Med 36:484–492
Kurhanewicz J, Vigneron DB, Hricak H, et al. (1996) Threedimensional H-1 MR spectroscopic imaging of the in situ human prostate with high (0.24-0.7-cm3) spatial resolution. Radiology 198:795–805
Landuyt W, Hermans R, Bosmans H, et al. (2001) BOLD contrast fMRI of whole rodent tumour during air or carbogen breathing using echo-planar imaging at 1.5T. Eur Radiol 11:2332–2340
Laudenbacher C, Saumweber D, Wagner-Manslau C, et al. (1995) Comparison of fluorine-18-deoxyglucose PET, MRI and endoscopy for staging head and neck squamous-cell carcinomas. J Nucl Med 36:1747–1757
Lehtio K, Oikonen V, Gronroos T, et al. (2001) Imaging of blood flow and hypoxia in head and neck cancer: initial evaluation with 15OH2O and 18F fluoroerythonitroimidazole PET. J Nucl Med 42:1643–1652
Lehtio K, Eskola O, Viljanen T, et al. (2004) Imaging perfusion and hypoxia with PET to predict radiotherapy response in head-and-neck cancer. Int J Radiat Oncol Biol Phys 59:971–982
Ling CC, Humn J, Larson S, et al. (2000) Towards multidimensional radiotherapy (MD-CRT): biological imaging and biological conformality. Int J Radiat Oncol Biol Phys 47:551–560
Nishioka T, Shiga T, Shirato H, et al. (2002) Image fusion between 18FDG-PET and MRI/CT for radiotherapy planning of oropharyngeal and nasopharyngeal carcinomas. Int J Radiat Oncol Biol Phys 53:1051–1057
Nordsmark M, Overgaard J (2004) Tumor hypoxia is independent of hemoglobin and prognostic for loco-regional tumor control after primary radiotherapy in advanced head and neck cancer. Acta Oncol 43:396–403
Paulino AC, Koshy M, Howell R, et al. (2005) Comparison of CTand FDG-PET-defined gross tumor volume in inten- sity-modulated radiotherapy for head-and-neck cancer. Int J Radiat Oncol Biol Phys 61:1385–1392
Pouliot J, Xia P, Langen K, et al. (2003) Dose-guided radiation therapy using low-dose megavoltage con-beam CT.
In 44th Annual AAPM Annual Meeting. San Diego, CA. Med Phys
Rasey JS, Koh WJ, Evans ML, et al. (1996) Quantifying regional hypoxia in human tumors with positron emission tomography of 18F fluoromisonidazole: a pretherapy study of 37 patients. Int J Radiat Oncol Biol Phys 36:417–428
Rasey JS, Hofstrand PD, Chin LK, et al. (1999) Characterization of 18F fluoroetanidazole, a new radiopharmaceutical for detecting tumor hypoxia. J Nucl Med 40:1072–1079
Rash C, Keus R, Pameijer FA, et al. (1997) The potential impact of CT-MRI matching on tumor volume delineation in advanced head and neck cancer. Int J Radiat Oncol Biol Phys 39:841–848
Rijpkema M, Kaanders JHAM, Joosten FBM, et al. (2002) Effects of breathing a hyperoxic hypercapnic gas mixture on blood oxygenation and vascularity of head-and-neck tumors as measured by magnetic resonance imaging. Int J Radiat Oncol Biol Phys 53:1185–1191
Scarfone C, Lavely WC, Cmelak AJ, et al. (2004) Prospective feasibility trial of radiotherapy target definition for head and neck cancer using 3-dimensional PET and CT imaging. J Nucl Med 45:543–552
Schmitt P, Kotas M, Tobermann A, et al. (2003) Quantitative tissue perfusion measurements in head and neck carcinoma patients before and during radiation therapy with a non-invasive MR imaging spin-labeling technique. Radiother Oncol 67:27–34
Schwartz DL, Ford EC, Rajendran J, et al. (2005) FDG-PET/ CT imaging for preradiotherapy staging of head-and-neck squamous cell carcinoma. Int J Radiat Oncol Biol Phys 61:129–136
Shields AF, Grierson JR, Dohmen BM, et al. (1998) Imaging proliferation in vivo with 18F FLT and positron emission tomography. Nat Med 4:1334–1336
Stoeckli SJ, Steinert H, Pfaltz M, et al. (2002) Is there a role for positron emission tomography with 18F-fluorodeoxyglucose in the initial staging of nodal negative oral and oropharyngeal squamous cell carcinoma? Head Neck 24:345–349
Syed R, Bomanji JB, Nagabhushan N, et al. (2005) Impact of combined 18F-FDG PET/CT in head and neck tumours. Br J Cancer 92:1046–1050
Taylor NJ, Baddeley H, Goodchild KA, et al. (2001) BOLD MRI of human tumor oxygenation during carbogen breathing. J Magn Reson Imaging 14:156–163
Van de Wiele C, Lahorte C, Vermeersch H, et al. (2003) Quantitative tumor apoptosis imaging using Technetium-99m- HYNIC Annexin V single photon emission computed tomography. J Clin Oncol 21:3483–3487
Welsh JS, Patel RR, Ritter MA, et al. (2002) Helical tomotherapy: an innovative technology and approach to radiation therapy. Technol Cancer Res Treat 1:311–316
Yang DJ, Wallace S, Cherif A, et al. (1995) Development of F- 18-labeled fluoroerythonitroimidazole as a PET agent for imaging tumor hypoxia. Radiology 194:795–800
Ziemer LS, Evans SM, Kachur AV, et al. (2003) Noninvasive imaging of tumor hypoxia in rats using 2-nitroimidazole 18F-EF5. Eur J Nucl Med Mol Imaging 30:259–266

Subject Index
Subject Index
A |
|
|
|
|
|
|
|
|
abscess |
|
|
|
|
|
|
|
|
– lymph node |
295 |
|
|
|
|
|
||
– parapharyngeal |
174 |
|
|
|
|
|||
– prelaryngeal |
50 |
|
|
|
|
|
||
acinic cell carcinoma |
12 |
|
|
|
||||
acquired immunodeficiency syndrome (AIDS) |
324 |
|||||||
adenocarcinoma |
73, 182, 191, 202, 222, 231, 260 |
|
||||||
– intestinal-type (ITAC) |
|
4, 202 |
|
|
||||
adenocarcinoma not otherwise specified (NOS) |
13 |
|||||||
adenoid cystic carcinoma |
12, 56, 73, 86, 122, 140, 159, 167, |
|||||||
182, 197, 202, 231 |
|
|
|
|
|
|
||
adenolymphoma |
12 |
|
|
|
|
|
||
adjacent sign |
60 |
|
|
|
|
|
|
|
ameloblastoma |
203 |
|
|
|
|
|
||
– mandibular |
182 |
|
|
|
|
|
||
angiomatous polyp |
208 |
|
|
|
|
|||
angiosarcoma |
74 |
|
|
|
|
|
|
|
anosmia 20 |
|
|
|
|
|
|
|
|
antrochoanal polyp |
200, 208 |
|
|
|||||
apoptosis |
356 |
|
|
|
|
|
|
|
apparent diffusion coefficient (ADC) 40, 221 |
|
|||||||
arterial malformations |
107 |
|
|
|||||
atypical mycobacterial infection |
295 |
|
||||||
B |
|
|
|
|
|
|
|
|
barium swallow 31 |
|
|
|
|
|
|||
basal cell carcinoma |
296 |
|
|
|||||
baseline study |
69, 138 |
|
|
|
|
|||
beam’s eye view display |
|
347 |
|
|
||||
biological target volume (BTV) |
353 |
|
||||||
blood oxygen level dependent (BOLD)-MRI 62, 354 |
||||||||
brain invasion |
195 |
|
|
|
|
|
||
brainstem encephalopathy 158 |
|
|
||||||
branchial apparatus anomaly 167 |
|
|||||||
branchial cleft abnormality |
|
|
||||||
– first 230 |
|
|
|
|
|
|
|
|
branchial cleft cyst |
230 |
|
|
|
|
|||
breast cancer |
77 |
|
|
|
|
|
|
|
bronchogenic carcinomas |
90 |
|
|
|||||
brown tumors |
287 |
|
|
|
|
|
||
C |
|
|
|
|
|
|
|
|
calcitonin |
282, 285 |
|
|
|
|
|
||
carcinoma in situ |
5 |
|
|
|
|
|
||
carotid artery invasion |
136, 304 |
|
|
|||||
cartilage involvement |
48, 49, 61, 62, 92 |
|
||||||
Castleman’s disease |
295 |
|
|
|||||
cat scratch disease |
295 |
|
|
|
|
|||
cementifying fibroma |
214 |
|
|
|||||
cephalocele |
259 |
|
|
|
|
|
|
|
cerebral edema |
157 |
|
|
|
|
|
||
361
cervical lymph nodes |
|
|
||||
– levelling system |
18 |
|
|
|||
Cheson criteria |
316 |
|
|
|||
cholesteatoma |
|
|
|
|
||
– congenital |
263 |
|
|
|
||
cholesterol granuloma |
264 |
|
||||
chondroma |
74, 210, 257 |
|
||||
chondrosarcoma |
74, 194, 210, 247, 260 |
|||||
clinical target volume (CTV) |
347 |
|||||
colonic interposition |
97 |
|
||||
cone beam CT |
357 |
|
|
|||
conformal radiation therapy |
338, 346 |
|||||
– four-dimensional (4D) 357 |
|
|||||
cranial nerve paralysis |
191 |
|
||||
craniofacial resection |
215 |
|
||||
Crosti’s syndrome |
327 |
|
||||
cylindroma |
73 |
|
|
|
|
|
D |
|
|
|
|
|
|
denervation atrophy |
148, 178, 197 |
|||||
dermoid cysts |
108, 110, 230 |
|
||||
dermoid tumors |
|
254 |
|
|
||
desmoid fibromatosis |
182 |
|
||||
diffusion-weighted (DW) MRI |
40, 225, 230, 234, 251 |
|||||
diplopia |
20 |
|
|
|
|
|
dose-painting |
353 |
|
|
|||
dural invasion |
195, 215 |
|
||||
dynamic maneuvers |
36 |
|
||||
dysplasia |
5 |
|
|
|
|
|
E |
|
|
|
|
|
|
electronic portal imaging (EPI) |
348 |
|||||
encephalocele |
|
|
|
|
|
|
– nasal |
205 |
|
|
|
|
|
encephalomalacia |
158 |
|
|
|
||
endolymphatic sac tumors |
260 |
|
||||
endoscopic evaluation |
21 |
|
|
|||
eosinophilic granuloma |
253 |
|
||||
ependymomas |
181 |
|
|
|
||
epidermoid cyst |
108, 110, 230 |
|
||||
epistaxis |
20 |
|
|
|
|
|
Epstein-Barr virus (EBV) |
3, 4, 143, 312, 326 |
|||||
erythroplakia |
5 |
|
|
|
|
|
esophageal verge |
81 |
|
|
|
||
esthesioneuroblastoma |
194, 205 |
|||||
ethanol injection |
275 |
|
|
|
||
Ewing sarcoma |
207, 250, 251 |
|
||||
extracapsular spread 154 |
|
|
||||
extralaryngeal spread |
49 |
|
|
|||
extramedullary plasmacytoma |
76, 159, 213, 326 |
|||||
extranodal spread |
303 |
|
|
|
||

362 |
|
|
|
|
|
F |
|
|
|
|
|
facial nerve |
27, 28 |
|
|
|
|
– paralysis |
230 |
|
|
|
|
facial neuralgia |
186 |
|
|
||
fat suppression technique |
39 |
||||
fibrosarcoma |
74, 182, 212 |
|
|||
fibrosis |
|
|
|
|
|
– soft-tissue |
158 |
|
|
|
|
fibrous dysplasia |
183, 213, 252 |
||||
field cancerization |
6 |
|
|
||
fine needle aspiration biopsy (FNAB) 274 |
|||||
fistula 71 |
|
|
|
|
|
flap failure |
71 |
|
|
|
|
flare phenomenon |
339 |
|
|
||
follicular adenoma |
275 |
|
|
||
follow-up imaging |
188 |
|
|
||
G |
|
|
|
|
|
Gardner’s syndrome |
284 |
|
|||
gastric pull-up 96 |
|
|
|
||
gastrointestinal cancer |
77 |
|
|||
geographic miss |
156 |
|
|
||
glomus jugulare tumors |
261 |
||||
Gradenigo’s triad |
247, 265 |
|
|||
Graves’ orbitopathy |
321 |
|
|||
gross tumor volume (GTV) |
338, 347 |
||||
H
Hand-Schüller-Christian disease 253
Hashimoto’s thyroiditis (chronic lymphocytic thyroiditis)
282, 324 |
|
|
hemangioma 113, 140, 173, 208, 228 |
||
hemangiopericytoma 209 |
||
hemangiosarcoma |
182 |
|
hemilaryngectomy |
|
|
– extended |
57, 62, 66 |
|
– vertical |
65 |
|
hemolytic anemia |
250 |
|
high-flow lesions |
107 |
|
Horner’s syndrome |
265 |
|
human immunodeficiency virus (HIV) 3, 230, 295
human papilloma virus |
3 |
|
Hürthle cell adenomas |
8 |
|
Hürthle cell carcinoma |
8, 9 |
|
Hyams’ grading 206 |
|
|
hypoxia |
354 |
|
– tumor |
62 |
|
I
image-guided radiotherapy (IGRT) 345 intensity-modulated radiation therapy (IMRT) 338, 346
internal carotid artery aneurysms |
265 |
|
inverted papilloma |
194, 199 |
|
J |
|
|
juvenile angiofibroma 207 |
|
|
juvenile laryngeal papillomatosis |
4 |
|
juvenile ossifying fibroma (JOF) |
214 |
|
K |
|
|
Kadish classification |
206 |
|
Kaposi’s sarcoma 3, 75
Subject Index
L
Langerhans cell histiocytosis 253 laryngeal necrosis 71 laryngectomy
– frontal 65
– horizontal supraglottic 65
– partial |
57, 62, 65 |
|
||
– supracricoid partial |
66 |
|||
– supraglottic |
58 |
|
||
– total |
66 |
|
|
|
laryngocele |
49, 74 |
|
||
laryngography |
31 |
|
||
leiomyosarcoma |
75, 212 |
|||
Letterer-Siwe disease |
253 |
|||
leukemia 249 |
|
|
||
leukoplakia |
4 |
|
|
|
lingual thyroids |
110 |
|
||
lipoma |
113, 167, 228 |
|
||
liposarcoma |
74, 231 |
|
||
–hypopharyngeal 85 lymphadenitis
–bacterial 295
lymphangioma 173, 228 lymphatic malformations 107 lymphoepithelial cysts 324 lymphoepithelial lesion
– benign |
221, 230 |
|
lymphoma |
1, 32, 86, 173, 249 |
|
– Burkitt |
123, 326 |
|
– extranodal 318 |
||
– Hodgkin |
311 |
|
– MALT 86 |
|
|
– nasopharyngeal |
159 |
|
– non-Hodgkin |
75, 86, 123, 139, 182, 212, 231, 234, 311 |
|
– thyroid |
10, 285, 324 |
|
M
malignant fibrous histiocytoma 74, 182, 212
malignant melanoma |
77, 296, 324 |
||||
– sinonasal 194, 204 |
|
|
|||
malignant Triton tumor |
207 |
|
|||
masseter muscle |
|
|
|
||
– hypertrophy |
178, 183 |
|
|||
McCune-Albright syndrome |
214 |
||||
meningioma |
181, 207, 255 |
|
|||
meningoencephalocele |
259 |
|
|||
metastasis |
77, 203, 204, 249 |
|
|||
– cerebral |
158 |
|
|
|
|
– distant |
150, 155, 335 |
|
|
||
– intraparotid |
231, 324 |
|
|||
micrometastases |
303 |
|
|
||
microvascularisation |
|
|
|||
– tumor |
62 |
|
|
|
|
mucoceles |
259 |
|
|
|
|
– petrous apex |
265 |
|
|
||
mucoepidermoid carcinoma |
4, 12, 73, 86, 123, 140, 167, 182, |
||||
231 |
|
|
|
|
|
– central |
204 |
|
|
|
|
multinodular goitre 7 |
|
|
|||
multiple endocrine neoplasia (MEN) syndromes 9, 276 |
|||||
multiple myeloma |
76, 159, 212, 249, 326 |
||||
multiple osteochondromatosis |
252 |
||||