

Учебники / Head_and_Neck_Cancer_Imaging
.pdfPositron Emission Tomography in Head and Neck Cancer |
331 |
ing device. A positron transverses a few millimetres through the tissue until it combines with an electron in the surrounding media. This generates a pair of photons which travel in nearly opposite directions (180° apart) with an energy of 511 KeV each. These opposed photons can be detected by detector pairs installed in a ring shaped pattern. Photons that simultaneously (i.e. within a predefined time-window) interact with these detectors are registered as decay events. Based on these registrations, tomographic images of the regional radioactivity distribution are reconstructed (emission images).
A typical whole-body FDG-PET scan is started 60– 90 min after the intravenous administration of the radiotracer. The axial field of view of the PET system (10–15 cm) is extended by imaging in multiple bed positions, so as to cover the whole body (Dahlbom et al. 1992). An acquisition time of 3–6 min per bed position after a 5–15 mCi (175–550 MBq) injection of FDG produces images of good resolution and contrast, in a total imaging time of 45–60 min. All current PET systems allow for the correction of softtissue attenuation of the emitted annihilation photons. The attenuation of a given photon depends on the electron density of the tissues which the photon has to cross before hitting the detectors. Therefore, a density map needs to be created by acquiring a set of corresponding tomographic images with an external positron emitting source of radiation (the transmission scanning) The conventional way of obtaining such a transmission scan is time consuming (about 20 min per patient) and yields images with low counting statistics. Using PET-CT technology, the transmission scanning for attenuation correction can be performed using the CT data (Kinahan et al. 1998). The use of high-speed multislice CT systems reduces the data acquisition time to less than 1 min (reducing total image time to about 30 min) and yields much less noisy attenuation correction maps. However, there are some drawbacks of the use of CT for this purpose. The mean energy of the photons used in CT scan (70 KeV) is much lower than the one of the annihilation photons (511 KeV). By this, CT photons are more attenuated by high density objects within the field of view (metallic prosthesis, dental prosthesis, contrast agents). Goerres et al. (2002) have evaluated for instance the detrimental influence of metallic dental work on the quality of the attenuation corrected PET-CT images of the head and neck region. They concluded that non-attenuation corrected PET images should always be reviewed in these patients in order to avoid misinterpretation due to this artefact.
Another pitfall in attenuation correction using CT is the motion artefact resulting from patient or organ movement between the PET emission scan and the CT transmission scan. This happens more frequently in the head and neck or in the extremities where there is greater freedom of motion. The same phenomenon occurs with the motion of the internal organs just above and below the diaphragm during respiration. This leads to an over-or undercorrection of the PET emission data, thereby creating areas of artifactually increased or decreased FDG activity.
The standard patient preparation employed for PET and CT studies is applied to the PET-CT device. Patients receive 150–550 MBq of FDG 45–60 min prior to the start of the image acquisition. After the patient is positioned on the scanner, an initial topogram is acquired. The topogram is used subsequently to define the examination range for the PET-CT image acquisition. The spiral CT scan is performed next. After completion of the CT portion, the scanner bed is moved to the starting position and the emission scan is started. PET-CT machinery provides the means of performing a CT scan of comparable diagnostic quality to what is performed in the radiology departments. For this, however, optimalisation of the CT imaging protocol used in PET-CT is mandatory. Aspects to consider in this regard are the use of intravenous and digestive contrast. Probably the best option is to add a dedicated (high dose) diagnostic CT after the PET-CT (low dose).
Semior fully quantitative assessment of FDG metabolism is often needed, e.g. for the assessment of the metabolic response to an antineoplastic treatment. The most widely used semi-quantitative index of FDG uptake is the standardised uptake value (SUV). For this, the measured tumor radiotracer concentration (Q) is normalised to the injected ac-
tivity (Qinj) and to the body weight (W) of the patient: SUV = (Q×W)/Qinj.. More complex procedures (not
used in daily routine), using kinetic modelling, are necessary to calculate the metabolic rate for glucose (MRgluc; µmoles/min/ml).
17.1.5
General Consideration on the Use of FDG-PET in Head and Neck Cancer
17.1.5.1
Diagnostic Sensitivity
A major limitation of PET is the limited spatial resolution of the imaging tool. For current PET instrumen-

332 |
C. Castaigne et al. |
tations it is approximately 5–8 mm. Due to the partial volume effect, tracer activity in all lesions smaller than two times the spatial resolution of the imaging apparatus is underestimated. Below a threshold lesion diameter (depending on the intensity of tracer accumulation), the tracer uptake will therefore no longer be distinguishable from the background activity, leading to false-negative PET results. It is clear that future technological innovations that optimize the spatial resolution of the imaging method, thus reducing the false-negativity of small lesions, will significantly increase the additional diagnostic value of PET imaging in staging head and neck cancer. However, even with the maximal achievable spatial resolution of PET (around 3–4 mm), micrometastases will always remain underdiagnosed.
17.1.5.2
Diagnostic Specificity
FDG is not a very tumor-specific substance, as the leucocytes and macrophages of inflammatory processes also accumulate the tracer. Benign lesion, such as sinusitis, can show variable intensity of FDG uptake. A strong uptake can be visible after dental infection or surgery. Radiation therapy can cause pharyngitis and esophagitis which can be visible as increased uptake in the mucosal membrane. Those are among the major sources of false-positive diagnoses in the application of FDG-PET in oncology (Strauss 1996). Clinical information, before reporting and integration of the PET findings with other data, is absolutely mandatory to reduce the potentially negative impact of occasional false-positive FDG-PET results on patient management.
In addition, the interpretation of FDG-PET images of the head and neck is particularly difficult because of the presence of multiple sites showing a variable degree of physiological FDG accumulation, such as the salivary glands and the lymphoid tissues (see below). Another pitfall in the interpretation of the PET images in the head and neck region is the physiological FDG uptake of the muscles. Muscular uptake can be seen in the masticator muscles, the tip of the tongue and muscles of the face, the neck and the larynx in nervous patients, and in patients who speak during the FDG uptake phase. This can both mimic or hide tumoral activity. PET-CT enhances the confidence of image interpretation by improving the anatomic localization of PET abnormalities, and reduces the number of equivocal PET interpretations. The patient should be instructed not to speak during the FDG uptake phase; muscular up-
take can be avoided by using premedication such as diazepam.
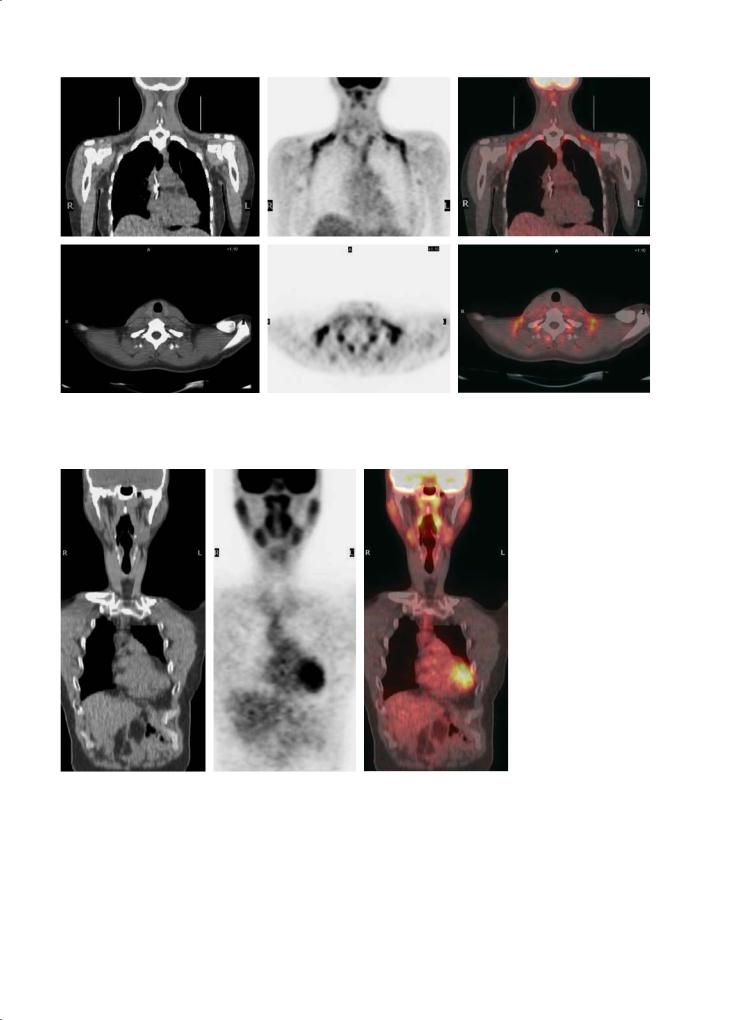
The introduction of PET-CT recently led to the identification of another type of PET image artefact sporadically observed bilaterally in the neck and supraclavicular region, often extending into the anterior mediastinum (Fig. 17.2). These irregular hot spots are located in fat planes identifiable on CT and correspond with an increased FDG uptake in brown adipose tissue (“USA-Fat”). This is most often seen in young female patients and seems related to the ambient temperature of the injection room (Cohade et al. 2003).
17.2
Clinical Applications
17.2.1
Physiological FDG Uptake Distribution in the Head and Neck Region
Familiarity with the complex anatomy of the head and neck is essential for an accurate interpretation of FDG-PET images. The normal uptake of FDG in the extracranial head and neck region was first described by Jabour et al. (1993) using correlation with MRI. Marked physiological FDG activity was seen in the lymphoid tissue of the Waldeyer’s ring (Fig. 17.3). Moderate activity is seen in the salivary glands, which physiologically secrete low amounts of glucose. Other areas of mild to moderate uptake of FDG was seen in the nasal turbinates, the mucosa of the hard and soft palate, and gingiva.
17.2.2
Staging the Primary Tumour
17.2.2.1
Assessment of the Primary Lesion
Patients with squamous cell carcinoma (SCC) of the head and neck most often have a histologic diagnosis before they are referred for PET examination. Contrast-enhanced CT and MRI are routinely used in order to determine the precise localization, size and anatomic extent of the primary lesion. PET alone is not able to reliably assess organ involvement and invasion of a tumor into adjacent structures. More studies are needed to evaluate the potential role of contrast-enhanced PET-CT for this purpose.
Positron Emission Tomography in Head and Neck Cancer |
333 |
Fig. 17.2. FDG uptake in brown fat tissue. Coronal PET images show multiple symmetric foci of increased FDG uptake in supraclavicular and axillary regions without radiologic evidence of disease in those areas. Bilateral paravertebral muscular uptake is also observed
Fig. 17.3. Marked physiological FDG activity in Waldeyer’s ring and in the salivary glands
In the few studies that have addressed the ability of PET and CT/MRI to actually visualize a clinically proven primary tumor, PET generally had the highest sensitivity. This is related to the fact that CT/MRI may occasionally fail to delineate a primary tumor that is submucosal or only superficially spreading. For in-
stance, in a prospective controlled study, Di Martino et al. (2000) compared FDG-PET to CT, ultrasound and panendoscopy for the visualisation of the primary tumor in 37 patients with suspected primary head and neck cancers. FDG-PET had a superior sensitivity (95%) and specificity (92%) compared to CT
334 |
C. Castaigne et al. |
(68% and 69%, respectively) and color-coded duplex sonography (74% and 75%, respectively, in the accessible regions). While sensitivity of panendoscopy was equal to that of PET (95%), its specificity was lower (85%). The high sensitivity of PET for the detection of small laryngeal tumors has been demonstrated by Lowe et al. (1999) in a prospective study including 12 patients with early stage laryngeal cancer (T1, T2). PET detected 11/12 (92%) primary tumor sites. Nine underwent CT, with normal findings in seven patients.
Of special interest are the often intense lesions found on PET in the parotid gland. McGuirt et al. (1995a) reported on the identification by FDG-PET of benign versus malignant parotid masses. PET identified all malignant lesions (sensitivity, 100%) but made the correct categorization between benign and malignant in only 69% of the 26 cases. Six benign lesions (Warthin’s tumors, pleomorphic adenomas and a toxoplasmosis adenopathy) showed false-positive FDG uptake. Therefore, caution is warranted when a positive focal lesion is observed in the parotid salivary gland.
In addition, PET might play a role in patients presenting with a malignant cervical lymph node and an occult primary tumor. PET identifies the unknown primary in 5%–60% of cases, as reported by several authors (Schöder et al. 2004a).
17.2.2.2
Assessment of Lymph Nodes
An important factor in patient assessment, treatment planning, and survival prognostication is accurate staging of the lymph node metastases (Shuller et al. 1984) (Fig. 17.4). Numerous publications have shown that PET has a slightly higher sensitivity and
specificity (70%–100% and 82%–94%, respectively) than contrast-enhanced CT of MRI (58%–88% and 41%–96% respectively) (Schöder et al. 2004a). The increased sensitivity of PET indicates that the technique is able to detect lymph node involvement in non-enlarged lymph nodes. This is important as it has been reported that more than 40 % of all lymph node metastases are localized in nodes smaller than 10 mm in diameter, and thus below the diagnostic size criterion of CT/MRI.
Adams et al. (1998) studied 60 patients with histologically proven squamous cell carcinoma by PET imaging before surgery. Pre-operative endoscopy (including biopsy), CT, MRI and sonography of the cervical region were performed in all patients within 2 weeks preceding whole-body FDG-PET. Histopathology of the resected neck specimens revealed a total of 1284 lymph nodes, 117 of which showed metastatic involvement. In that study FDGPET had a sensitivity of 90% and a specificity of 94% for the detection of lymph node involvement. In contrast, the sensitivity and specificity were 80% and 79% for MR imaging and 82% and 85% for CT, respectively.
Another study reported that the disease probabilities in the lymph nodes were 81.2% for a positive PET and 4.5% for a negative PET result in the initial staging of the disease (Goerres et al. 2003).
Reasons for false-negative PET studies may include a small tumor burden in metastatic nodes, and cystic degeneration or necrosis of metastatic nodes only surrounded by a small rim of viable tumor tissue. In addition, nodal metastases in close proximity to the primary tumor may not be detectable as separate hypermetabolic foci.
False-positive PET findings are usually found in benign lymph nodes containing inflammatory
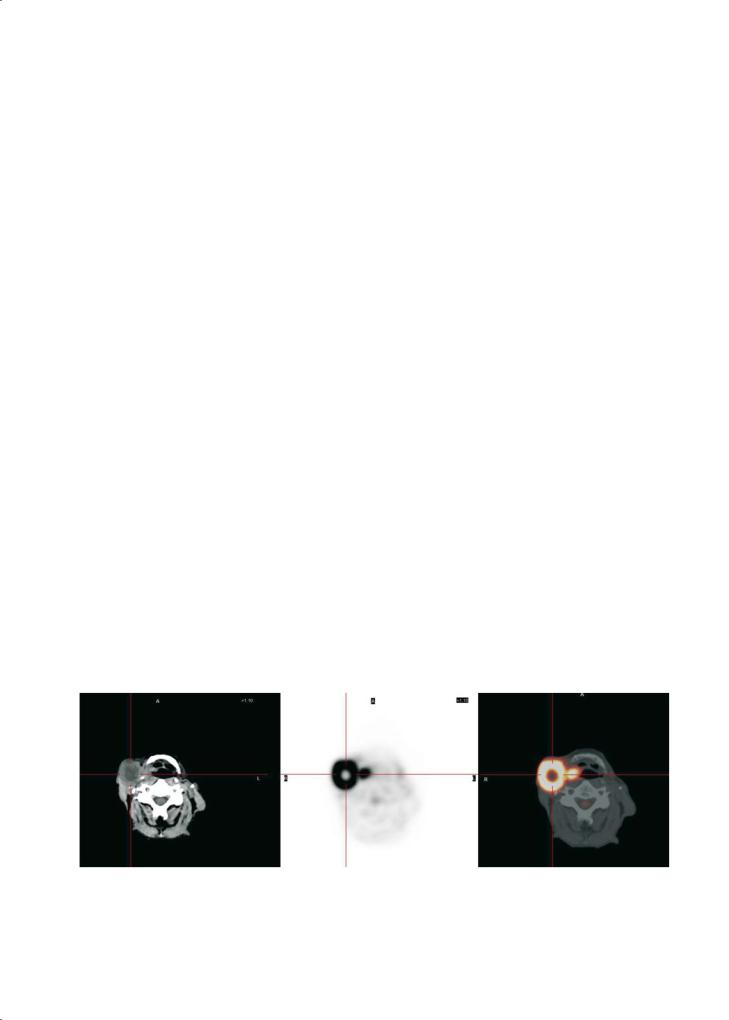
Fig. 17.4. A 58-year-old man with a pharyngeal tumour and a large ipsilateral cervical adenopathy. Transversal PET-CT images show an area with abnormal uptake at the primary tumour site in the pharynx. A large necrotic node in close proximity to the primary tumour is well visualised; only the small rim of viable tumour tissue shows FDG uptake

Positron Emission Tomography in Head and Neck Cancer |
335 |
cells. Reactive changes due to biopsy can also induce sometimes false-positive results. Several authors studied whether quantification techniques could be useful to differentiate true from false-positive lesions. However, quantification of the nodal FDG uptake, expressed as SUV, is not useful for differentiating malignant from reactively inflamed but benign lymph nodes (Kao et al. 2000; Braams et al. 1995). The imperfect specificity, due to false-positive FDG uptake in inflamed lymph nodes has to be corrected by ultrasound guided biopsy or fine needle aspiration. In order to reduce sampling errors the exact anatomical localization of the PET hot spot by means of a correlative PET-CT imaging approach is crucial. The CT information facilitates the correct identification and localization of lymph nodes with increased FDG uptake. The anatomic level can be identified easily, helping in surgical and radiation planning. Using PET-CT, the assessment of loco-regional disease is performed more easily and quickly. Branstetter et al. (2005) recently compared combined PET-CT to PET and CT alone in depicting malignant lesions in the head and neck. A total of 65 consecutive patients known to have or suspected of having head and neck cancer were examined with combined PET-CT. CT was performed with intravenous administration of contrast agent. Each examination was interpreted in three ways: PET images in the absence of CT data, CT images in the absence of PET data, and fused PETCT images. In this series, PET-CT had a sensitivity of 98%, a specificity of 92%, and an accuracy of 94%; observer confidence was substantially improved with the combined modality.
Other authors (Syed et al. 2005) have compared the interobserver agreement and degree of confidence in anatomical localisation of lesions using PET-CT and PET alone in 24 patients with head and neck cancer. A total of six primary lesions were identified on PET alone and on PET-CT. In all, 15 non-primary tumor sites were identified by PET alone, while 17 by PET-CT. Using PET alone, correct localisation was documented in three of six primary lesions, while PET-CT correctly identified all primary sites. In nonprimary tumor sites, PET-CT improved the degree of confidence in anatomical localisation by 51%. They conclude that PET-CT significantly increases interobserver agreement and confidence in disease localisation in patients with head and neck cancer.
The pre-surgical staging of the clinically N0 neck is severely hindered by the relatively high false positive and negative rates of currently available conventional imaging techniques. The major problem is a lack of sensitivity for micrometastatic disease. Hamakawa
et al. (2000) studied 554 non-metastatic cervical lymph nodes taken from 73 patients with oral cancer by hematoxylin-eosin staining and keratin immunohistochemistry. Occult metastasis was detected in six small lymph nodes < or =5 mm in diameter. The average minor axis of the micrometastasis was 1.36±0.85 mm. This size is far below the technical resolution of the PET scanner, wich is 4–5 mm. PET has therefore probably no place in the staging of cN0 neck (Stoeckli et al. 2002). The sole reliable analysis for correct staging of a cN0 neck still is the careful histologic work-up of the neck dissection specimen.
Sentinel node scintigraphy, indicating which locoregional lymph node to assess microscopically for the presence of malignant cells, has been proposed as a better means for N staging. The technique has evolved as a new standard in breast cancer and melanoma staging. Several preliminary studies in recent years proved sentinel lymph node biopsy to be highly effective also for the detection of occult lymph node metastasis in the field of oral cancer (Balkissoon et al. 2004). In a recent study, Kovacs et al. (2004) proposed a diagnostic ladder, including PET-FDG, as a prerequisite for performing sentinel node scintigraphy (coupled to a probe guided biopsy). They concluded that this staging ladder could considerably reduce the number of extensive neck dissection in oropharyngeal squamous cell carcinoma. These preliminary results should be confirmed by other research groups.
17.2.2.3
Assessment of Distant Metastasis
and Synchronous Second Primary Malignancies
One of the advantages of PET imaging is its ability to scan the entire body for disease activity. This allows the detection of a synchronous second primary tumor and distant metastases. Because most secondary cancers observed in head and neck cancer patients, such as bronchogenic cancer and squamous cell carcinoma of the oesophagus, show a high FDG uptake, whole body PET is ideal to identify them (Fig. 17.5). Stokkel et al. (1999) reported that FDGPET detected a second primary tumor in 12 of 68 patients with primary head and neck cancer.Among the 12 patients, only five were also detected by clinical or radiologic examinations. In a recent prospective study of 33 patients with stage II–IV carcinoma of the oral cavity, oropharynx and larynx, FDG-PET detected distant metastases or synchronous second primary tumors in the aerodigestive tract in almost 30% of cases (seven distant metastases and three syn-
336 |
C. Castaigne et al. |
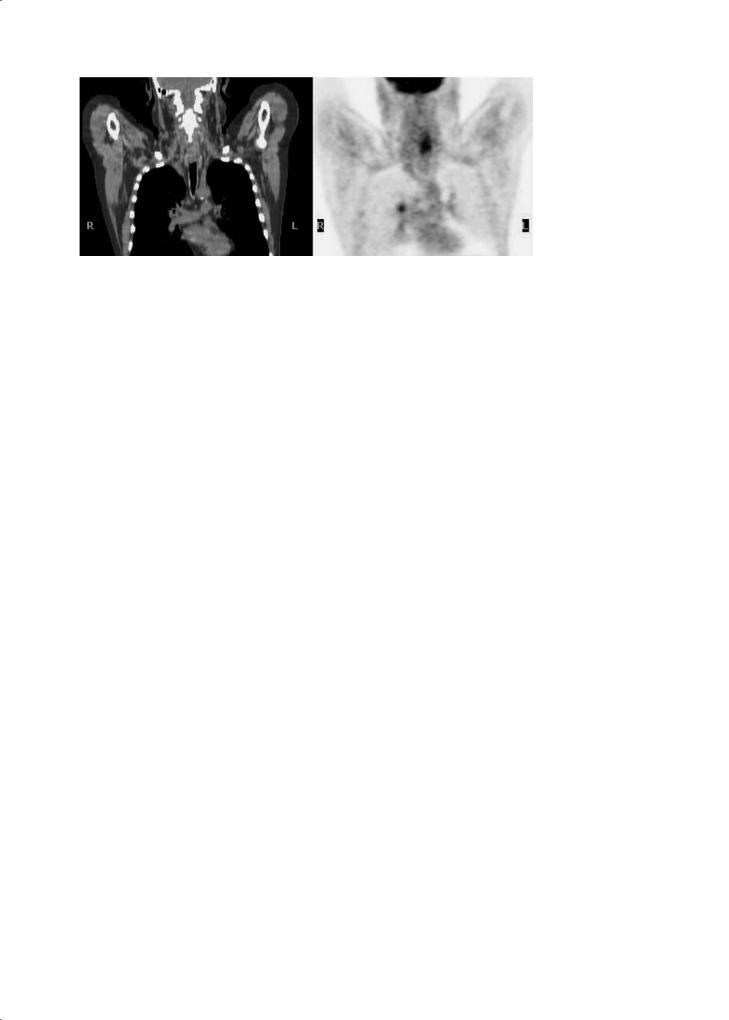
Fig. 17.5. Whole body PET-CT in a 59-year-old man with a SCC of the pharynx also shows an increased FDG uptake at the right pulmonary hilar region, confirmed to be an early stage primary lung cancer
chronous second primary tumors) (Schwartz et al. 2003). Nishiyama et al. (2005) evaluated the presence of simultaneous primary tumors in 53 patients with head and neck cancer. Six patients (11%) had evidence of a simultaneous primary tumor, and five were detected by PET.
17.2.3
Detection and Staging of Recurrent Disease
The basic rationale for the use of PET in the posttherapeutic surveillance of patients with previously treated head and neck SCC is that earlier and more accurate detection of cancer recurrence may improve survival. The specificity of anatomy-based imaging modalities is severely hampered by post-treatment anatomic distortions, tissue thickening, fibrosis and the presence of post-surgical flaps. Indeed, the findings on CT and MRI studies are often equivocal regarding the detection of recurrent or residual tumors in the irradiated or post-surgical head and neck region, and therefore further diagnostic evaluation is required. Deep and multiple biopsy specimens must therefore often be performed for confirmation of cancer. However, doing so can induce necrosis and/or infection in irradiated tissue.
FDG-PET has a high sensitivity and specificity for the detection of recurrent disease, regardless of the primary treatment modality. Results of recent studies indicate a sensitivity between 83% and 100% and a specificity between 61% and 94% for FDG-PET, compared to CT/MRI rates of 38%–75% and 44%–100%, respectively (Schöder et al. 2004a).
The “gold standard” for identifying residual disease in head and neck SCC after therapy is fine-nee- dle biopsy. Collins et al. (1998) demonstrated that if
the results from both the fine needle biopsy and FDGPET were combined, a sensitivity of 94% for detecting recurrent head and neck cancer can be achieved.
Across all studies, the negative predictive value of FDG-PET for detection of recurrent disease is consistently high. Therefore, one could conclude that in a patient with a clinical suspicion of recurrence, a negative FDG-PET scan does not require any further evaluation. In these patients, repeated biopsies should therefore be avoided as these are associated with an increased risk of complication in irradiated tissues, in particular in the larynx.
A probability analysis to assess the clinical utility of FDG-PET in patients with head and neck cancer concluded that the main advantage of PET is the ability to reliably rule out the presence of disease at restaging (Goerres et al. 2003). In the assessment of recurrence, PET had positive and negative likelihood ratios of 3.96 (2.8–5.6) and 0.16 (0.1–0.25), resulting in probabilities of 49.7% and 3.8%, respectively.
Of special interest is a study by Kunkel et al. (2003) who studied 97 patients with previously resected oral squamous cell carcinoma who were restaged by FDG-PET. Although 52 of 97 patients had undergone at least one major flap reconstruction, which typically may camouflage regrowth of the tumor, FDG was highly sensitive in revealing tumor recurrence (87%). The specificity of PET varied from 67% for local disease recurrence/second primaries to 99% for lymph node metastasis. Increased FDG uptake predicted an increased hazard of death (hazard ratio, 6.83) and proved to be a highly predictive marker of disease status.A significant association was established for incremental SUVs and 3-year patient survival, indicating that intense glucose metabolism in the tumor is a negative marker of survival in recurrent oral SCC. The authors suggested that a negative
Positron Emission Tomography in Head and Neck Cancer |
337 |
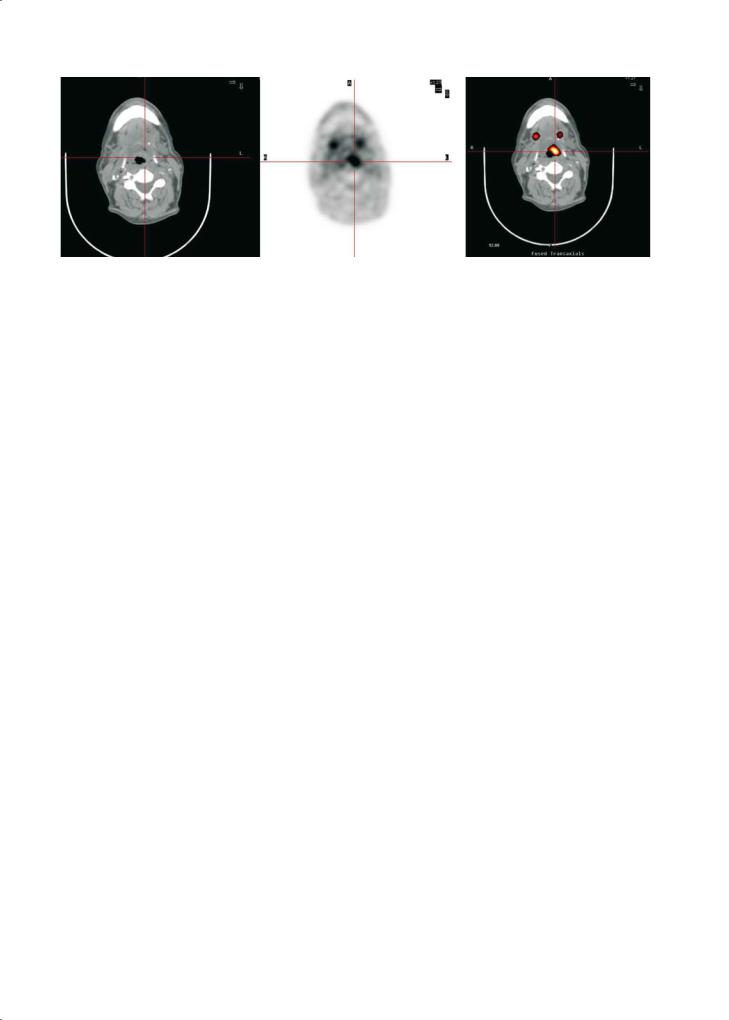
Fig. 17.6. FDG PET-CT images in a 64-year-old man with an history of epiglottic cancer treated by radio-chemotherapy. At 9 months after treatment MRI showed an asymmetry of the epiglottis with no contrast uptake. Transversal PET-CT images show an area of abnormal uptake in the left part of the epiglottis. The PET-CT fusion images allow exact localisation of the lesion. Biopsy confirmed tumor recurrence
PET could justify an early onset of reconstruction measures. If, however, glucose uptake is high, major reconstruction steps should be delayed until further evaluation.
The major challenge of using PET in the setting of recurrent disease is to avoid false-positive diagnosis, particularly at the primary tumor site. Local therapies often induce an inflammatory infiltrate that consists of neutrophils, lymphocytes, and macrophages as well as proliferating fibroblasts. All these cells intensely accumulate FDG. Moreover, most local recurrences are seen in the first 2 years after radiotherapy, coinciding with the period of risk for local inflammation (Terhaard et al. 2001). In that case it is often impossible to discriminate an inflammatory falsepositive from a malignant true-positive FDG uptake. Careful correlation of PET and CT/MRI is hereby essential.A positive PET scan without any suspect morphologic correlate requires a biopsy; if the biopsy is negative for recurrent cancer and does not provide reasons for a false-positive PET (inflammation, infection, osteoradionecrosis, etc.), close clinical follow-up and a repeat biopsy may be required. In addition, it is advisable to repeat the PET scanning procedure some weeks later. Terhaard et al. (2001) reported that repeated FDG scanning improved the specificity from 63% to 82% and the positive predictive value from 71% to 84%. If the follow-up FDG-PET shows a decreasing FDG uptake intensity the probability of an underlying recurrence is low and a repeat biopsy can be avoided.
The timing between the PET scan and the end of the local therapy (principally the radiotherapy) is controversial. It may take up to 3 months after radiotherapy for the tumor to disappear completely (Bataini et al. 1990). Some authors reported that early PET after radiotherapy was inaccurate in pre-
dicting the presence of cancer; 4 months after radiotherapy was a better predictor of cancer (McGuirt et al. 1995b; Greven et al. 2001). Lonneux et al. (2000) demonstrated that the specificity of PET is drastically reduced in patient scanned early (< 12 weeks) after the end of therapy, related to the high glucose uptake by inflammatory cells that are abundant in irradiated sites. In that study, the accuracy of PET was highest (94%) in the patient subset included more than 12 weeks after the end of the treatment. In contrast, Goerres et al. (2004) support the use of PET performed 6–8 weeks after the completion of a combined radiation and chemotherapy regimen in patients with advanced stage SCC to assess the presence of residual tumor tissue, distant metastases and secondary tumors.
Most studies were conducted in patients who were clinically suspected of having recurrent tumor. The accuracy of FDG-PET for the detection of subclinical recurrence has been studied by Lowe et al. (2000). For this, serial post-therapy FDG-PET imaging was prospectively performed in 44 patients with advanced cancers who had been treated according to a neoadjuvant organ-preservation protocol that included chemotherapy, radiation therapy, and surgical salvage. PET was performed twice during the first posttreatment year (at 2 and 10 months after therapy) and thereafter as needed. PET was studied in comparison to physical examination (including endoscopy) and CT. In all, 16 patients were found to have recurrent disease in the post-operative year. The sensitivities and specificities were calculated to be 44% and 100% for physical examination, 38% and 85% for CT, and 100% and 93% for PET. PET had a statistically significant advantage over the other techniques.
Semiquantitative image analysis using SUV measurements may aid in the interpretation but should not

338 |
C. Castaigne et al. |
be the sole criterion on which the study interpretation rests. For instance, Lapela et al. (2000) reported the FDG-PET results obtained in 56 patients with 81 lesions clinically suspect for recurrent carcinoma. The purpose of the study was to compare qualitative image interpretation with quantitative analysis (using SUV). It was found that the visual image analysis was the preferred one, because benign and malignant lesions showed an important overlap in SUV values.
PET-CT could improve the accuracy of detection of a recurrent lesion thanks to the anatomical information provided by the coregistered CT. In a recent study, Schöder et al. (2004b) compared the diagnostic accuracy of attenuation corrected 18FDG-PET with fused 18FDG-PET and CT in patients with head and neck cancer. They also evaluated the effects of PET/CT findings on patient management. A total of 68 patients were reviewed (34 recurrences), presenting a total of 155 foci with abnormal FDG uptake on PET images alone. PET/CT image fusion improved the anatomic localization of 63% of these lesions. The proportion of lesions for which PET/CT image fusion improved the anatomic localization tended to be higher in areas previously treated (surgery or radiotherapy) compared to untreated areas of the head and neck (74% vs. 58% respectively, p=0.06). With PET/CT, the fraction of equivocal lesions decreased by 53% (p<0.01). PET/CT had a higher accuracy of depicting cancer than did PET (96% vs. 90%, p=0.03). Six proven malignancies were missed by PET, while only one was missed by PET/CT. PET/CT findings altered patient management in 18% of patients. The authors concluded that PET/CT is more accurate than PET alone in the detection and anatomic localization of head and neck cancer and has a clear potential to affect patient management.
17.2.4
FDG-PET in Radiation Treatment Planning
Since the introduction of three-dimensional conformal radiation therapy (3DCRT) and intensitymodulated radiation therapy (IMRT), an accurate three-dimensional delineation of target volumes in radiotherapy becomes more and more important. CT has become the reference imaging tool for treatment planning. It provides accurate anatomical definition without geometric distortion. However, the lack of soft tissue contrast between tumors and their surrounding tissues lead to significant intraand interobserver variations in tumor volume delineation (Hermans et al. 1998).
Only a few reports have studied the potential role of 18FDG-PET for the delineation of gross tumor volume (GTV) in HNSCC (Daisne et al. 2004; Geets et al. 2004).
Daisne et al. (2004) compared CT, MRI and 18FDG-PET for delineation of GTV in 29 patients with pharyngolaryngeal squamous cell carcinoma. They validated the results with the macroscopic surgical specimen when available (nine patients). The average GTV delineated on the surgical specimen was 12.6 cm3. This volume was smaller than the average GTV assessed by FDG-PET (16.3 cm3, p=0.06), CT (20.8 cm3, p=0.003) and MRI (23.8 cm3, p=0.001). The key finding of this study was that, in comparison with the surgical specimen used as the reference, all the imaging modalities overestimated the tumor extension. Despite this finding, all three imaging modalities failed to depict superficial tumor extension, thereby revealing their insufficient spatial resolution. This warrants the need for adding a security margin that covers the predictable microscopic extension of the tumor to the GTV, which results in the clinical target volume. No significant difference was observed between GTVs delineated at CT and MRI, whereas GTVs assessed at 18FDG-PET were smaller compared to CT and MRI, with a difference ranging from 28% to 37%. The finding that the GTVs delineated at 18FDGPET were by far the closest to the reference volume assessed from the surgical specimens could have important implications for radiation therapy planning. Another important point made in that study was that PET derived GTVs could be automatically delineated using an automatic algorithm that determined the appropriate iso-activity curve threshold according to the source to background ratio (Daisne et al. 2003). This substantially reduces the duration of the contouring procedure compared to CT or MR imaging and eliminates intraor interobserver variability. Although the 18FDG-PET-derived GTVs were more accurate than those at CT or MRI, they were still larger than those delineated from the surgical specimens. This overestimation may result from the algorithm used for automatic delineation and/or from the spatial resolution of PET. To date, the question of how the target volume definition would be affected if treatment planning were based only on the area of increased FDG uptake remains to be addressed. Furthermore, it is not known whether such a change of radiation planning would improve local cancer control and outcome for patients. Further work on this interesting topic will undoubtedly be published during the coming years. More information on the use of imaging modalities for radiotherapy planning is found in Chap. 18.

Positron Emission Tomography in Head and Neck Cancer |
339 |
17.2.5
Therapy Monitoring and Planning
It is well known that functional changes, such as tissue metabolism and physiologic functions, often predate structural changes in tissues. Preliminary results from several in vitro and in vivo experiments in different tumor models have recently shown that the change of FDG accumulation early after chemoor radiotherapy, before any structural effects have occurred, can predict the responsiveness of the tumor to the treatment (Young et al. 1999).
17.2.5.1 Radiotherapy
Histologically similar tumors may respond to irradiation at different rates, and in vitro assays indicate remarkable differences in inherent radiosensitivities of squamous cell cancer of the head and neck (PekkolaHeino et al. 1992). Since radiosensitivity assays are technically demanding and too slow to be used in routine clinical practice, a reliable and clinically feasible method to predict the outcome of radiotherapy would be of great value. A method capable of early recognition of patients likely to have a poor response to standard radiotherapy would give an opportunity for a more individualized therapy, and save those patients with radiosensitive tumors from mutilating surgery. The use of metabolic imaging techniques in this regard looks very appealing because, by means of these techniques, early metabolic changes induced by the treatment may relate to a final responsiveness of the particular tumor to a particular treatment.
Using conventional diagnostic modalities for identification of residual disease during and after radiation therapy is hampered by radiation-induced facial plane distortion, dense scarring, inflammation and fibrosis. Minn et al. (1988) were the first to indicate the potential of FDG-PET to assess the effects of radiation on head and neck SCC. In that study, 19 patients were studied before and during radiation therapy (at 30 Gy). Of the 19 patients, 14 had decreased FDG uptake in the treated neoplasm. Of these 14 patients, 12 had a marked subjective response to radiotherapy. It was found that among the responders the administered dose of radiotherapy correlated with the decrease in FDG activity. Rege et al. (1993) reported on the effects of radiotherapy on the FDG uptake in normal structures within the radiation port. For this, 11 patients were studied with FDG-PET before, during and 6 weeks after a 6-week course of radiation therapy. FDG uptake in the pri-
mary tumor increased early during the course of radiotherapy (< 20 Gy) but decreased near the end of therapy (> 45 Gy), whereas there was no significant change in normal structures of the neck after 6 weeks of radiotherapy. Tumour FDG uptake decreased in all responding cases, but increased after 6 weeks of treatment in those resistant to treatment. They concluded that persistent uptake on FDG-PET 1 month after radiotherapy strongly suggests residual tumor and that tissue changes immediately after the initiation on radiotherapy may lead to false-positive findings. This early ‘flare’ phenomenon could be explained as a stress reaction of the tumor cells themselves, which has been observed in vitro during chemotherapy, or can be caused by infiltration of the tumor bed by FDG avid inflammatory and scavenging cells. Greven et al. (1994) studied 22 head and neck SCC patients before and 1 and 4 months after high dose irradiation. All patients’ tumors showed decreased levels of FDG uptake. Post-radiation PET scans were interpreted as normal in 16/22 patients. Of these, three had histologically documented persistent or recurrent disease. Of the six patients with decreased but persistent FDG uptake, persistent disease has been documented in all. Thus, also this study pointed out that negative findings on scans obtained 1 month after treatment were not an accurate indicator of absence of disease, and that persistent FDG uptake is a bad prognostic sign. In a more recent study, Kunkel et al. (2003) reported that post-radiotherapy FDG uptake predicts survival and local tumor control. The authors analyzed the prognostic significance of glucose metabolism after neoadjuvant radiotherapy (36 Gy) immediately before tumor resection. The 3-year survival rates were 80% in the group with a low SUV (< 4) and 43% in the group with a high SUV (≥ 4). A high FDG uptake was associated with an increased death rate and local progress even when radical resection was performed.
17.2.5.2
Chemotherapy and Combination Therapy
17.2.5.2.1 Early Response
There is a paucity of FDG-PET data obtained during the course of chemotherapy in patients with head and neck SCC and the comparison of the results is difficult because of differences in methods of analyses and the small number of patients studied.
The first report on the use of FDG-PET to assess the metabolic response of head and neck SCC to

340 |
C. Castaigne et al. |
chemotherapy was published by Haberkorn et al. (1993). In all, 11 patients underwent FDG-PET imaging before and 1 week after a first chemotherapeutic cycle (5-FU and cisplatinum). The chemotherapy induced change in FDG uptake was correlated with the growth rate as measured by serial CT. It was observed that multiple lymph node in the same patient showed different baseline metabolisms and also different changes following therapy. This was explained by the concept of cell heterogeneity in human tumors; different metastatic clones can lead to metastases with a different biologic behaviour and reactivity to a treatment. Also, in the same study, the primary tumors were more sensitive to therapy than the metastatic lymph nodes.
Lowe et al. (1997) performed serial FDG-PET imaging in 27 patients with stage III/IV head and neck SCC before and after (1–2 weeks) chemotherapy. The sensitivity and specificity of PET for detection of residual disease was 90% (19/21) and 83% (5/6), respectively. Those who achieved complete remission had a mean reduction in FDG uptake of 82%; in comparison, those who had residual disease after therapy had a reduction of 34%.
Dalsaso et al. (2000) prospectively evaluated FDG-PET before and after two or three cycles of chemotherapy in 19 patients with stage III or IV head and neck SCC. A complete pathologic response on biopsy was observed in three patients who had a mean SUV reduction of 82%, the others who had an SUV reduction of only 32% were determined to have residual disease after chemotherapy.
Brun et al. (2002) evaluated FDG-PET for the prediction of radiochemotherapy outcome in locally advanced SCC. A total of 47 patients underwent FDG-PET before and after 1–3 weeks of radical treatment with evaluation of metabolic rate (MR) and SUV. All patients received radiotherapy, and ten also received neoadjuvant chemotherapy. After therapy a high FDG MR (> 16 µmol/min/100 g) was associated with a complete response in 62% of patients while remission occurred in 96% of patients with a low MR (<16 µmol/min/100 g), with 5-year overall survival in 72% and 35%, respectively. Posttreatment SUV showed a poorer association with survival.
17.2.5.2.2
After Completion of Treatment
It is always a challenge to determine the most optimal period for performing FDG-PET imaging during the post-therapy follow-up period.
As already discussed above, FDG-PET performed shortly after a treatment may be associated with high false-positive results because of the tissue healing process, and with false-negative results because of alterations in FDG uptake kinetics. The optimal timing is a balance between a number of competing factors, which include sufficient time for resolution of the therapy induced inflammatory response (to minimize false-positive results) and for residual disease to reach the threshold of resolution by PET (to minimize false-negative results).
In a recent study, Porceddu et al. (2005) evaluated the utility of PET in detecting residual disease in the neck lymph node, at least 8 weeks after (chemo-) radiotherapy in 39 patients who have achieved a complete response at the primary site. In all, 32 patients had a negative PET for residual nodal disease. Only one locoregional failure was observed during the median follow-up of 34 months. The negative predictive value of PET for viable disease in residual neck node was 97%, while the positive predictive value was only 71%. These authors conclude that patients who achieved a complete response at the primary site but have a residual abnormality in the neck which is negative on FDG-PET performed approximately 12 weeks after treatment, do not require neck dissection and can be safely observed. Further studies are needed for confirmation.
Another study on the effects of combined radiochemotherapy was reported by Sakamoto et al. (1998). A total of 22 patients were scanned before treatment, and 1 month after radiotherapy and/or chemotherapy (carboplatin). The mean radiation dose was 57 Gy for the patients undergoing radiation therapy alone, and 42 Gy for those undergoing combination therapy. The post-therapy SUVs were significantly lower than the pre-therapy values (mean 7.0 vs. 3.8). The mean post-therapy SUVs in patients with complete response, partial response and stable disease (no response) were 2.7, 3.6, and 4.5. Histopathological examination revealed that patients with residual viable tumor cells had significantly higher SUVs (range, 2.9–8.3) than those without viable tumor cells (range, 1.9-3.3). These findings were confirmed by Kitagawa et al. (1999). They evaluated the use of FDG-PET to assess the effectiveness of combined intra-arterial chemotherapy and radiotherapy of head and neck SCC. A small group of 14 patients completed the treatment regimen and underwent FDG-PET before and 4 weeks after chemoradiotherapy. In this patient group, pre-treatment FDG uptake was predictive for the response to treatment. Patients with post-treat-